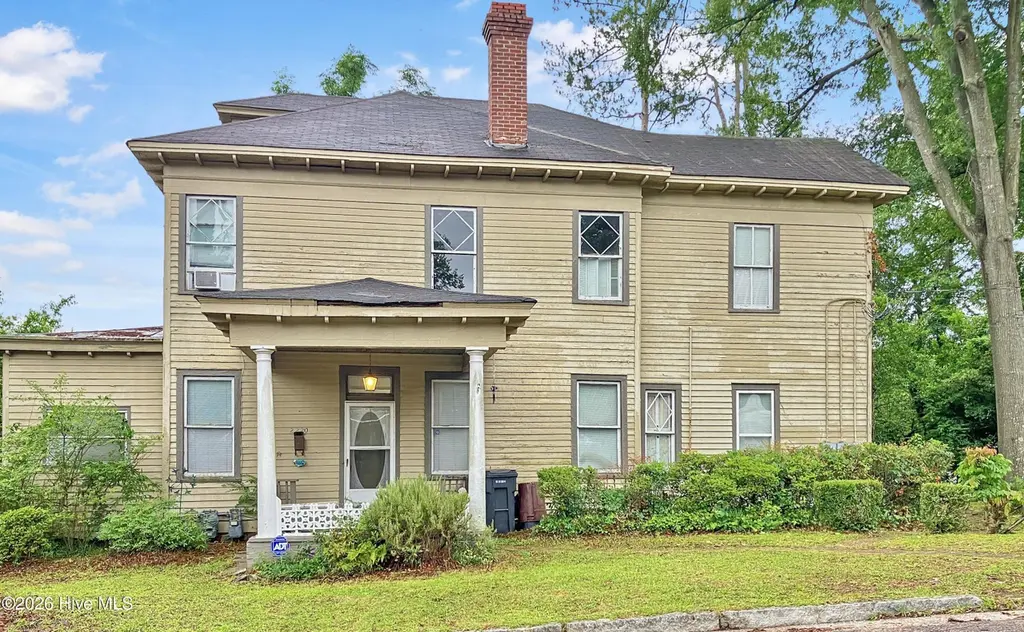
 Triplex
2220 Queens Way · Augusta-Richmond County consolidated government (balance), GA
Flood risk 1/10 · Minimal
- FEMA flood zone
- X (unshaded)
- Chance of flooding over 30 yrs
- 0.0%
- Est. flood insurance / yr
- $507 – $1,088
Fire risk 1/10 · Minimal
- Est. fire insurance / yr
- $963 – $1,789
Heat risk 7/10 · Major
- Hot days now (above 107°F)
- 6 days/yr
- Hot days in 30 yrs
- 15 days/yr
Wind risk 6/10 · Moderate
- Chance of severe wind over 30 yrs
- 67.0%
Air-quality risk 4/10 · Minor
- Unhealthy air days now
- 4 days/yr
- Unhealthy air days in 30 yrs
- 4 days/yr
Risk factors via First Street. Map © Google.
Why this score? — see what drove the D grade
The composite is a weighted blend of 9 inputs, each scored 0–100. Each bar is that input's sub-score; the figure is the points it added to the 100-point composite (weight × sub-score).
- Cash flow +16.5/30.0
- ARV discount +7.5/15.0
- DSCR +5.1/10.0
- 1% rule +4.3/10.0
- Rent growth +3.6/5.0
- Livability +2.5/5.0
- Condition / age +2.5/5.0
- Schools +1.3/10.0
- Appreciation +0.0/10.0
$375,000
🖨 Deal sheet 📄 Offer letter ✓ Due diligence
Multi-family units
County records classify this as Multi-Family (2-4 Unit). Listing-text estimate: 3 units. confirmed
Listing remarks
Rare Investment Opportunity in Augusta's Historic Summerville District! Nestled in one of Augusta's most sought-after neighborhoods, this unique triplex offers the perfect blend of investment potential and owner-occupant convenience. Two of the three units are already occupied, providing immediate rental income, while the third unit is available for you to move in--or rent out for additional cash flow. Located less than a mile from Augusta University and the thriving Medical District, this property is ideally positioned for students, medical professionals, and long-term tenants alike. Surrounded by the charm, character, and prestige of Summerville, this income-producing property presents en
Key facts
- Versatile property
- Triplex
- 0.25 acre lot
Tags
Property features AI
Finance
- Financial info: Contains three rental units with reported rents: 1-bed $775, 2-bed $1,025, 2-bed (furnished) $975
Exterior
- Parking: On-street parking
- Security: Smoke detector(s)
- Utilities: Public water; Public sewer; Electricity connected; Natural gas connected; Cable available; Water connected; Sewer connected
- Home design: Residential income property (Triplex); Two-story
- Construction: Wood siding and frame construction
- Exterior features: Front porch; Porch; Partial fencing in back yard; Corner lot; Has view; Composition roof
Interior
- Kitchen: Electric oven; Electric cooktop; Range; Refrigerator; Dishwasher
- Bedrooms: One 1-bedroom unit (unfurnished); One 2-bedroom unit (unfurnished); One 2-bedroom unit (furnished)
- Flooring: Carpet; Wood
- Heating & cooling: Central air conditioning; Forced air heating; Natural gas heating
- Interior features: Ceiling fans; Eat-in kitchen; Window coverings; Smoke detector(s)
- Laundry & utility: Laundry located in hall; Laundry located in kitchen; Gas water heater
Neighborhood map
What this means for you Summary
Snapshot
- This is a 3 × 2-bed/1.0-bath units multifamily listed at $375k.
Deal economics
- At list price, monthly cash flow is $222 ($3k/yr) — positive. Per door: $74/mo.
- The deal already cash-flows at list — no discount required.
- To meet the 1% rule (rent ≥ 1% of price), the offer needs to be $349k (6.9% below list).
- Recommended offer: $349k (6.9% below list) — sets the bar for 1% rule.
- Cap rate 7.0% vs local median 5.3% in Augusta-Richmond County consolidated government (balance) — top-decile yield for the area; either an underpriced asset or a hidden risk that comps aren't pricing in. Stress-test before assuming the spread holds.
Location & tenants
- Location reads: area grade D — affects rentability + tenant quality, not the cash-flow math above.
- Richmond County (urban): math 12% / reading 20% proficiency, ranked #154 of 174 in GA (top 88%) — low school quality limits family demand, transient renter base, plan for 1-2y turnover; 72% free/reduced lunch — lower-income household profile, screen leases tightly.
- Zoned schools: Monte Sano Elementary School (math 2% / reading 8%, grade F, #1,160 of 1,228 statewide, top 98%, 410 students, 98% FRL); Tutt Middle School (math 7% / reading 21%, grade F, #405 of 470 statewide, top 86%, 476 students, 98% FRL); Academy of Richmond County High School (math 2% / reading 17%, grade F, #365 of 424 statewide, top 88%, 1,141 students, 98% FRL) — zoned schools average 98% FRL vs 72% district-wide (26 pts higher); higher-poverty schools than district average — tighter screening recommended.
- Market conditions: Rents rising fast (+4.3%/yr); 222 active listings in the ZIP; 3 comparable units currently listed for rent nearby; rentals lingering (median 44d on market — plan ~5-8 weeks vacancy on turnover, expect pricing pressure); 67% of comp listings sitting > 30 days — soft ceiling on asking rent; 561 units permitted in Richmond County in 2024 (0 in 5+ unit buildings).
- At $3,493/mo this rent would consume 90% of the median local household income ($47k/yr) (locally 1594% of renters already pay >50% of income on rent) — very limited rent-growth headroom before tenants either downsize or default.
Forward outlook
- Local home prices are declining (-3.0%/yr); year-one equity from $3k of loan paydown is wiped out by about $11k of value loss. Plan a longer hold.
- Richmond County population projected to shrink 5% by 2050 — rents likely to lag national; underwrite the cash flow, not the appreciation.
Negotiation context
- It's been on market 17 days — a 2% lower offer ($369k) is reasonable based on typical stale-listing flexibility.
- 7 sale attempts since 7y ago with the ask held roughly flat each time — persistent listings suggest the price (not the market) is what's stuck; bring a comps-based counter.
Risks & watch-outs
- Watch-outs: built in 1908 — expect roof / HVAC / electrical / plumbing capex.
- Climate carrying-cost: major wind risk, 67% chance of damaging wind over 30y; extreme-heat days projected 6→15/yr by 2055 (HVAC capex compounding) — expect insurance premiums to compound above CPI over the hold.
Questions for the listing agent
- Can we see the unit-by-unit rent roll, current vacancy, and any below-market leases? What's the average tenancy length?
- What capital expenditures (roof, boiler, parking lot, exteriors) have been made in the last 5 years, and what's planned in the next 2?
- Built in 1908 — when were the roof, HVAC, electrical panel, plumbing, and water heater last replaced?
- Is there a deadline driving the sale (1031 exchange, divorce, estate, relocation)? That informs how much negotiation room exists.
- The area grade is low — what's the realistic commute time and amenity access for the typical tenant pool here? Any planned neighborhood developments (good or bad) we should know about?
- What's the average days-on-market for RENTAL listings here right now (not sales)? A rising rental-DOM trend means longer vacancies and softer asking-rent achievability than the comps imply.
- What's the recent tenant-quality profile in this submarket — average credit score on applications, eviction rate, late-payment / NSF rate, and stable-employment percentage? A property-management company in the area should have these aggregated.
- How much new apartment / multifamily construction is in the pipeline within 1–3 miles? Heavy new supply (>2% of stock underway) typically softens rents 12–24 months out; light construction supports rent growth.
Investment metrics
- 1% rule
- 0.93% ✗
- Cap rate
- 7.00%
- Cash-on-cash
- 2.53%
- DSCR
- 1.11
- GRM
- 8.9
CMA / ARV
No comps found within radius.
Projected returns pro-forma
-3.0% appreciation · 4.29% rent growth · sell at horizon
- IRR
- -10.9%
- Equity multiple
- 0.60×
- Total profit
- $-42,040
- Equity at exit
- $55,914
- IRR
- 0.1%
- Equity multiple
- 1.01×
- Total profit
- $991
- Equity at exit
- $32,423
Cash invested: $105,000 (down + closing). Projections, not guarantees.
Landlord ↔ Tenant lean methodology
- Overall (STATE)
- 90 Strongly Landlord-Friendly
- State Georgia
- 90 Strongly Landlord-Friendly · R+3
- County
- — inherits STATE
- City
- — inherits STATE
ZIP-level market 30904
- Rents YoY
- 4.3%
- Active inventory
- 222
- Price-to-rent
- 26.8×
Monthly cashflow live
- Estimated rent
- $3,493 high interval (Pro) →
- Mortgage (P&I)
- −$1,967
- Tax from tax record
- −$415 /mo · $4,981/yr
- Insurance
- −$156
- HOA
- −$0
- Vacancy / Maint / Mgmt
- −$734
- Net cashflow
- $222
Break-even live
3-unit breakdown (identical units grouped — click to expand)
| Units | Beds | Baths | Est. rent |
|---|---|---|---|
| 3× units | 2 | 1 | $3,492 |
| #1 | 2 | 1 | $1,164 |
| #2 | 2 | 1 | $1,164 |
| #3 | 2 | 1 | $1,164 |
| Total (3 units) | $3,493 | ||
UW: 25.0% down · 7.5% · 30yr · 1.5% tax · 5.0% vac · 8.0% maint · 8.0% mgmt
Financing live
Cash to close
- Down payment
- $93,750
- Closing costs
- $11,250
- Reserves months
- —
- Total cash needed
- —
Loan-product check · same deal, 3 products live
Conventional
25% down · 7.5% · 30yr
- Down + closing
- —
- Monthly P&I
- —
- Monthly cashflow
- —
- DSCR
- —
- Eligible?
- —
Personal DTI + credit; lowest rate.
DSCR
20% down · 8.5% · 30yr
- Down + closing
- —
- Monthly P&I
- —
- Monthly cashflow
- —
- DSCR
- —
- Eligible?
- —
No personal income docs; deal must DSCR.
Hard money
10% down · 12.0% · 12mo
- Down + closing
- —
- Monthly P&I
- —
- Monthly cashflow
- —
- DSCR
- —
- Eligible?
- —
Short-term bridge; refi at stabilization.
Rent comps 3 comps
| Address | Beds | Baths | Sqft | Rent | $/sqft | DOM | Units | Dist |
|---|---|---|---|---|---|---|---|---|
| 807 Barrett Ln Augusta, GA | 3.0 | 2.0 | 2242 | $2,250 | $1.00 | 43d | 1 | 1.44mi |
| 807 Barrett Ln Augusta, GA | 3.0 | 2.0 | 2242 | $2,200 | $0.98 | 23d | 1 | 1.44mi |
| 2279 Overton Rd Augusta, GA | 3.0 | 2.5 | 2209 | $1,895 | $0.86 | 43d | 1 | 1.48mi |
Listing history 12 events
-
2026-06-18days on market $375,000 Active 17 DOM
-
2026-06-17days on market $375,000 Active 16 DOM
-
2026-06-16days on market $375,000 Active 15 DOM
-
2026-06-15days on market $375,000 Active 14 DOM
-
2026-06-14days on market $375,000 Active 12 DOM
-
2026-06-10days on market $375,000 Active 9 DOM
-
2026-06-09days on market $375,000 Active 8 DOM
-
2026-06-08days on market $375,000 Active 7 DOM
-
2026-06-07days on market $375,000 Active 6 DOM
-
2026-06-03days on market $375,000 Active 2 DOM
-
2026-06-02remarks 699-char remark
-
2026-06-02$375,000 Active 1 DOM
ⓘ Source: listings_history table (triggers on properties + properties_extension) + one-shot
backfill from property_details.listing_events for pre-trigger history.
Tax reassessment forecast GA · Resets to sale price
- Current annual tax
- $4,981 · $415/mo
- Projected year-2 tax
- $4,981 · $415/mo
- Expected delta
- $0/yr ($0/mo · 0.0%)
ⓘ Screening estimate from a state-policy table — verify with the county assessor before closing.
Climate risk First Street
- Flood 1/10 Low FEMA zone X (unshaded) · 0% chance over 30 yrs
- Wildfire 1/10 Low
- Heat 7/10 Severe 6 d/yr ≥107°F today · 15 d/yr by 30 yrs out
- Wind 6/10 Major 67% chance of damaging wind over 30 yrs
- Air quality 4/10 Moderate 4 unhealthy d/yr today · 4 by 30 yrs out
Nearby sold comps map
Loading sold comps map…
Walkable amenities ~0.75 mi
Loading nearby amenities…
Taxation est. · year 1
- Rental income
- $41,916
- − Mortgage interest
- −$21,006
- − Property taxes
- −$4,981
- − Insurance
- −$1,875
- − Repairs & maintenance
- −$3,353
- − Management
- −$3,353
- − Depreciation
- −$10,909
- Taxable loss
- −$3,561
- Est. tax savings @ 24.0%
- +$855
- After-tax cash flow
- $3,514/yr
For passive investors: Depreciation is non-cash, so a rental often shows a tax loss while cash-flowing — sheltering income. Rental losses are passive: they offset passive income freely, and up to $25,000/yr can offset ordinary (W-2) income if you actively participate and your MAGI is under $100k (phasing out to $0 by $150k); unused losses carry forward. On sale, claimed depreciation is recaptured at up to 25%, and gains may owe capital-gains tax (a 1031 exchange can defer both). Figures are a year-1 estimate at your 24.0% rate — not tax advice; consult a CPA.
Schools (NCES district)
- District
- Richmond County
- NCES district ID
- 1304380
- Math proficiency
- 12% ▼ -9.00%
- Reading proficiency
- 20% ▼ -6.00%
- Median HH income
- $38,069
- Composite
- 13.43/100
- National rank
- #9524
- State rank
- #154 of 174 in GA
Livability — Augusta-Richmond County consolidated government (balance)
No livability data for this city. (Only ~50 U.S. cities are tracked.)
Census & demographics
- Census place
- Augusta-Richmond County consolidated government (balance), GA
- County
- Richmond County · 190,917 people
- City population
- 154,035
- Metro
- Augusta-Richmond County, GA-SC
- Population (ZIP)
- 23,400
- Household income
- $46,696
- Rent vs Own
- Severe rent burden
- 1594.0
Population outlook (Richmond County) Hauer SSP2
- Today (2025)
- 200,753 people
- By 2030
- 200,232 · -0.3%
- By 2040
- 196,813 · -2.0%
- By 2050
- 190,347 · -5.2%
- By 2075
- 172,496 · -14.1%
- By 2100
- 146,284 · -27.1%
Race, ethnicity, and origin ACS 2023
- Neighborhood character
- Diverse neighborhood (Simpson 0.61)
- Race & ethnicity
- Black 47% White 41% Hispanic / Latino 6% Two or more races 6% Asian 2%
- Hispanic origin (detail)
- Mexican 1%
- Common ancestry
- Italian 1% Slovak 1% Romanian 1%
- Foreign-born
- 3% · Canada, South Korea, Jamaica
- Languages at home
- 93% English-only · Spanish 4% Korean 1%
Political lean MEDSL · Richmond
- 2024 margin
- Solid D (+36.1) · D 67.8% · R 31.7%
- 2008→2024 swing
- +4.3pp toward D · 2008: 31.8pp · 2024: 36.1pp
- All cycles
- 2024: D+36.1 2020: D+37.2 2016: D+32.4 2012: D+33.8 2008: D+31.8
Not yet ingested
- Civics
- —
Market trends
- HPI YoY
- ▼ -211.97%
- Current HPI
- 199.0807
- Rent YoY
- ▲ 4.29%
- Metro
- Augusta-Richmond County, GA-SC
- State GDP YoY
- ▲ 2.66%
- F500 in state
- 28
Industry mix (Fortune 500 HQ in GA)
| Industry | F500 HQs | Revenue |
|---|---|---|
| Paper / Packaging | 2 | $29B |
|
||
| Retail | 1 | $160B |
|
||
| Transportation / Logistics | 1 | $91B |
|
||
| Airlines | 1 | $62B |
|
||
| Consumer Goods | 1 | $47B |
|
||
| Utilities | 1 | $25B |
|
||
Price history
+143.5% since first listed16 events — show timeline
- 2026-06-01 Listed $375,000 Hive MLS
- 2021-12-21 Sold (Public Records) $335,000 Public Records
- 2020-06-10 Listing Removed — Hive MLS
- 2020-06-10 Listing Removed — Hive MLS
- 2020-06-10 Listing Removed — Hive MLS
- 2020-06-10 Listing Removed — Hive MLS
- 2020-05-20 Listed $325,000 Hive MLS
- 2020-05-20 Listed $325,000 Hive MLS
- 2020-04-14 Listed $325,000 Hive MLS
- 2020-04-14 Listed $325,000 Hive MLS
- 2019-10-24 Sold (Public Records) $130,000 Public Records
- 2019-10-17 Sold (MLS) $130,000 Hive MLS
- 2019-10-17 Sold (MLS) $130,000 Hive MLS
- 2019-08-09 Listed $159,900 Hive MLS
- 2019-08-09 Listed $159,900 Hive MLS
- 2006-06-02 Sold (Public Records) $154,000 Public Records
Property tax history
+3.0%/yrLatest (2025): $4,981 · +4.8% YoY. Source: county tax records.
Cash-flow waterfall
monthlySold comps — $/sqft
last 12 mo · ≤1 miLoading sold comps…