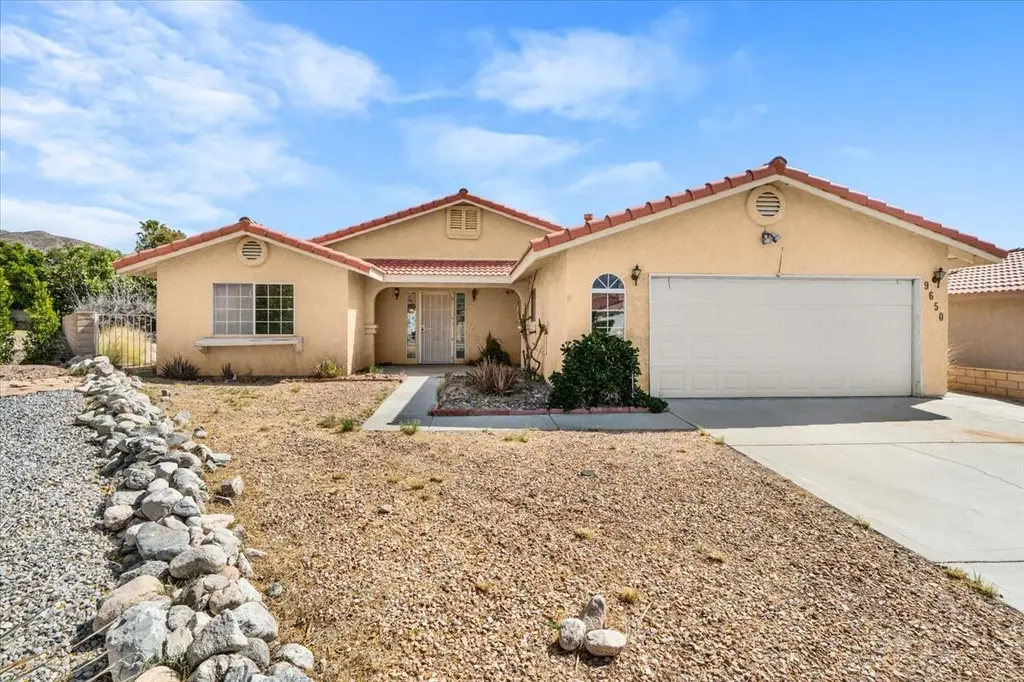
9650 Troon Ct · Desert Hot Springs, CA
Flood risk 1/10 · Minimal
- FEMA flood zone
- X (shaded)
- Chance of flooding over 30 yrs
- 0.0%
- Est. flood insurance / yr
- $507 – $1,088
Fire risk 6/10 · Moderate
- Est. fire insurance / yr
- $659 – $1,223
Heat risk 8/10 · Major
- Hot days now (above 110°F)
- 7 days/yr
- Hot days in 30 yrs
- 21 days/yr
Wind risk 1/10 · Minimal
- Chance of severe wind over 30 yrs
- —
Air-quality risk 5/10 · Moderate
- Unhealthy air days now
- 7 days/yr
- Unhealthy air days in 30 yrs
- 10 days/yr
Risk factors via First Street. Map © Google.
Why this score? — see what drove the C+ grade
The composite is a weighted blend of 9 inputs, each scored 0–100. Each bar is that input's sub-score; the figure is the points it added to the 100-point composite (weight × sub-score).
- Cash flow +20.8/30.0
- ARV discount +15.0/15.0
- 1% rule +6.9/10.0
- DSCR +6.6/10.0
- Rent growth +3.4/5.0
- Schools +2.7/10.0
- Livability +2.5/5.0
- Condition / age +2.5/5.0
- Appreciation +0.0/10.0
$250,000
🖨 Deal sheet 📄 Offer letter ✓ Due diligence
Listing remarks
Experience the potential of this distinctive 3BR, 2BA home situated within the sought-after Mission Lakes Country Club, Desert Hot Springs. Offering 1,726 sq ft of space, this HUD-owned property presents a canvas for those with a vision to create an exceptional desert retreat. At the heart of the home lies a welcoming living area, anchored by a fireplace that sets a foundational warmth in the cooler months. A layout that invites customization, the space allows for imaginative redesign to suit modern living while preserving intimacy. The kitchen, ready for transformation, opens towards the dining and living areas, promising a vibrant future filled with gatherings and shared moments. Outside,
Key facts
- Large patio cover
- Cul-de-sac
- Fireplace
Tags
Property features AI
Finance
- Other: Listed as Real Estate Owned; Acceptable financing: Conventional, FHA, Cash; Property sold as-is; CC&R apply
- HOA & community: Monthly association fee of $465; Association amenities include clubhouse, greenbelt/park, golf course, fitness center, card room; Part of an association
Exterior
- Parking: 2 total parking spaces; Attached 2-car garage; Covered parking with direct entrance
- Utilities: PUD: Yes; Sewer: Unknown
- Home design: Single family residence, detached; One story
- Construction: Year built per assessor
- Exterior features: Fee simple land; Development has a golf course; Other security/safety features
Interior
- Flooring: Carpet; Tile
- Bathrooms: 2 full bathrooms
- Heating & cooling: Central heating; Central air conditioning
- Interior features: Unfurnished; Decorative fireplace in the great room
Neighborhood map
What this means for you Summary
Snapshot
- This is a 3-bed/2.0-bath single-family listed at $250k.
Deal economics
- At list price, monthly cash flow is $342 ($4k/yr) — positive.
- The deal already cash-flows at list — no discount required.
- Meets the 1% rule at list price ($3k rent vs $250k).
- Cap rate 7.9% vs local median 4.0% in Desert Hot Springs — top-decile yield for the area; either an underpriced asset or a hidden risk that comps aren't pricing in. Stress-test before assuming the spread holds.
Location & tenants
- Location reads 49/100 on livability (#1,149 in CA) — a working-class tenant base; expect higher turnover. Strengths: housing B+; Watch: crime D+, schools F, amenities F.
- Palm Springs Unified (suburban): math 21% / reading 42% proficiency, ranked #328 of 517 in CA (top 63%) — families likely to look elsewhere, expect single-tenant / working-renter base with shorter leases; 73% free/reduced lunch — lower-income household profile, screen leases tightly.
- Market conditions: Rents rising (+3.7%/yr); 515 active listings in the ZIP; 12 comparable units currently listed for rent nearby; rentals at typical pace (median 15d on market — plan ~3-4 weeks tenant-placement turnaround); 9,195 units permitted in Riverside County in 2024 (1,512 in 5+ unit buildings).
- At $2,969/mo this rent would consume 66% of the median local household income ($54k/yr) (locally 2095% of renters already pay >50% of income on rent) — very limited rent-growth headroom before tenants either downsize or default.
Forward outlook
- Local home prices are declining (-3.0%/yr); year-one equity from $2k of loan paydown is wiped out by about $8k of value loss. Plan a longer hold.
- Riverside County population projected at +22% by 2050 — long-run rental-demand tailwind backs the buy-and-hold thesis.
Negotiation context
- Only 13 days on market — expect competitive offers; lowballing is unlikely to land.
- Current owner paid $126k; list at $250k implies a 99% gain — meaningful room to come down on a strong offer.
Risks & watch-outs
- Climate carrying-cost: major wildfire risk; extreme-heat days projected 7→21/yr by 2055 (HVAC capex compounding) — expect insurance premiums to compound above CPI over the hold.
Questions for the listing agent
- What does the HOA fee cover, when was the last increase, and are there any pending special assessments or reserve-fund shortfalls?
- Is there a deadline driving the sale (1031 exchange, divorce, estate, relocation)? That informs how much negotiation room exists.
- Schools are F-rated, which usually means shorter tenancies and higher turnover. Who's the typical renter profile here, and what's been the actual vacancy rate?
- Crime grade is D in this area — have there been break-ins, vandalism, or insurance claims at this property in the last 3 years? What carrier currently insures it and at what premium?
- What's the average days-on-market for RENTAL listings here right now (not sales)? A rising rental-DOM trend means longer vacancies and softer asking-rent achievability than the comps imply.
- What's the recent tenant-quality profile in this submarket — average credit score on applications, eviction rate, late-payment / NSF rate, and stable-employment percentage? A property-management company in the area should have these aggregated.
- How much new for-sale + rental construction is in the pipeline within 1–3 miles? Heavy new supply typically softens prices + rents 12–24 months out; constrained supply supports both.
Investment metrics
- 1% rule
- 1.19% ✓
- Cap rate
- 7.93%
- Cash-on-cash
- 5.86%
- DSCR
- 1.26
- GRM
- 7.0
CMA / ARV
- ARV (median comp)
- $392,644
- List price
- $250,000
- Delta
- -36.33%
- Verdict
- UNDERPRICED
- Comps
- 20 within 1.0 mi
Show comp detail 12 sales within ~0.75 mi
| Address | Dist | Beds/Ba | Sqft | Sold | Price | $/sf | Match |
|---|---|---|---|---|---|---|---|
| 9621 Siwanoy Dr | 0.07mi | 4/2.0 (+1) | 1,664 (-4%) | 1mo | $400,000 | $240 | 84 |
| 9740 Capiland Rd | 0.20mi | 3/2.0 | 1,772 (+3%) | 3mo | $400,000 | $226 | 84 |
| 8817 Clubhouse Blvd | 0.45mi | 3/2.0 | 1,749 (+1%) | 2mo | $395,000 | $226 | 75 |
| 9187 Oakmount Blvd | 0.39mi | 3/2.0 | 1,672 (-3%) | 2mo | $409,000 | $245 | 75 |
| 64754 Pinehurst Cir | 0.31mi | 3/2.0 | 1,831 (+6%) | 2mo | $465,000 | $254 | 74 |
| 8965 Mountain Pass Dr | 0.57mi | 3/2.0 | 1,749 (+1%) | 2mo | $379,000 | $217 | 70 |
| 64771 Augusta Ave | 0.54mi | 3/2.5 | 1,749 (+1%) | 3mo | $425,000 | $243 | 68 |
| 9086 Silver Star Ave | 0.51mi | 3/2.0 | 1,835 (+6%) | 3mo | $410,000 | $223 | 63 |
| 64178 Yosemite Ln | 0.57mi | 3/2.0 | 1,835 (+6%) | 2mo | $360,000 | $196 | 61 |
| 64543 Pinehurst Cir | 0.34mi | 2/2.0 (-1) | 1,536 (-11%) | 1mo | $329,000 | $214 | 60 |
| 8753 Rockies Ave | 0.70mi | 3/2.0 | 1,630 (-6%) | 3mo | $392,000 | $240 | 56 |
| 9980 Hoylake Rd | 0.44mi | 2/2.0 (-1) | 1,540 (-11%) | 3mo | $310,000 | $201 | 54 |
Match score weights: distance 35% · size 25% · config 20% · recency 20%. Top-matched comps best support the ARV.
Projected returns pro-forma
-3.0% appreciation · 3.66% rent growth · sell at horizon
- IRR
- -6.3%
- Equity multiple
- 0.76×
- Total profit
- $-16,556
- Equity at exit
- $37,276
- IRR
- 4.3%
- Equity multiple
- 1.32×
- Total profit
- $22,723
- Equity at exit
- $21,615
Cash invested: $70,000 (down + closing). Projections, not guarantees.
Landlord ↔ Tenant lean methodology
- Overall (STATE)
- 18 Strongly Tenant-Friendly
- State California
- 18 Strongly Tenant-Friendly · D+13
- County
- — inherits STATE
- City
- — inherits STATE
ZIP-level market 92240
- Home prices YoY
- -19.6%
- Rents YoY
- 3.7%
- Active inventory
- 515
- Price-to-rent
- 7.0×
Monthly cashflow live
- Estimated rent
- $2,969 high interval (Pro) →
- Mortgage (P&I)
- −$1,311
- Tax from tax record
- −$124 /mo · $1,488/yr
- Insurance
- −$104
- HOA
- −$465
- Vacancy / Maint / Mgmt
- −$624
- Net cashflow
- $342
Break-even live
UW: 25.0% down · 7.5% · 30yr · 1.5% tax · 5.0% vac · 8.0% maint · 8.0% mgmt
Financing live
Cash to close
- Down payment
- $62,500
- Closing costs
- $7,500
- Reserves months
- —
- Total cash needed
- —
Loan-product check · same deal, 3 products live
Conventional
25% down · 7.5% · 30yr
- Down + closing
- —
- Monthly P&I
- —
- Monthly cashflow
- —
- DSCR
- —
- Eligible?
- —
Personal DTI + credit; lowest rate.
DSCR
20% down · 8.5% · 30yr
- Down + closing
- —
- Monthly P&I
- —
- Monthly cashflow
- —
- DSCR
- —
- Eligible?
- —
No personal income docs; deal must DSCR.
Hard money
10% down · 12.0% · 12mo
- Down + closing
- —
- Monthly P&I
- —
- Monthly cashflow
- —
- DSCR
- —
- Eligible?
- —
Short-term bridge; refi at stabilization.
Rent comps 12 comps
| Address | Beds | Baths | Sqft | Rent | $/sqft | DOM | Units | Dist |
|---|---|---|---|---|---|---|---|---|
| 9591 Capiland Rd Desert Hot Springs, CA | 3.0 | 2.0 | 1707 | $2,450 | $1.44 | 24d | 1 | 0.19mi |
| 8780 Warwick Dr Desert Hot Springs, CA | 3.0 | 3.0 | 1896 | $3,195 | $1.69 | 2d | 1 | 0.22mi |
| 64356 Doral Dr Desert Hot Springs, CA | 3.0 | 2.5 | 1976 | $3,500 | $1.77 | 19d | 1 | 0.34mi |
| 8960 Kirkwood Ct Desert Hot Springs, CA | 3.0 | 3.0 | 2176 | $4,700 | $2.16 | 43d | 1 | 0.35mi |
| 64243 Eagle Mountain Ave Desert Hot Springs, CA | 3.0 | 2.0 | 2221 | $2,500 | $1.13 | 10d | 1 | 0.57mi |
| 64355 Silver Star Ave Desert Hot Springs, CA | 3.0 | 3.0 | 2107 | $4,000 | $1.90 | 2d | 1 | 0.60mi |
| 65161 Rolling Hills Dr Desert Hot Springs, CA | 4.0 | 2.0 | 1922 | $3,400 | $1.77 | 5d | 1 | 0.62mi |
| 64224 Silver Star Ave Desert Hot Springs, CA | 2.0 | 2.0 | 1206 | $2,750 | $2.28 | 1d | 1 | 0.65mi |
| 65439 Via del Sol Desert Hot Springs, CA | 3.0 | 2.0 | 1811 | $2,500 | $1.38 | 15d | 1 | 0.76mi |
| 8419 Meadows Way Desert Hot Springs, CA | 3.0 | 2.0 | 2172 | $2,600 | $1.20 | 43d | 1 | 0.76mi |
| 65548 Avenida Barona Desert Hot Springs, CA | 3.0 | 2.0 | 1200 | $2,799 | $2.33 | 10d | 1 | 0.97mi |
| 11693 Mountain Hawk Ln Desert Hot Springs, CA | 4.0 | 3.0 | 1666 | $2,500 | $1.50 | 43d | 1 | 1.29mi |
HOA detail
- Monthly dues
- $465 · $5,580/yr
Listing history 5 events
-
2026-05-08status Pending 1317-char remark
-
2026-04-25$250,000 Active 1317-char remark
-
1992-04-30soldstatus $125,500
-
1989-05-31soldstatus $115,000
-
1988-06-27soldstatus $11,000
ⓘ Source: listings_history table (triggers on properties + properties_extension) + one-shot
backfill from property_details.listing_events for pre-trigger history.
Tax reassessment forecast CA · Resets to sale price
- Current annual tax
- $1,488 · $124/mo
- Projected year-2 tax
- $1,900 · $158/mo
- Expected delta
- +$412/yr (+$34/mo · 27.7%)
ⓘ Screening estimate from a state-policy table — verify with the county assessor before closing.
Climate risk First Street
- Flood 1/10 Low FEMA zone X (shaded) · 0% chance over 30 yrs
- Wildfire 6/10 Major
- Heat 8/10 Severe 7 d/yr ≥110°F today · 21 d/yr by 30 yrs out
- Wind 1/10 Low
- Air quality 5/10 Major 7 unhealthy d/yr today · 10 by 30 yrs out
Nearby sold comps map
Loading sold comps map…
Walkable amenities ~0.75 mi
Loading nearby amenities…
Taxation est. · year 1
- Rental income
- $35,631
- − Mortgage interest
- −$14,004
- − Property taxes
- −$1,488
- − Insurance
- −$1,250
- − Repairs & maintenance
- −$2,851
- − Management
- −$2,851
- − HOA
- −$5,580
- − Depreciation
- −$7,273
- Taxable income
- $336
- Est. tax owed @ 24.0%
- −$81
- After-tax cash flow
- $4,018/yr
For passive investors: Depreciation is non-cash, so a rental often shows a tax loss while cash-flowing — sheltering income. Rental losses are passive: they offset passive income freely, and up to $25,000/yr can offset ordinary (W-2) income if you actively participate and your MAGI is under $100k (phasing out to $0 by $150k); unused losses carry forward. On sale, claimed depreciation is recaptured at up to 25%, and gains may owe capital-gains tax (a 1031 exchange can defer both). Figures are a year-1 estimate at your 24.0% rate — not tax advice; consult a CPA.
Schools (NCES district)
- District
- Palm Springs Unified
- NCES district ID
- 0629550
- Math proficiency
- 21% ▼ -7.00%
- Reading proficiency
- 42% ▬ 0.00%
- Median HH income
- $43,638
- Composite
- 26.76/100
- National rank
- #7131
- State rank
- #328 of 517 in CA
Livability — Desert Hot Springs
- Score
- 49/100
- State rank
- #1149
- US rank
- #25774
Category grades
Schools grade is shown separately in the Schools card above.
Census & demographics
- County
- Riverside County · 2,287,001 people
- City population
- 41,615
- Metro
- Riverside-San Bernardino-Ontario, CA
- Population (ZIP)
- 41,615
- Household income
- $54,023
- Rent vs Own
- Severe rent burden
- 2095.0
Population outlook (Riverside County) Hauer SSP2
- Today (2025)
- 2,664,475 people
- By 2030
- 2,802,692 · +5.2%
- By 2040
- 3,050,904 · +14.5%
- By 2050
- 3,256,783 · +22.2%
- By 2075
- 3,655,058 · +37.2%
- By 2100
- 3,766,594 · +41.4%
Race, ethnicity, and origin ACS 2023
- Neighborhood character
- Majority Hispanic (64%)
- Race & ethnicity
- Hispanic / Latino 64% Two or more races 27% White 23% Black 7% Native American 2% Asian 2%
- Hispanic origin (detail)
- Mexican 53%
- Common ancestry
- Lithuanian 1% Romanian 1% Italian 1%
- Foreign-born
- 27% · Canada, Vietnam
- Languages at home
- 47% English-only · Spanish 50% Russian/Polish/Slavic 1%
Political lean MEDSL · Riverside
- 2024 margin
- Toss-up / Even · D 48.0% · R 49.3% · Other 2.6%
- 2008→2024 swing
- -3.6pp toward R · 2008: 2.3pp · 2024: -1.3pp
- All cycles
- 2024: R+1.3 2020: D+8.0 2016: D+4.3 2012: R+0.4 2008: D+2.3
Not yet ingested
- Civics
- —
Market trends
- HPI YoY
- ▼ -102.10%
- Current HPI
- 418.4691
- Rent YoY
- ▲ 3.66%
- Metro
- Riverside-San Bernardino-Ontario, CA
- State GDP YoY
- ▲ 3.21%
- F500 in state
- 116
Industry mix (Fortune 500 HQ in CA)
| Industry | F500 HQs | Revenue |
|---|---|---|
| Technology | 27 | $1,492B |
|
||
| Financial Services | 3 | $174B |
|
||
| Retail | 3 | $44B |
|
||
| Insurance | 3 | $26B |
|
||
| Media / Entertainment | 2 | $115B |
|
||
| Pharmaceuticals / Biotech | 2 | $62B |
|
||
Price history
+2172.7% since first listed5 events — show timeline
- 2026-05-08 Pending — GPSMLS
- 2026-04-25 Listed $250,000 GPSMLS
- 1992-04-30 Sold (Public Records) $125,500 Public Records
- 1989-05-31 Sold (Public Records) $115,000 Public Records
- 1988-06-27 Sold (Public Records) $11,000 Public Records
Property tax history
+1.7%/yrLatest (2025): $1,488 · -30.7% YoY. Source: county tax records.
Cash-flow waterfall
monthlySold comps — $/sqft
last 12 mo · ≤1 miLoading sold comps…