51 Aspen Ln · Woodridge, NY
Flood risk 1/10 · Minimal
- FEMA flood zone
- X (unshaded)
- Chance of flooding over 30 yrs
- 0.0%
- Est. flood insurance / yr
- $473 – $860
Fire risk 3/10 · Minor
- Est. fire insurance / yr
- $691 – $1,283
Heat risk 2/10 · Minimal
- Hot days now (above 92°F)
- 7 days/yr
- Hot days in 30 yrs
- 15 days/yr
Wind risk 3/10 · Minor
- Chance of severe wind over 30 yrs
- 5.0%
Air-quality risk 2/10 · Minimal
- Unhealthy air days now
- 1 days/yr
- Unhealthy air days in 30 yrs
- 1 days/yr
Risk factors via First Street. Map © Google.
Why this score? — see what drove the F grade
The composite is a weighted blend of 9 inputs, each scored 0–100. Each bar is that input's sub-score; the figure is the points it added to the 100-point composite (weight × sub-score).
- Appreciation +10.0/10.0
- Cash flow +6.2/30.0
- Livability +3.1/5.0
- Rent growth +2.5/5.0
- Condition / age +2.5/5.0
- Schools +2.4/10.0
- 1% rule +1.0/10.0
- DSCR +0.5/10.0
- ARV discount +0.0/15.0
$410,000
🖨 Deal sheet 📄 Offer letter ✓ Due diligence
Listing remarks MLS
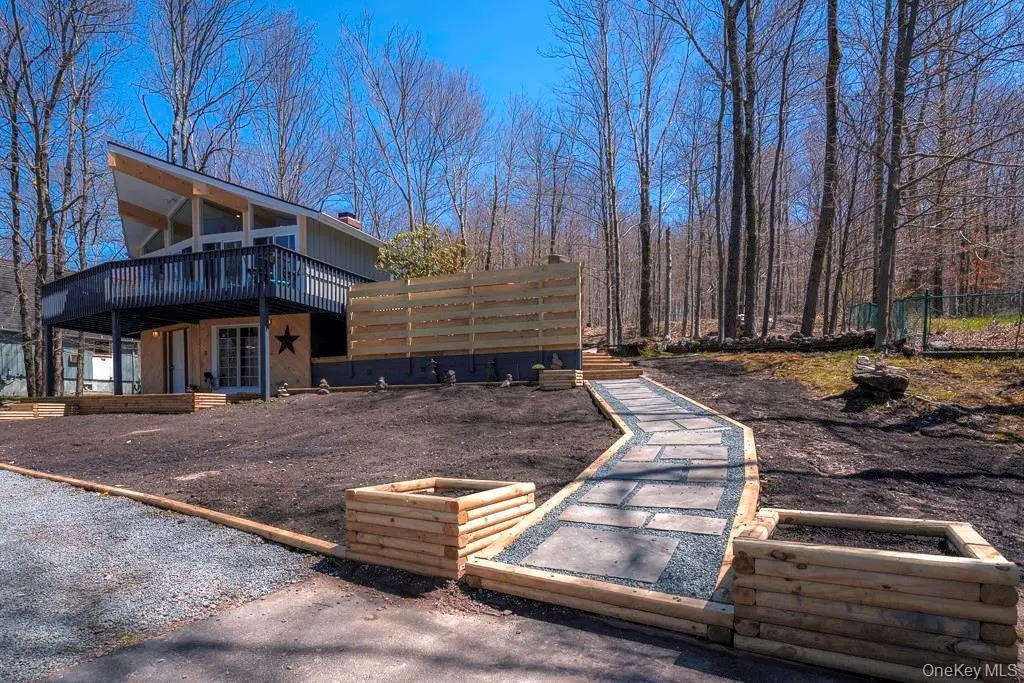
This three bedroom well maintained raised ranch is located on a dead end quiet street. It has hardwood floors, and new tile in kitchen. Large decking surrrounds the front and side of house partially allowing privacy while sitting on the deck. The finished room in the lower level is all pine. There are two possible additional rooms in the lower level. This home also has kerosene monitors on both floors. Please PRESENT ALL OFFERS. Electric: Circuit Breaker, Heating: Zoned, InteriorAmenities: Family Room, LandFeatures: Mature Trees,
Key facts
- Laundry room
- Bonus rooms
- Turn key airbnb
Tags
Property features AI
Exterior
- Parking: Driveway
- Utilities: Septic tank; Cable connected; Electricity connected
- Home design: Single family residence
- Construction: Wood siding construction
- Exterior features: Wood siding; Not waterfront
Interior
- Kitchen: Electric cooktop; Electric oven
- Bedrooms: Includes a first-floor bedroom
- Bathrooms: 2 full bathrooms; 1 half bathroom
- Heating & cooling: Baseboard heating; Electric heating; Central air conditioning
- Interior features: First-floor bedroom; First-floor full bathroom; Finished basement; Crawl attic
Neighborhood map
What this means for you Summary
Snapshot
- This is a 3-bed/3.0-bath single-family listed at $410k.
Deal economics
- At list price, monthly cash flow is $-745 ($-9k/yr) — negative.
- To cash-flow at today's rent, offer at most $278k (32.1% below list).
- To meet the 1% rule (rent ≥ 1% of price), the offer needs to be $247k (39.7% below list).
- Recommended offer: $247k (39.7% below list) — sets the bar for 1% rule.
Location & tenants
- Location reads 61/100 on livability (#934 in NY) — a middle-class / working-renter tenant base. Strengths: housing A+, employment B+, cost of living B+; Watch: crime F, amenities F, commute F.
- Fallsburg Central School District (town): math 29% / reading 27% proficiency, ranked #583 of 590 in NY (top 99%) — low school quality limits family demand, transient renter base, plan for 1-2y turnover.
- Zoned schools: Benjamin Cosor Elementary School (math 8% / reading 22%, grade F, #2,024 of 2,108 statewide, top 97%, 810 students, 72% FRL); Fallsburg Junior Senior High School (math 52% / reading 32%, grade F, #1,046 of 1,100 statewide, top 96%, 684 students, 64% FRL).
- Market conditions: 26 active listings in the ZIP; 2 comparable units currently listed for rent nearby; 739 units permitted in Sullivan County in 2024 (5 in 5+ unit buildings).
Forward outlook
- In year one you build about $44k of equity ($3k loan paydown + $41k appreciation (10.0% local appreciation)).
- Sullivan County population projected at -24% by 2050 — secular population decline; favor cash flow + early exit over multi-decade hold.
- By year 2, paydown + projected appreciation supports a ~$70k cash-out refi (75% LTV) — recoverable capital for the next deal without selling this one.
Negotiation context
- It's been on market 29 days — a 2% lower offer ($404k) is reasonable based on typical stale-listing flexibility.
- 2 sale attempts since 18y ago with the ask held roughly flat each time — persistent listings suggest the price (not the market) is what's stuck; bring a comps-based counter.
- Current owner paid $134k; list at $410k implies a 206% gain — meaningful room to come down on a strong offer.
Questions for the listing agent
- What do current leases actually rent for vs. the listed asking? Can we see a recent rent roll and the last 12 months of T-12 income?
- Built in 1971 — when were the roof, HVAC, electrical panel, plumbing, and water heater last replaced?
- Is there a deadline driving the sale (1031 exchange, divorce, estate, relocation)? That informs how much negotiation room exists.
- Schools are F-rated, which usually means shorter tenancies and higher turnover. Who's the typical renter profile here, and what's been the actual vacancy rate?
- Crime grade is F in this area — have there been break-ins, vandalism, or insurance claims at this property in the last 3 years? What carrier currently insures it and at what premium?
- The area grade is low — what's the realistic commute time and amenity access for the typical tenant pool here? Any planned neighborhood developments (good or bad) we should know about?
- What's the average days-on-market for RENTAL listings here right now (not sales)? A rising rental-DOM trend means longer vacancies and softer asking-rent achievability than the comps imply.
- What's the recent tenant-quality profile in this submarket — average credit score on applications, eviction rate, late-payment / NSF rate, and stable-employment percentage? A property-management company in the area should have these aggregated.
- How much new for-sale + rental construction is in the pipeline within 1–3 miles? Heavy new supply typically softens prices + rents 12–24 months out; constrained supply supports both.
Investment metrics
- 1% rule
- 0.60% ✗
- Cap rate
- 4.11%
- Cash-on-cash
- -7.79%
- DSCR
- 0.65
- GRM
- 13.8
CMA / ARV
- ARV (on-the-fly)
- $302,784
- Comps found
- 5
Show comp detail 5 sales within ~0.75 mi
| Address | Dist | Beds/Ba | Sqft | Sold | Price | $/sf | Match |
|---|---|---|---|---|---|---|---|
| 12 Zematt Ct | 0.58mi | 3/2.5 | 1,680 (-8%) | 12mo | $380,000 | $226 | 48 |
| 52 Edelweiss Dr | 0.71mi | 2/3.5 (-1) | 1,704 (-7%) | 7mo | $210,000 | $123 | 43 |
| 31 Edelweiss Dr | 0.71mi | 4/3.0 (+1) | 2,020 (+11%) | 5mo | $295,000 | $146 | 40 |
| 4 Berne Ct | 0.72mi | 4/2.5 (+1) | 1,724 (-6%) | 20mo | $345,000 | $200 | 34 |
| 18 Lausanne Dr | 0.73mi | 3/2.5 | 2,016 (+10%) | 17mo | $335,000 | $166 | 32 |
Match score weights: distance 35% · size 25% · config 20% · recency 20%. Top-matched comps best support the ARV.
Projected returns pro-forma
10.0% appreciation · 3.0% rent growth · sell at horizon
- IRR
- 18.8%
- Equity multiple
- 2.53×
- Total profit
- $175,778
- Equity at exit
- $369,360
- IRR
- 17.4%
- Equity multiple
- 5.83×
- Total profit
- $554,879
- Equity at exit
- $796,540
Cash invested: $114,800 (down + closing). Projections, not guarantees.
Landlord ↔ Tenant lean methodology
- Overall (STATE)
- 15 Strongly Tenant-Friendly
- State New York
- 15 Strongly Tenant-Friendly · D+10
- County
- — inherits STATE
- City
- — inherits STATE
ZIP-level market 12789
- Home prices YoY
- 2.4%
- Active inventory
- 26
- Price-to-rent
- 13.8×
Monthly cashflow live
- Estimated rent
- $2,471 medium interval (Pro) →
- Mortgage (P&I)
- −$2,150
- Tax from tax record
- −$377 /mo · $4,520/yr
- Insurance
- −$171
- HOA
- −$0
- Vacancy / Maint / Mgmt
- −$519
- Net cashflow
- $-745
Break-even live
UW: 25.0% down · 7.5% · 30yr · 1.5% tax · 5.0% vac · 8.0% maint · 8.0% mgmt
Financing live
Cash to close
- Down payment
- $102,500
- Closing costs
- $12,300
- Reserves months
- —
- Total cash needed
- —
Loan-product check · same deal, 3 products live
Conventional
25% down · 7.5% · 30yr
- Down + closing
- —
- Monthly P&I
- —
- Monthly cashflow
- —
- DSCR
- —
- Eligible?
- —
Personal DTI + credit; lowest rate.
DSCR
20% down · 8.5% · 30yr
- Down + closing
- —
- Monthly P&I
- —
- Monthly cashflow
- —
- DSCR
- —
- Eligible?
- —
No personal income docs; deal must DSCR.
Hard money
10% down · 12.0% · 12mo
- Down + closing
- —
- Monthly P&I
- —
- Monthly cashflow
- —
- DSCR
- —
- Eligible?
- —
Short-term bridge; refi at stabilization.
Rent comps 2 comps
| Address | Beds | Baths | Sqft | Rent | $/sqft | DOM | Units | Dist |
|---|---|---|---|---|---|---|---|---|
| 29 Meadowlark Ln Unit 1 Woodridge, NY | 3.0 | 4.0 | 1400 | $2,000 | $1.43 | 14d | 1 | 0.70mi |
| 50 Meadowlark Ln Woodridge, NY | 4.0 | 3.0 | 2500 | $3,000 | $1.20 | 14d | 1 | 0.75mi |
Listing history 18 events
-
2026-06-18days on market $410,000 Active 29 DOM
-
2026-06-17days on market $410,000 Active 28 DOM
-
2026-06-16days on market $410,000 Active 27 DOM
-
2026-06-15days on market $410,000 Active 26 DOM
-
2026-06-14days on market $410,000 Active 24 DOM
-
2026-06-13days on market $410,000 Active 23 DOM
-
2026-06-10days on market $410,000 Active 21 DOM
-
2026-06-09days on market $410,000 Active 20 DOM
-
2026-06-08days on market $410,000 Active 19 DOM
-
2026-06-07days on market $410,000 Active 18 DOM
-
2026-06-03days on market $410,000 Active 14 DOM
-
2026-06-02days on market $410,000 Active 13 DOM
-
2026-06-01days on market $410,000 Active 12 DOM
-
2026-05-31days on market $410,000 Active 11 DOM
-
2026-05-31days on market $410,000 Active 10 DOM
-
2026-05-20$410,000 Active
-
2008-10-10soldstatus $133,900 535-char remark
Show marketing remark (535 chars)
This three bedroom well maintained raised ranch is located on a dead end quiet street. It has hardwood floors, and new tile in kitchen. Large decking surrrounds the front and side of house partially allowing privacy while sitting on the deck. The finished room in the lower level is all pine. There are two possible additional rooms in the lower level. This home also has kerosene monitors on both floors. Please PRESENT ALL OFFERS. Electric: Circuit Breaker, Heating: Zoned, InteriorAmenities: Family Room, LandFeatures: Mature Trees,
-
2008-02-08$149,900 535-char remark
Show marketing remark (535 chars)
This three bedroom well maintained raised ranch is located on a dead end quiet street. It has hardwood floors, and new tile in kitchen. Large decking surrrounds the front and side of house partially allowing privacy while sitting on the deck. The finished room in the lower level is all pine. There are two possible additional rooms in the lower level. This home also has kerosene monitors on both floors. Please PRESENT ALL OFFERS. Electric: Circuit Breaker, Heating: Zoned, InteriorAmenities: Family Room, LandFeatures: Mature Trees,
ⓘ Source: listings_history table (triggers on properties + properties_extension) + one-shot
backfill from property_details.listing_events for pre-trigger history.
Tax reassessment forecast NY · Partial reset (capped growth)
- Current annual tax
- $4,520 · $377/mo
- Projected year-2 tax
- $5,725 · $477/mo
- Expected delta
- +$1,204/yr (+$100/mo · 26.6%)
ⓘ Screening estimate from a state-policy table — verify with the county assessor before closing.
Climate risk First Street
- Flood 1/10 Low FEMA zone X (unshaded) · 0% chance over 30 yrs
- Wildfire 3/10 Moderate
- Heat 2/10 Low 7 d/yr ≥92°F today · 15 d/yr by 30 yrs out
- Wind 3/10 Moderate 5% chance of damaging wind over 30 yrs
- Air quality 2/10 Low 1 unhealthy d/yr today · 1 by 30 yrs out
Nearby sold comps map
Loading sold comps map…
Walkable amenities ~0.75 mi
Loading nearby amenities…
Taxation est. · year 1
- Rental income
- $29,655
- − Mortgage interest
- −$22,966
- − Property taxes
- −$4,520
- − Insurance
- −$2,050
- − Repairs & maintenance
- −$2,372
- − Management
- −$2,372
- − Depreciation
- −$11,927
- Taxable loss
- −$16,554
- Est. tax savings @ 24.0%
- +$3,973
- After-tax cash flow
- $-4,971/yr
For passive investors: Depreciation is non-cash, so a rental often shows a tax loss while cash-flowing — sheltering income. Rental losses are passive: they offset passive income freely, and up to $25,000/yr can offset ordinary (W-2) income if you actively participate and your MAGI is under $100k (phasing out to $0 by $150k); unused losses carry forward. On sale, claimed depreciation is recaptured at up to 25%, and gains may owe capital-gains tax (a 1031 exchange can defer both). Figures are a year-1 estimate at your 24.0% rate — not tax advice; consult a CPA.
Schools (NCES district)
- District
- Fallsburg Central School District
- NCES district ID
- 3610950
- Math proficiency
- 29% ▼ -3.00%
- Reading proficiency
- 27% ▬ 0.00%
- Median HH income
- $42,513
- Composite
- 23.84/100
- National rank
- #7805
- State rank
- #583 of 590 in NY
Livability — Woodridge
- Score
- 61/100
- State rank
- #934
- US rank
- #18167
Category grades
Schools grade is shown separately in the Schools card above.
Census & demographics
- City population
- 2,654
- Population (ZIP)
- 2,654
Population outlook (Sullivan County) Hauer SSP2
- Today (2025)
- 68,974 people
- By 2030
- 65,609 · -4.9%
- By 2040
- 58,878 · -14.6%
- By 2050
- 52,500 · -23.9%
- By 2075
- 39,941 · -42.1%
- By 2100
- 28,880 · -58.1%
Race, ethnicity, and origin ACS 2023
- Neighborhood character
- Diverse neighborhood (Simpson 0.63)
- Race & ethnicity
- White 53% Hispanic / Latino 28% Two or more races 25% Black 5% Asian 5%
- Hispanic origin (detail)
- Mexican 1% Puerto Rican 20%
- Common ancestry
- Lithuanian 6% Scotch-Irish 2% Romanian 2%
- Foreign-born
- 10% · Canada, China
- Languages at home
- 63% English-only · Spanish 22% Chinese 5% Other Indo-European 5%
Political lean MEDSL · Sullivan
- 2024 margin
- R (+16.7) · D 41.6% · R 58.4%
- 2008→2024 swing
- -26.2pp toward R · 2008: 9.5pp · 2024: -16.7pp
- All cycles
- 2024: R+16.7 2020: R+9.2 2016: R+13.7 2012: D+10.4 2008: D+9.5
Not yet ingested
- Civics
- —
Market trends
- HPI YoY
- ▲ 10.65%
- Current HPI
- 455.1244
- Rent YoY
- —
- Metro
- —
- State GDP YoY
- ▲ 2.60%
- F500 in state
- 92
Industry mix (Fortune 500 HQ in NY)
| Industry | F500 HQs | Revenue |
|---|---|---|
| Financial Services | 10 | $950B |
|
||
| Consumer Goods | 9 | $162B |
|
||
| Insurance | 4 | $225B |
|
||
| Telecommunications | 2 | $144B |
|
||
| Pharmaceuticals | 2 | $112B |
|
||
| Media / Entertainment | 2 | $69B |
|
||
Price history
+173.5% since first listed3 events — show timeline
- 2026-05-20 Listed $410,000 OneKey® MLS as Distributed by MLS Grid
- 2008-10-10 Sold (MLS) $133,900 HGMLS
- 2008-02-08 Listed $149,900 HGMLS
Property tax history
+0.6%/yrLatest (2025): $4,520 · +1.4% YoY. Source: county tax records.
Cash-flow waterfall
monthlySold comps — $/sqft
last 12 mo · ≤1 miLoading sold comps…