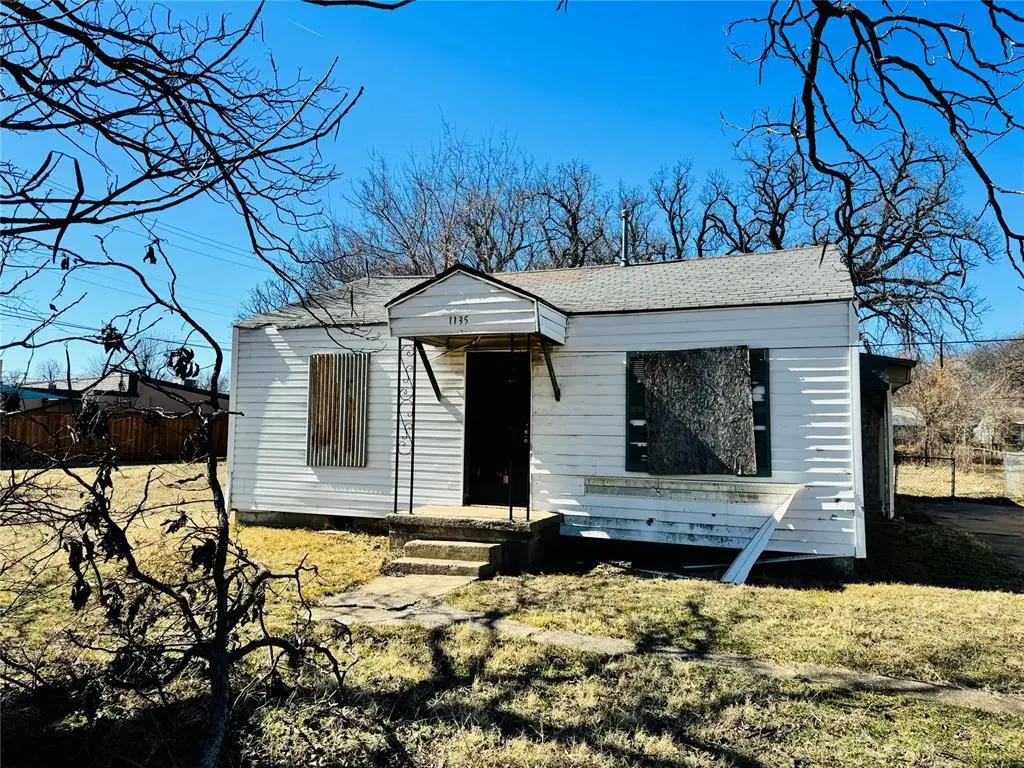
1135 NE Grand Blvd · Oklahoma City, OK
Flood risk 8/10 · Major
- FEMA flood zone
- X (shaded)
- Chance of flooding over 30 yrs
- 0.97%
- Est. flood insurance / yr
- $507 – $1,088
Fire risk 1/10 · Minimal
- Est. fire insurance / yr
- $2,463 – $4,575
Heat risk 6/10 · Moderate
- Hot days now (above 107°F)
- 7 days/yr
- Hot days in 30 yrs
- 19 days/yr
Wind risk 3/10 · Minor
- Chance of severe wind over 30 yrs
- 4.0%
Air-quality risk 2/10 · Minimal
- Unhealthy air days now
- 1 days/yr
- Unhealthy air days in 30 yrs
- 2 days/yr
Risk factors via First Street. Map © Google.
Why this score? — see what drove the A- grade
The composite is a weighted blend of 9 inputs, each scored 0–100. Each bar is that input's sub-score; the figure is the points it added to the 100-point composite (weight × sub-score).
- Cash flow +30.0/30.0
- ARV discount +15.0/15.0
- 1% rule +10.0/10.0
- DSCR +10.0/10.0
- Appreciation +6.2/10.0
- Livability +4.0/5.0
- Rent growth +2.5/5.0
- Condition / age +2.5/5.0
- Schools +0.7/10.0
$60,000
🖨 Deal sheet 📄 Offer letter ✓ Due diligence
Listing remarks MLS
Investors, Opportunity is knocking! This 2-bedroom, 1-bathroom home offers 1249 square feet of potential for the buyer who isn't afraid to roll up their sleeves. The layout offers solid bones, functional space, and a footprint that allows for smart updates and redesign. Whether you're an investor looking for your next flip, or a homeowner ready to create equity through renovation, this property is a blank canvas waiting for vision and execution. If you've been waiting for an affordable entry point with upside potential, this is it!
Key facts
- 7,174 sq ft lot
- Built 1945
- Listed 116 days
Neighborhood map
What this means for you Summary
Snapshot
- This is a 2-bed/1.0-bath single-family listed at $60k.
Deal economics
- At list price, monthly cash flow is $445 ($5k/yr) — positive.
- The deal already cash-flows at list — no discount required.
- Meets the 1% rule at list price ($1k rent vs $60k).
- Recommended offer: $55k (9.0% below list) — sets the bar for market timing.
- Cap rate 16.5% vs local median 3.7% in Oklahoma City — top-decile yield for the area; either an underpriced asset or a hidden risk that comps aren't pricing in. Stress-test before assuming the spread holds.
Location & tenants
- Location reads 80/100 on livability (#3 in OK, #1,635 nationally) — a professional / high-income tenant draw. Strengths: amenities A+, commute A+, cost of living A+; Watch: schools F, crime F.
- Oklahoma City (urban): math 7% / reading 10% proficiency, ranked #254 of 270 in OK (top 94%) — low school quality limits family demand, transient renter base, plan for 1-2y turnover; 82% free/reduced lunch — lower-income household profile, screen leases tightly.
- Market conditions: 75 active listings in the ZIP; 40 comparable units currently listed for rent nearby; rentals at typical pace (median 24d on market — plan ~3-4 weeks tenant-placement turnaround); 45% of comp listings sitting > 30 days — soft ceiling on asking rent; lower-income renter base — watch delinquency; 5,365 units permitted in Oklahoma County in 2024 (569 in 5+ unit buildings).
- At $1,167/mo this rent would consume 60% of the median local household income ($23k/yr) (locally 681% of renters already pay >50% of income on rent) — very limited rent-growth headroom before tenants either downsize or default.
Forward outlook
- In year one you build about $2k of equity ($415 loan paydown + $1k appreciation (2.4% local appreciation)).
- Oklahoma County population projected at +41% by 2050 — long-run rental-demand tailwind backs the buy-and-hold thesis.
- At projected returns (2.4% appreciation + 3.0% rent growth), your $17k cash investment doubles in ~3 years — after that, you're playing with house money.
Negotiation context
- It's been on market 116 days — a 9% lower offer ($55k) is reasonable based on typical stale-listing flexibility.
Risks & watch-outs
- Watch-outs: flood insurance adds $66/mo; built in 1945 — expect roof / HVAC / electrical / plumbing capex.
- Climate carrying-cost: severe flood risk; extreme-heat days projected 7→19/yr by 2055 (HVAC capex compounding) — expect insurance premiums to compound above CPI over the hold.
Questions for the listing agent
- It's been on market 116 days. Have you received any prior offers? Is the seller open to a 9% concession, seller financing, or rate buy-down credit?
- Built in 1945 — when were the roof, HVAC, electrical panel, plumbing, and water heater last replaced?
- What's the actual annual flood-insurance premium (NFIP or private), and is the property in a SFHA with mandatory coverage?
- Why hasn't it sold? Are there any deal-killer items the seller is aware of (foundation, flood, title, zoning, code violations)?
- Is there a deadline driving the sale (1031 exchange, divorce, estate, relocation)? That informs how much negotiation room exists.
- Schools are F-rated, which usually means shorter tenancies and higher turnover. Who's the typical renter profile here, and what's been the actual vacancy rate?
- Crime grade is F in this area — have there been break-ins, vandalism, or insurance claims at this property in the last 3 years? What carrier currently insures it and at what premium?
- What's the average days-on-market for RENTAL listings here right now (not sales)? A rising rental-DOM trend means longer vacancies and softer asking-rent achievability than the comps imply.
- What's the recent tenant-quality profile in this submarket — average credit score on applications, eviction rate, late-payment / NSF rate, and stable-employment percentage? A property-management company in the area should have these aggregated.
- How much new for-sale + rental construction is in the pipeline within 1–3 miles? Heavy new supply typically softens prices + rents 12–24 months out; constrained supply supports both.
Investment metrics
- 1% rule
- 1.95% ✓
- Cap rate
- 16.52%
- Cash-on-cash
- 36.52%
- DSCR
- 2.63
- GRM
- 4.3
CMA / ARV
- ARV (median comp)
- $105,419
- List price
- $60,000
- Delta
- -43.08%
- Verdict
- UNDERPRICED
- Comps
- 20 within 1.0 mi
Show comp detail 12 sales within ~0.75 mi
| Address | Dist | Beds/Ba | Sqft | Sold | Price | $/sf | Match |
|---|---|---|---|---|---|---|---|
| 2525 NE 13th St | 0.18mi | 3/1.0 (+1) | 1,240 (-1%) | 6mo | $120,000 | $97 | 81 |
| 2127 NE 19th St | 0.71mi | 2/1.5 | 1,271 (+2%) | 3mo | $67,500 | $53 | 60 |
| 1217 Carverdale Dr | 0.19mi | 3/2.0 (+1) | 1,323 (+6%) | 17mo | $139,500 | $105 | 58 |
| 2616 NE 17th St | 0.44mi | 3/1.0 (+1) | 1,152 (-8%) | 14mo | $75,000 | $65 | 50 |
| 3216 NE 13th St | 0.74mi | 3/1.0 (+1) | 1,184 (-5%) | 12mo | $145,000 | $122 | 42 |
| 2324 Hardin Dr | 0.69mi | 3/2.0 (+1) | 1,198 (-4%) | 14mo | $193,000 | $161 | 40 |
| 2037 NE 12th St | 0.48mi | 3/2.0 (+1) | 1,386 (+11%) | 14mo | $240,000 | $173 | 39 |
| 2133 NE 16th Ter | 0.51mi | 3/2.0 (+1) | 1,386 (+11%) | 14mo | $245,000 | $177 | 37 |
| 2909 NE 16th St | 0.52mi | 3/1.0 (+1) | 1,084 (-13%) | 15mo | $119,000 | $110 | 36 |
| 2109 NE 15th St | 0.52mi | 3/1.0 (+1) | 1,064 (-15%) | 12mo | $129,500 | $122 | 36 |
| 2729 NE 19th St | 0.62mi | 3/2.0 (+1) | 1,399 (+12%) | 13mo | $189,900 | $136 | 31 |
| 2903 NE Success St | 0.73mi | 3/2.0 (+1) | 1,116 (-11%) | 13mo | $222,000 | $199 | 28 |
Match score weights: distance 35% · size 25% · config 20% · recency 20%. Top-matched comps best support the ARV.
Projected returns pro-forma
2.42% appreciation · 3.0% rent growth · sell at horizon
- IRR
- 36.6%
- Equity multiple
- 3.01×
- Total profit
- $33,784
- Equity at exit
- $25,029
- IRR
- 37.3%
- Equity multiple
- 5.94×
- Total profit
- $82,981
- Equity at exit
- $37,119
Cash invested: $16,800 (down + closing). Projections, not guarantees.
Landlord ↔ Tenant lean methodology
- Overall (STATE)
- 83 Strongly Landlord-Friendly
- State Oklahoma
- 83 Strongly Landlord-Friendly · R+20
- County
- — inherits STATE
- City
- — inherits STATE
ZIP-level market 73117
- Home prices YoY
- 1.3%
- Active inventory
- 75
- Price-to-rent
- 4.3×
Monthly cashflow live
- Estimated rent
- $1,167 high interval (Pro) →
- Mortgage (P&I)
- −$315
- Tax from tax record
- −$71 /mo · $852/yr
- Insurance
- −$25
- Flood insurance flood zone
- −$66 /mo · $798/yr
- HOA
- −$0
- Vacancy / Maint / Mgmt
- −$245
- Net cashflow
- $445
Break-even live
UW: 25.0% down · 7.5% · 30yr · 1.5% tax · 5.0% vac · 8.0% maint · 8.0% mgmt
Financing live
Cash to close
- Down payment
- $15,000
- Closing costs
- $1,800
- Reserves months
- —
- Total cash needed
- —
Loan-product check · same deal, 3 products live
Conventional
25% down · 7.5% · 30yr
- Down + closing
- —
- Monthly P&I
- —
- Monthly cashflow
- —
- DSCR
- —
- Eligible?
- —
Personal DTI + credit; lowest rate.
DSCR
20% down · 8.5% · 30yr
- Down + closing
- —
- Monthly P&I
- —
- Monthly cashflow
- —
- DSCR
- —
- Eligible?
- —
No personal income docs; deal must DSCR.
Hard money
10% down · 12.0% · 12mo
- Down + closing
- —
- Monthly P&I
- —
- Monthly cashflow
- —
- DSCR
- —
- Eligible?
- —
Short-term bridge; refi at stabilization.
Rent comps 40 comps
| Address | Beds | Baths | Sqft | Rent | $/sqft | DOM | Units | Dist |
|---|---|---|---|---|---|---|---|---|
| 1217 Carverdale Dr Oklahoma City, OK | 2.0 | 2.0 | 1323 | $1,300 | $0.98 | 43d | 1 | 0.16mi |
| 2520 NE 14th St Oklahoma City, OK | 3.0 | 1.0 | 1070 | $1,099 | $1.03 | 43d | 1 | 0.19mi |
| 1321 Bellevidere Dr Oklahoma City, OK | 3.0 | 2.0 | 1000 | $1,200 | $1.20 | 23d | 1 | 0.20mi |
| 1501 NE Grand Blvd Oklahoma City, OK | 3.0 | 1.0 | 1204 | $1,200 | $1.00 | 4d | 1 | 0.22mi |
| 2501 NE 16th St Oklahoma City, OK | 2.0 | 1.0 | 941 | $1,100 | $1.17 | 43d | 1 | 0.35mi |
| 1709 N Page Ave Oklahoma City, OK | 2.0 | 1.0 | 967 | $895 | $0.93 | 23d | 1 | 0.37mi |
| 2105 NE 12th St Oklahoma City, OK | 3.0 | 2.0 | 1180 | $1,650 | $1.40 | 21d | 1 | 0.42mi |
| 2705 NE 18th St Oklahoma City, OK | 3.0 | 2.0 | 1399 | $1,000 | $0.71 | 21d | 1 | 0.52mi |
| 2620 NE 19th St Oklahoma City, OK | 2.0 | 1.0 | 900 | $995 | $1.11 | 43d | 1 | 0.54mi |
| 2616 NE Success St Oklahoma City, OK | 3.0 | 2.0 | 1312 | $1,350 | $1.03 | 23d | 1 | 0.59mi |
| 2036 NE Grand Blvd Oklahoma City, OK | 2.0 | 1.0 | 1092 | $995 | $0.91 | 2d | 1 | 0.64mi |
| 2132 NE 19th St Oklahoma City, OK | 2.0 | 1.0 | 850 | $950 | $1.12 | 43d | 1 | 0.64mi |
| 2143 NE 19th St Oklahoma City, OK | 2.0 | 1.0 | 1265 | $945 | $0.75 | 43d | 1 | 0.65mi |
| 2132 Miramar Blvd Oklahoma City, OK | 2.0 | 1.0 | 768 | $800 | $1.04 | 2d | 1 | 0.68mi |
| 1801 E Park Pl Oklahoma City, OK | 2.0 | 1.0 | 734 | $695 | $0.95 | 43d | 1 | 0.70mi |
| 2604 NE 21st St Oklahoma City, OK | 3.0 | 1.0 | 1260 | $995 | $0.79 | 23d | 1 | 0.71mi |
| 2200 Hardin Dr Oklahoma City, OK | 3.0 | 1.0 | 1091 | $1,025 | $0.94 | 43d | 1 | 0.71mi |
| 2308 NE 21st St Oklahoma City, OK | 3.0 | 1.0 | 1400 | $1,250 | $0.89 | 2d | 1 | 0.72mi |
| 2107 Hardin Dr Oklahoma City, OK | 3.0 | 1.0 | 999 | $875 | $0.88 | 43d | 1 | 0.78mi |
| 3212 NE 15th St Oklahoma City, OK | 3.0 | 1.0 | 825 | $965 | $1.17 | 10d | 1 | 0.80mi |
| 1633 NE 11th St Oklahoma City, OK | 3.0 | 2.0 | 1284 | $1,945 | $1.51 | 1d | 1 | 0.84mi |
| 1706 NE 8th St Oklahoma City, OK | 3.0 | 2.0 | 1389 | $1,345 | $0.97 | 2d | 1 | 0.85mi |
| 3333 NE 12th St Oklahoma City, OK | 2.0 | 1.0 | 720 | $1,000 | $1.39 | 43d | 1 | 0.86mi |
| 2313 NE 23rd St Oklahoma City, OK | 3.0 | 2.5 | 1500 | $1,095 | $0.73 | 43d | 1 | 0.87mi |
| 2300 Granada Blvd Oklahoma City, OK | 3.0 | 1.0 | 999 | $1,000 | $1.00 | 11d | 1 | 0.89mi |
| 2112 NE 23rd St Oklahoma City, OK | 3.0 | 1.0 | 1117 | $1,070 | $0.96 | 17d | 1 | 0.90mi |
| 3317 NE 15th St Oklahoma City, OK | 3.0 | 1.0 | 816 | $1,395 | $1.71 | 43d | 1 | 0.91mi |
| 1912 N Overbrook Dr Oklahoma City, OK | 3.0 | 1.0 | 1150 | $1,200 | $1.04 | 43d | 1 | 0.93mi |
| 1727 NE 19th St Oklahoma City, OK | 3.0 | 1.0 | 892 | $995 | $1.12 | 43d | 1 | 0.96mi |
| 1722 NE 20th St Oklahoma City, OK | 2.0 | 1.0 | 800 | $1,070 | $1.34 | 43d | 1 | 0.99mi |
| 1801 N Jordan Ave Oklahoma City, OK | 2.0 | 1.0 | 1080 | $1,000 | $0.93 | 14d | 1 | 0.99mi |
| 1609 NE 18th St Oklahoma City, OK | 2.0 | 1.0 | 899 | $900 | $1.00 | 4d | 1 | 1.01mi |
| 1444 NE 13th St Unit 1446 Oklahoma City, OK | 2.0 | 2.0 | 1167 | $1,199 | $1.03 | 17d | 1 | 1.05mi |
| 1445 NE 10th St Oklahoma City, OK | 2.0 | 1.0 | 1011 | $1,195 | $1.18 | 17d | 1 | 1.07mi |
| 1450 NE 16th Ter Oklahoma City, OK | 3.0 | 1.0 | 1096 | $1,295 | $1.18 | 43d | 1 | 1.10mi |
| 1428 NE 10th St Oklahoma City, OK | 3.0 | 2.0 | 1487 | $1,600 | $1.08 | 43d | 1 | 1.11mi |
| 1436 NE 8th St Oklahoma City, OK | 2.0 | 1.0 | 1048 | $1,095 | $1.04 | 43d | 1 | 1.13mi |
| 1931 NE 25th St Unit 10 Oklahoma City, OK | 2.0 | 1.0 | 900 | $875 | $0.97 | 23d | 1 | 1.19mi |
| 1904 NE 25th St Oklahoma City, OK | 2.0 | 1.0 | 939 | $950 | $1.01 | 4d | 1 | 1.20mi |
| 1921 NE 25th St Unit 3 Oklahoma City, OK | 2.0 | 1.0 | 900 | $875 | $0.97 | 19d | 1 | 1.21mi |
Listing history 14 events
-
2026-06-18days on market $60,000 Active 116 DOM
-
2026-06-17days on market $60,000 Active 115 DOM
-
2026-06-16days on market $60,000 Active 114 DOM
-
2026-06-15days on market $60,000 Active 113 DOM
-
2026-06-13days on market $60,000 Active 111 DOM
-
2026-06-09days on market $60,000 Active 107 DOM
-
2026-06-08days on market $60,000 Active 106 DOM
-
2026-06-07days on market $60,000 Active 105 DOM
-
2026-06-05days on market $60,000 Active 102 DOM
-
2026-06-03days on market $60,000 Active 101 DOM
-
2026-06-02days on market $60,000 Active 100 DOM
-
2026-06-01days on market $60,000 Active 99 DOM
-
2026-05-31days on market $60,000 Active 98 DOM
-
2026-02-22$60,000 Active 538-char remark
Show marketing remark (538 chars)
Investors, Opportunity is knocking! This 2-bedroom, 1-bathroom home offers 1249 square feet of potential for the buyer who isn't afraid to roll up their sleeves. The layout offers solid bones, functional space, and a footprint that allows for smart updates and redesign. Whether you're an investor looking for your next flip, or a homeowner ready to create equity through renovation, this property is a blank canvas waiting for vision and execution. If you've been waiting for an affordable entry point with upside potential, this is it!
ⓘ Source: listings_history table (triggers on properties + properties_extension) + one-shot
backfill from property_details.listing_events for pre-trigger history.
Tax reassessment forecast OK · Resets to sale price
- Current annual tax
- $852 · $71/mo
- Projected year-2 tax
- $852 · $71/mo
- Expected delta
- $0/yr ($0/mo · 0.0%)
ⓘ Screening estimate from a state-policy table — verify with the county assessor before closing.
Climate risk First Street
- Flood 8/10 Severe FEMA zone X (shaded) · 97% chance over 30 yrs
- Wildfire 1/10 Low
- Heat 6/10 Major 7 d/yr ≥107°F today · 19 d/yr by 30 yrs out
- Wind 3/10 Moderate 4% chance of damaging wind over 30 yrs
- Air quality 2/10 Low 1 unhealthy d/yr today · 2 by 30 yrs out
Nearby sold comps map
Loading sold comps map…
Walkable amenities ~0.75 mi
Loading nearby amenities…
Taxation est. · year 1
- Rental income
- $14,004
- − Mortgage interest
- −$3,361
- − Property taxes
- −$852
- − Insurance
- −$1,098
- − Repairs & maintenance
- −$1,120
- − Management
- −$1,120
- − Depreciation
- −$1,745
- Taxable income
- $4,708
- Est. tax owed @ 24.0%
- −$1,130
- After-tax cash flow
- $4,208/yr
For passive investors: Depreciation is non-cash, so a rental often shows a tax loss while cash-flowing — sheltering income. Rental losses are passive: they offset passive income freely, and up to $25,000/yr can offset ordinary (W-2) income if you actively participate and your MAGI is under $100k (phasing out to $0 by $150k); unused losses carry forward. On sale, claimed depreciation is recaptured at up to 25%, and gains may owe capital-gains tax (a 1031 exchange can defer both). Figures are a year-1 estimate at your 24.0% rate — not tax advice; consult a CPA.
Schools (NCES district)
- District
- Oklahoma City
- NCES district ID
- 4022770
- Math proficiency
- 7% ▼ -5.00%
- Reading proficiency
- 10% ▼ -6.00%
- Median HH income
- $35,606
- Composite
- 7.0/100
- National rank
- #9970
- State rank
- #254 of 270 in OK
Livability — Oklahoma City
- Score
- 80/100
- State rank
- #3
- US rank
- #1635
Category grades
Schools grade is shown separately in the Schools card above.
Census & demographics
- Census place
- Oklahoma City, OK
- County
- Oklahoma County · 771,644 people
- City population
- 498,656
- Metro
- Oklahoma City, OK
- Population (ZIP)
- 6,225
- Household income
- $23,413
- Rent vs Own
- Severe rent burden
- 681.0
Population outlook (Oklahoma County) Hauer SSP2
- Today (2025)
- 911,875 people
- By 2030
- 982,413 · +7.7%
- By 2040
- 1,130,468 · +24.0%
- By 2050
- 1,288,422 · +41.3%
- By 2075
- 1,711,482 · +87.7%
- By 2100
- 2,088,448 · +129.0%
Race, ethnicity, and origin ACS 2023
- Neighborhood character
- Diverse neighborhood (Simpson 0.56)
- Race & ethnicity
- Black 63% White 16% Two or more races 13% Hispanic / Latino 12% Asian 2%
- Hispanic origin (detail)
- Mexican 10%
- Foreign-born
- 10% · Canada, Guatemala, China
- Languages at home
- 87% English-only · Spanish 8% Other Indo-European 1% Other Asian/Pacific 1%
Political lean MEDSL · Oklahoma
- 2024 margin
- Toss-up / Even · D 48.0% · R 49.7% · Other 2.3%
- 2008→2024 swing
- +15.1pp toward D · 2008: -16.8pp · 2024: -1.7pp
- All cycles
- 2024: R+1.7 2020: R+1.1 2016: R+10.5 2012: R+16.7 2008: R+16.8
Not yet ingested
- Civics
- —
Market trends
- HPI YoY
- ▲ 2.42%
- Current HPI
- 192.3185
- Rent YoY
- —
- Metro
- Oklahoma City, OK
- State GDP YoY
- ▲ 1.55%
- F500 in state
- 6
Industry mix (Fortune 500 HQ in OK)
| Industry | F500 HQs | Revenue |
|---|---|---|
| Energy | 3 | $48B |
|
||
Price history
1 event — show timeline
- 2026-02-22 Listed $60,000 MLSOK
Property tax history
+12.4%/yrLatest (2025): $852 · +4.2% YoY. Source: county tax records.
Cash-flow waterfall
monthlySold comps — $/sqft
last 12 mo · ≤1 miLoading sold comps…