66 Gang Plank Trl · Milam, TX
Flood risk 1/10 · Minimal
- FEMA flood zone
- X
- Chance of flooding over 30 yrs
- 0.0%
- Est. flood insurance / yr
- $507 – $1,088
Fire risk 5/10 · Moderate
- Est. fire insurance / yr
- $1,269 – $2,357
Heat risk 8/10 · Major
- Hot days now (above 110°F)
- 7 days/yr
- Hot days in 30 yrs
- 22 days/yr
Wind risk 8/10 · Major
- Chance of severe wind over 30 yrs
- 92.0%
Air-quality risk 1/10 · Minimal
- Unhealthy air days now
- 0 days/yr
- Unhealthy air days in 30 yrs
- 0 days/yr
Risk factors via First Street. Map © Google.
Why this score? — see what drove the C grade
The composite is a weighted blend of 9 inputs, each scored 0–100. Each bar is that input's sub-score; the figure is the points it added to the 100-point composite (weight × sub-score).
- Cash flow +25.3/30.0
- DSCR +8.3/10.0
- ARV discount +8.2/15.0
- 1% rule +5.4/10.0
- Livability +3.0/5.0
- Schools +2.7/10.0
- Rent growth +2.5/5.0
- Condition / age +2.5/5.0
- Appreciation +0.0/10.0
$75,000
🖨 Deal sheet 📄 Offer letter ✓ Due diligence
Listing remarks
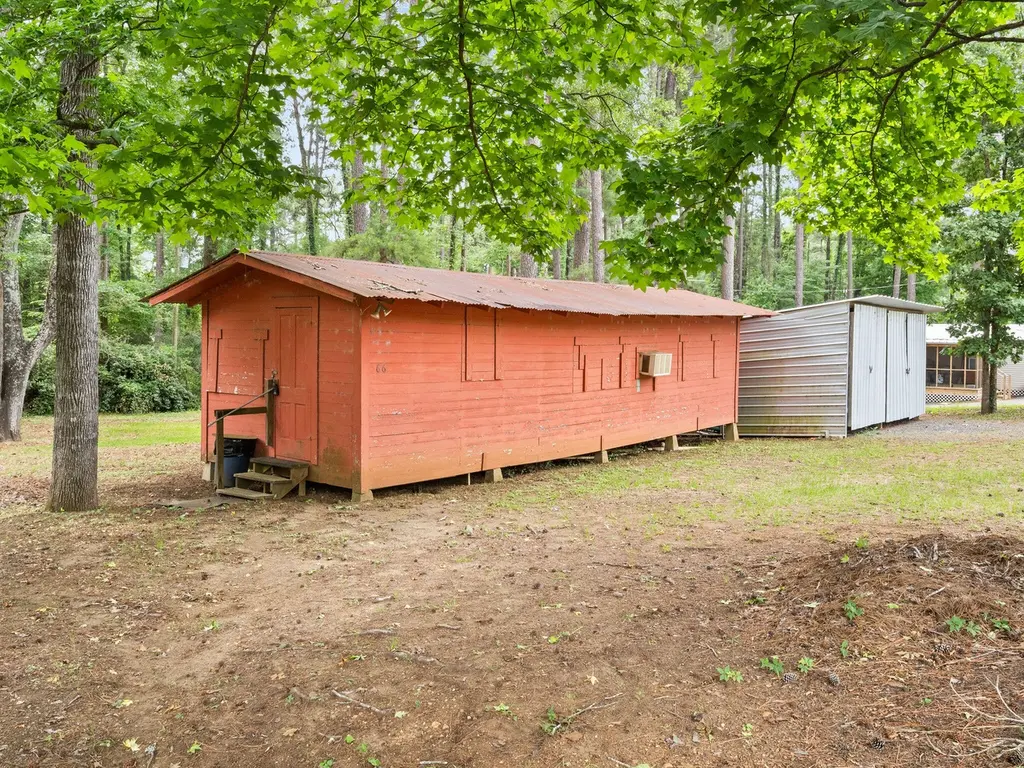
Escape to the lake life with this charming 1 bedroom, 1 bath camp situated on two lots near the highly sought-after Toledo Bend Reservoir! Located just approximately 200 yards from the popular Peg Leg Boat Launch and conveniently close to Big Bass Marina and Buckeye Landing, this property is perfectly positioned for fishing, boating, and weekend relaxation. The camp features a boat shed for added convenience and can come fully furnished, making it move-in or vacation-ready from day one. Whether you're looking for a personal getaway, fishing retreat, or investment opportunity, this property offers endless potential. Being sold as-is -- don't miss your chance to own an affordable slice of Tol
Key facts
- Big bass marina
- Buckeye landing
- Peg leg boat launch
Tags
Property features AI
Finance
- Other: Located at 66 Gang Plank Trl, Many, LA; Directions: From EREC take 171N to then take a left on 392, a right on 473, right on 191, left on Little Flock Rd, right on Old Hwy 476, left on Peg Leg, right on Gang Plank Trail; Listing broker: EXIT Real Estate Consultants; Listing agent: Courtney Thompson
Exterior
- Utilities: Public water; Public sewer
- Home design: Single-family residence; Residential property; One story
- Exterior features: Lot approximately 0.28 acres; Zoning: None
Interior
- Bedrooms: Bedrooms: see rooms total
- Bathrooms: 1 full bathroom
- Interior features: Total of 4 rooms
Neighborhood map
What this means for you Summary
Snapshot
- This is a 1-bed/1.0-bath single-family listed at $75k.
Deal economics
- At list price, monthly cash flow is $171 ($2k/yr) — positive.
- The deal already cash-flows at list — no discount required.
- Meets the 1% rule at list price ($778 rent vs $75k).
- Recommended offer: $74k (1.5% below list) — sets the bar for market timing.
- Cap rate 9.0% vs local median 1.9% in Milam — top-decile yield for the area; either an underpriced asset or a hidden risk that comps aren't pricing in. Stress-test before assuming the spread holds.
Location & tenants
- Location reads 59/100 on livability (#1,169 in TX) — a working-class tenant base; expect higher turnover. Strengths: cost of living A+, crime A, housing A-; Watch: schools F, amenities F, commute F.
- Sabine Parish (rural): math 27% / reading 39% proficiency, ranked #40 of 98 in LA (top 41%) — families likely to look elsewhere, expect single-tenant / working-renter base with shorter leases; 64% free/reduced lunch — lower-income household profile, screen leases tightly.
- Market conditions: 49 units permitted in Sabine Parish in 2024 (0 in 5+ unit buildings).
Forward outlook
- Local home prices are declining (-3.0%/yr); year-one equity from $519 of loan paydown is wiped out by about $2k of value loss. Plan a longer hold.
- Sabine County population projected to shrink 7% by 2050 — rents likely to lag national; underwrite the cash flow, not the appreciation.
Negotiation context
- It's been on market 28 days — a 2% lower offer ($74k) is reasonable based on typical stale-listing flexibility.
Risks & watch-outs
- Climate carrying-cost: severe wind risk, 92% chance of damaging wind over 30y; moderate wildfire risk; extreme-heat days projected 7→22/yr by 2055 (HVAC capex compounding) — expect insurance premiums to compound above CPI over the hold.
Questions for the listing agent
- Built in 1970 — when were the roof, HVAC, electrical panel, plumbing, and water heater last replaced?
- Is there a deadline driving the sale (1031 exchange, divorce, estate, relocation)? That informs how much negotiation room exists.
- Schools are F-rated, which usually means shorter tenancies and higher turnover. Who's the typical renter profile here, and what's been the actual vacancy rate?
- What's the average days-on-market for RENTAL listings here right now (not sales)? A rising rental-DOM trend means longer vacancies and softer asking-rent achievability than the comps imply.
- What's the recent tenant-quality profile in this submarket — average credit score on applications, eviction rate, late-payment / NSF rate, and stable-employment percentage? A property-management company in the area should have these aggregated.
- How much new for-sale + rental construction is in the pipeline within 1–3 miles? Heavy new supply typically softens prices + rents 12–24 months out; constrained supply supports both.
Investment metrics
- 1% rule
- 1.04% ✓
- Cap rate
- 9.03%
- Cash-on-cash
- 9.76%
- DSCR
- 1.43
- GRM
- 8.0
CMA / ARV
- ARV (on-the-fly)
- $76,128
- Comps found
- 1
Show comp detail 1 sale within ~0.75 mi
| Address | Dist | Beds/Ba | Sqft | Sold | Price | $/sf | Match |
|---|---|---|---|---|---|---|---|
| 91 Shad St | 0.31mi | 2/1.0 (+1) | 692 (+11%) | 23mo | $84,500 | $122 | 43 |
Match score weights: distance 35% · size 25% · config 20% · recency 20%. Top-matched comps best support the ARV.
Projected returns pro-forma
-3.0% appreciation · 3.0% rent growth · sell at horizon
- IRR
- -1.7%
- Equity multiple
- 0.94×
- Total profit
- $-1,311
- Equity at exit
- $11,183
- IRR
- 8.0%
- Equity multiple
- 1.61×
- Total profit
- $12,724
- Equity at exit
- $6,485
Cash invested: $21,000 (down + closing). Projections, not guarantees.
Monthly cashflow live
- Estimated rent
- $778 medium interval (Pro) →
- Mortgage (P&I)
- −$393
- Tax from tax record
- −$19 /mo · $227/yr
- Insurance
- −$31
- HOA
- −$0
- Vacancy / Maint / Mgmt
- −$163
- Net cashflow
- $171
Break-even live
UW: 25.0% down · 7.5% · 30yr · 1.5% tax · 5.0% vac · 8.0% maint · 8.0% mgmt
Financing live
Cash to close
- Down payment
- $18,750
- Closing costs
- $2,250
- Reserves months
- —
- Total cash needed
- —
Loan-product check · same deal, 3 products live
Conventional
25% down · 7.5% · 30yr
- Down + closing
- —
- Monthly P&I
- —
- Monthly cashflow
- —
- DSCR
- —
- Eligible?
- —
Personal DTI + credit; lowest rate.
DSCR
20% down · 8.5% · 30yr
- Down + closing
- —
- Monthly P&I
- —
- Monthly cashflow
- —
- DSCR
- —
- Eligible?
- —
No personal income docs; deal must DSCR.
Hard money
10% down · 12.0% · 12mo
- Down + closing
- —
- Monthly P&I
- —
- Monthly cashflow
- —
- DSCR
- —
- Eligible?
- —
Short-term bridge; refi at stabilization.
Listing history 18 events
-
2026-06-19days on market $75,000 Active 28 DOM
-
2026-06-18days on market $75,000 Active 27 DOM
-
2026-06-17days on market $75,000 Active 26 DOM
-
2026-06-16days on market $75,000 Active 25 DOM
-
2026-06-15days on market $75,000 Active 24 DOM
-
2026-06-14days on market $75,000 Active 22 DOM
-
2026-06-12days on market $75,000 Active 21 DOM
-
2026-06-09days on market $75,000 Active 18 DOM
-
2026-06-08days on market $75,000 Active 17 DOM
-
2026-06-07days on market $75,000 Active 16 DOM
-
2026-06-07days on market $75,000 Active 15 DOM
-
2026-06-04days on market $75,000 Active 12 DOM
-
2026-06-02days on market $75,000 Active 11 DOM
-
2026-06-01days on market $75,000 Active 10 DOM
-
2026-05-31days on market $75,000 Active 9 DOM
-
2026-05-31days on market $75,000 Active 8 DOM
-
2026-05-22$75,000 Active
-
2006-07-25soldstatus
ⓘ Source: listings_history table (triggers on properties + properties_extension) + one-shot
backfill from property_details.listing_events for pre-trigger history.
Tax reassessment forecast TX · Resets to sale price
- Current annual tax
- $227 · $19/mo
- Projected year-2 tax
- $1,372 · $114/mo
- Expected delta
- +$1,146/yr (+$95/mo · 504.9%)
ⓘ Screening estimate from a state-policy table — verify with the county assessor before closing.
Climate risk First Street
- Flood 1/10 Low FEMA zone X · 0% chance over 30 yrs
- Wildfire 5/10 Major
- Heat 8/10 Severe 7 d/yr ≥110°F today · 22 d/yr by 30 yrs out
- Wind 8/10 Severe 92% chance of damaging wind over 30 yrs
- Air quality 1/10 Low 0 unhealthy d/yr today · 0 by 30 yrs out
Nearby sold comps map
Loading sold comps map…
Walkable amenities ~0.75 mi
Loading nearby amenities…
Taxation est. · year 1
- Rental income
- $9,330
- − Mortgage interest
- −$4,201
- − Property taxes
- −$227
- − Insurance
- −$375
- − Repairs & maintenance
- −$746
- − Management
- −$746
- − Depreciation
- −$2,182
- Taxable income
- $852
- Est. tax owed @ 24.0%
- −$205
- After-tax cash flow
- $1,845/yr
For passive investors: Depreciation is non-cash, so a rental often shows a tax loss while cash-flowing — sheltering income. Rental losses are passive: they offset passive income freely, and up to $25,000/yr can offset ordinary (W-2) income if you actively participate and your MAGI is under $100k (phasing out to $0 by $150k); unused losses carry forward. On sale, claimed depreciation is recaptured at up to 25%, and gains may owe capital-gains tax (a 1031 exchange can defer both). Figures are a year-1 estimate at your 24.0% rate — not tax advice; consult a CPA.
Schools (NCES district)
- District
- Sabine Parish
- NCES district ID
- 2201380
- Math proficiency
- 27% ▼ -38.00%
- Reading proficiency
- 39% ▼ -35.00%
- Median HH income
- $37,017
- Composite
- 27.41/100
- National rank
- #6970
- State rank
- #40 of 98 in LA
Livability — Milam
- Score
- 59/100
- State rank
- #1169
- US rank
- #20453
Category grades
Schools grade is shown separately in the Schools card above.
Census & demographics
- Population (ZIP)
- 8,818
Population outlook (Sabine County) Hauer SSP2
- Today (2025)
- 23,820 people
- By 2030
- 23,505 · -1.3%
- By 2040
- 22,885 · -3.9%
- By 2050
- 22,235 · -6.7%
- By 2075
- 20,257 · -15.0%
- By 2100
- 17,348 · -27.2%
Race, ethnicity, and origin ACS 2023
- Neighborhood character
- Predominantly White (70%)
- Race & ethnicity
- White 70% Black 18% Two or more races 9% Hispanic / Latino 2% Native American 2%
- Common ancestry
- Lithuanian 6% Romanian 1% Italian 1%
- Foreign-born
- 1%
- Languages at home
- 97% English-only · French/Haitian/Cajun 2% Spanish 1%
Political lean MEDSL · Sabine
- 2024 margin
- Solid R (+70.1) · D 14.6% · R 84.7%
- 2008→2024 swing
- -18.5pp toward R · 2008: -51.6pp · 2024: -70.1pp
- All cycles
- 2024: R+70.1 2020: R+66.5 2016: R+63.1 2012: R+55.1 2008: R+51.6
Not yet ingested
- Civics
- —
Market trends
- HPI YoY
- ▼ -127.77%
- Current HPI
- 114.4327
- Rent YoY
- —
- Metro
- —
- State GDP YoY
- ▲ 3.95%
- F500 in state
- 110
Industry mix (Fortune 500 HQ in TX)
| Industry | F500 HQs | Revenue |
|---|---|---|
| Energy | 16 | $1,198B |
|
||
| Technology | 5 | $198B |
|
||
| Engineering / Construction | 4 | $72B |
|
||
| Energy Services | 3 | $60B |
|
||
| Utilities | 3 | $41B |
|
||
| Healthcare | 2 | $330B |
|
||
Price history
2 events — show timeline
- 2026-05-22 Listed $75,000 GFPAR
- 2006-07-25 Sold (Public Records) — Public Records
Property tax history
+2.5%/yrLatest (2025): $227 · +0.0% YoY. Source: county tax records.
Cash-flow waterfall
monthlySold comps — $/sqft
last 12 mo · ≤1 miLoading sold comps…