8318 & 0 Nyssa St · Houston, TX
Flood risk 4/10 · Minor
- FEMA flood zone
- X (unshaded)
- Chance of flooding over 30 yrs
- 0.22%
- Est. flood insurance / yr
- $507 – $1,088
Fire risk 4/10 · Minor
- Est. fire insurance / yr
- $1,222 – $2,270
Heat risk 9/10 · Severe
- Hot days now (above 110°F)
- 7 days/yr
- Hot days in 30 yrs
- 24 days/yr
Wind risk 9/10 · Severe
- Chance of severe wind over 30 yrs
- 99.0%
Air-quality risk 3/10 · Minor
- Unhealthy air days now
- 3 days/yr
- Unhealthy air days in 30 yrs
- 3 days/yr
Risk factors via First Street. Map © Google.
Why this score? — see what drove the D- grade
The composite is a weighted blend of 9 inputs, each scored 0–100. Each bar is that input's sub-score; the figure is the points it added to the 100-point composite (weight × sub-score).
- Cash flow +9.4/30.0
- ARV discount +7.6/15.0
- Appreciation +6.2/10.0
- Livability +3.7/5.0
- DSCR +2.7/10.0
- Schools +2.7/10.0
- 1% rule +2.5/10.0
- Rent growth +2.5/5.0
- Condition / age +2.5/5.0
$220,000
🖨 Deal sheet 📄 Offer letter ✓ Due diligence
Listing remarks MLS
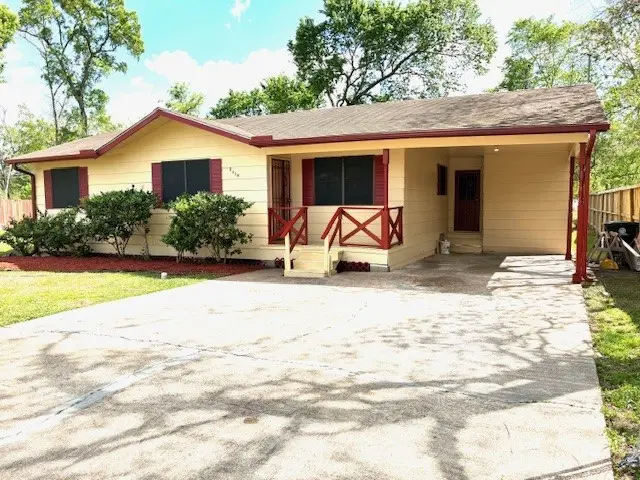
Welcome to this charming home situated on an oversized lot in a quiet, rapidly growing community. This well-maintained property features three bedrooms conveniently located on the main level, offering flexibility for a variety of living arrangements. The bathroom includes a tub/shower combination and an extended vanity for added functionality. Enjoy peace of mind with a newly installed central A/C system, along with fresh interior paint that gives the home a clean, modern feel. The expansive lot provides endless possibilities for outdoor living, future expansion, or investment potential. THE HOME AND LOT ARE BEING SOLD TOGETHER, making this a unique opportunity you don’t want to miss. Schedule your private showing today!
Key facts
- Future expansion
- Extended vanity
- Oversized lot
Tags
Neighborhood map
What this means for you Summary
Snapshot
- This is a 3-bed/1.0-bath single-family listed at $220k.
Deal economics
- At list price, monthly cash flow is $-155 ($-2k/yr) — negative.
- To cash-flow at today's rent, offer at most $193k (12.5% below list).
- To meet the 1% rule (rent ≥ 1% of price), the offer needs to be $165k (24.8% below list).
- Recommended offer: $165k (24.8% below list) — sets the bar for 1% rule.
- Cap rate 5.4% vs local median 3.2% in Houston — top-decile yield for the area; either an underpriced asset or a hidden risk that comps aren't pricing in. Stress-test before assuming the spread holds.
Location & tenants
- Location reads 74/100 on livability (#184 in TX, #4,771 nationally) — a middle-class / working-renter tenant base. Strengths: amenities A+, cost of living A+, housing A+; Watch: schools D, crime F.
- Houston ISD (urban): math 27% / reading 35% proficiency, ranked #593 of 826 in TX (top 72%) — families likely to look elsewhere, expect single-tenant / working-renter base with shorter leases; 71% free/reduced lunch — lower-income household profile, screen leases tightly.
- Market conditions: 129 active listings in the ZIP; 33 comparable units currently listed for rent nearby; rentals lingering (median 44d on market — plan ~5-8 weeks vacancy on turnover, expect pricing pressure); 52% of comp listings sitting > 30 days — soft ceiling on asking rent; lower-income renter base — watch delinquency; 29,883 units permitted in Harris County in 2024 (8,621 in 5+ unit buildings).
- At $1,655/mo this rent would consume 51% of the median local household income ($39k/yr) (locally 780% of renters already pay >50% of income on rent) — very limited rent-growth headroom before tenants either downsize or default.
Forward outlook
- In year one you build about $7k of equity ($2k loan paydown + $5k appreciation (2.5% local appreciation)).
- Harris County population projected at +47% by 2050 — long-run rental-demand tailwind backs the buy-and-hold thesis.
- By year 5, paydown + projected appreciation supports a ~$31k cash-out refi (75% LTV) — recoverable capital for the next deal without selling this one.
Negotiation context
- It's been on market 82 days — a 6% lower offer ($207k) is reasonable based on typical stale-listing flexibility.
- 2 sale attempts since 22y ago; this cycle's ask has dropped $30k (12%) from the opening price — seller is motivated, your offer sets the floor, not the list.
Risks & watch-outs
- Climate carrying-cost: severe wind risk, 99% chance of damaging wind over 30y; extreme-heat days projected 7→24/yr by 2055 (HVAC capex compounding) — expect insurance premiums to compound above CPI over the hold.
Questions for the listing agent
- What do current leases actually rent for vs. the listed asking? Can we see a recent rent roll and the last 12 months of T-12 income?
- It's been on market 82 days. Have you received any prior offers? Is the seller open to a 25% concession, seller financing, or rate buy-down credit?
- Why hasn't it sold? Are there any deal-killer items the seller is aware of (foundation, flood, title, zoning, code violations)?
- Is there a deadline driving the sale (1031 exchange, divorce, estate, relocation)? That informs how much negotiation room exists.
- Schools are D-rated, which usually means shorter tenancies and higher turnover. Who's the typical renter profile here, and what's been the actual vacancy rate?
- Crime grade is F in this area — have there been break-ins, vandalism, or insurance claims at this property in the last 3 years? What carrier currently insures it and at what premium?
- The area grade is low — what's the realistic commute time and amenity access for the typical tenant pool here? Any planned neighborhood developments (good or bad) we should know about?
- What's the average days-on-market for RENTAL listings here right now (not sales)? A rising rental-DOM trend means longer vacancies and softer asking-rent achievability than the comps imply.
- What's the recent tenant-quality profile in this submarket — average credit score on applications, eviction rate, late-payment / NSF rate, and stable-employment percentage? A property-management company in the area should have these aggregated.
- How much new for-sale + rental construction is in the pipeline within 1–3 miles? Heavy new supply typically softens prices + rents 12–24 months out; constrained supply supports both.
Investment metrics
- 1% rule
- 0.75% ✗
- Cap rate
- 5.45%
- Cash-on-cash
- -3.02%
- DSCR
- 0.87
- GRM
- 11.1
CMA / ARV
- ARV (median comp)
- $220,561
- List price
- $220,000
- Delta
- -0.25%
- Verdict
- FAIR
- Comps
- 20 within 1.0 mi
Show comp detail 12 sales within ~0.75 mi
| Address | Dist | Beds/Ba | Sqft | Sold | Price | $/sf | Match |
|---|---|---|---|---|---|---|---|
| 8328 Caddo Rd | 0.19mi | 2/1.0 (-1) | 934 (-8%) | 12mo | $85,000 | $91 | 64 |
| 8203 Burnt Orchid Dr | 0.53mi | 3/2.0 | 1,076 (+6%) | 1mo | $249,900 | $232 | 60 |
| 8112 Sunberry Shadow Dr | 0.41mi | 3/2.0 | 1,076 (+6%) | 12mo | $251,900 | $234 | 57 |
| 8710 Caddo Rd | 0.57mi | 3/1.0 | 976 (-4%) | 14mo | $97,900 | $100 | 56 |
| 8116 Sunberry Shadow Dr | 0.42mi | 3/2.0 | 1,076 (+6%) | 14mo | $258,900 | $241 | 55 |
| 10410 Sunny Petal Circle Dr | 0.47mi | 3/2.0 | 1,076 (+6%) | 14mo | $248,900 | $231 | 52 |
| 10404 Sunny Petal Circle Dr | 0.47mi | 3/2.0 | 1,076 (+6%) | 14mo | $253,900 | $236 | 52 |
| 8054 Parker Rd | 0.32mi | 3/2.0 | 1,140 (+13%) | 14mo | $180,000 | $158 | 48 |
| 8044 Parker Rd | 0.36mi | 3/2.0 | 1,140 (+13%) | 13mo | $175,000 | $154 | 47 |
| 8033 Alpine Bearberry Dr | 0.69mi | 3/2.0 | 1,076 (+6%) | 8mo | $250,900 | $233 | 47 |
| 8013 Alpine Bearberry Dr | 0.75mi | 3/2.0 | 1,076 (+6%) | 16mo | $248,900 | $231 | 38 |
| 8019 Alpine Bearberry Dr | 0.73mi | 3/2.0 | 1,076 (+6%) | 18mo | $245,900 | $229 | 36 |
Match score weights: distance 35% · size 25% · config 20% · recency 20%. Top-matched comps best support the ARV.
Projected returns pro-forma
2.5% appreciation · 3.0% rent growth · sell at horizon
- IRR
- 3.1%
- Equity multiple
- 1.18×
- Total profit
- $10,807
- Equity at exit
- $92,751
- IRR
- 6.7%
- Equity multiple
- 1.97×
- Total profit
- $59,707
- Equity at exit
- $138,316
Cash invested: $61,600 (down + closing). Projections, not guarantees.
Landlord ↔ Tenant lean methodology
- Overall (STATE)
- 87 Strongly Landlord-Friendly
- State Texas
- 87 Strongly Landlord-Friendly · R+5
- County
- — inherits STATE
- City
- — inherits STATE
ZIP-level market 77078
- Home prices YoY
- 0.8%
- Active inventory
- 129
- Price-to-rent
- 11.1×
Monthly cashflow live
- Estimated rent
- $1,655 high interval (Pro) →
- Mortgage (P&I)
- −$1,154
- Tax from tax record
- −$217 /mo · $2,607/yr
- Insurance
- −$92
- HOA
- −$0
- Vacancy / Maint / Mgmt
- −$348
- Net cashflow
- $-155
Break-even live
UW: 25.0% down · 7.5% · 30yr · 1.5% tax · 5.0% vac · 8.0% maint · 8.0% mgmt
Financing live
Cash to close
- Down payment
- $55,000
- Closing costs
- $6,600
- Reserves months
- —
- Total cash needed
- —
Loan-product check · same deal, 3 products live
Conventional
25% down · 7.5% · 30yr
- Down + closing
- —
- Monthly P&I
- —
- Monthly cashflow
- —
- DSCR
- —
- Eligible?
- —
Personal DTI + credit; lowest rate.
DSCR
20% down · 8.5% · 30yr
- Down + closing
- —
- Monthly P&I
- —
- Monthly cashflow
- —
- DSCR
- —
- Eligible?
- —
No personal income docs; deal must DSCR.
Hard money
10% down · 12.0% · 12mo
- Down + closing
- —
- Monthly P&I
- —
- Monthly cashflow
- —
- DSCR
- —
- Eligible?
- —
Short-term bridge; refi at stabilization.
Rent comps 33 comps
| Address | Beds | Baths | Sqft | Rent | $/sqft | DOM | Units | Dist |
|---|---|---|---|---|---|---|---|---|
| 8302 Caddo Rd Houston, TX | 2.0 | 1.0 | 896 | $1,450 | $1.62 | 43d | 1 | 0.22mi |
| 8213 Bigwood St Unit A Houston, TX | 3.0 | 2.5 | 1150 | $1,595 | $1.39 | 43d | 1 | 0.29mi |
| 8126 Sterlingshire St Unit B Houston, TX | 3.0 | 2.0 | 1150 | $1,350 | $1.17 | 24d | 1 | 0.41mi |
| 8122 Sterlingshire St Unit A Houston, TX | 3.0 | 2.0 | 1160 | $1,525 | $1.31 | 15d | 1 | 0.42mi |
| 8122 Sterlingshire St Unit B Houston, TX | 3.0 | 2.0 | 1160 | $1,450 | $1.25 | 15d | 1 | 0.42mi |
| 8600 Sterlingshire St Houston, TX | 1.0–2.0 | 1.0 | 732 | $1,050 | $1.43 | 24d | 2 | 0.63mi |
| 8346 Tidwell Rd Unit B Houston, TX | 3.0 | 2.0 | 980 | $1,000 | $1.02 | 43d | 1 | 0.72mi |
| 8350 Tidwell Rd Unit A Houston, TX | 3.0 | 2.0 | 980 | $975 | $0.99 | 43d | 1 | 0.72mi |
| 10708 Lavender Cotton Ln Houston, TX | 3.0 | 2.0 | 1406 | $2,150 | $1.53 | 43d | 1 | 0.75mi |
| 8003 Alpine Bearberry Dr Houston, TX | 3.0–4.0 | 2.0–2.5 | 1696 | $2,000 | $1.18 | 7d | 1 | 0.76mi |
| 9700 Mesa Dr Houston, TX | 1.0–3.0 | 1.0–2.0 | 784 | $989 | $1.26 | 2d | 8 | 0.78mi |
| 10314 Woodwick St Unit 1283919P Houston, TX | 3.0 | 2.5 | 1496 | $3,782 | $2.53 | 7d | 1 | 0.88mi |
| 9550 N Wayside Dr Houston, TX | 1.0–3.0 | 1.0–2.0 | 896 | $1,399 | $1.56 | 1d | 5 | 0.92mi |
| 9222 Hillis St Houston, TX | 3.0 | 2.0 | 1498 | $1,850 | $1.23 | 43d | 1 | 0.96mi |
| 7726 Spinet St Houston, TX | 4.0 | 2.0 | 1456 | $2,375 | $1.63 | 7d | 1 | 0.99mi |
| 8711 Southwark St Unit A Houston, TX | 3.0 | 2.0 | 1150 | $1,750 | $1.52 | 43d | 1 | 1.07mi |
| 9110 Tidwell Rd Houston, TX | 2.0 | 2.0 | 987 | $1,185 | $1.20 | 43d | 1 | 1.13mi |
| 9110 Tidwell Rd Houston, TX | 2.0 | 2.0 | 987 | $1,200 | $1.22 | 24d | 1 | 1.13mi |
| 8006 Lynette St Houston, TX | 3.0 | 1.0 | 1400 | $1,475 | $1.05 | 24d | 1 | 1.18mi |
| 8623 Homewood Ln Unit B Houston, TX | 3.0 | 2.5 | 1150 | $1,850 | $1.61 | 18d | 1 | 1.27mi |
| 8623 Homewood Unit A Houston, TX | 3.0 | 2.5 | 1150 | $1,850 | $1.61 | 43d | 1 | 1.27mi |
| 8625 Homewood Ln Unit B Houston, TX | 3.0 | 3.0 | 1500 | $1,850 | $1.23 | 43d | 1 | 1.27mi |
| 8627 Homewood Ln Unit B Houston, TX | 3.0 | 2.5 | 1500 | $1,850 | $1.23 | 43d | 1 | 1.27mi |
| 8631 Homewood Ln Unit A Houston, TX | 3.0 | 2.5 | 1500 | $1,850 | $1.23 | 43d | 1 | 1.28mi |
| 8631 Homewood Ln Unit B Houston, TX | 3.0 | 3.0 | 1500 | $1,850 | $1.23 | 43d | 1 | 1.28mi |
| 10750 Nyla Spring St Houston, TX | 3.0 | 2.0 | 1500 | $1,975 | $1.32 | 18d | 1 | 1.32mi |
| 6822 Leedale St Houston, TX | 3.0 | 1.0 | 978 | $1,500 | $1.53 | 43d | 1 | 1.38mi |
| 7252 Parker Rd Houston, TX | 3.0 | 1.0 | 916 | $1,650 | $1.80 | 43d | 1 | 1.44mi |
| 8602 Wilkins Oaks Dr Houston, TX | 3.0 | 2.0 | 1307 | $1,775 | $1.36 | 43d | 1 | 1.44mi |
| 6823 Hanley Ln Houston, TX | 3.0 | 2.0 | 1303 | $1,610 | $1.24 | 5d | 1 | 1.45mi |
| 8213 Linda Vista Rd Houston, TX | 3.0 | 2.0 | 1298 | $1,625 | $1.25 | 24d | 1 | 1.45mi |
| 7914 Laura Koppe Rd Houston, TX | 3.0 | 2.0 | 1400 | $1,850 | $1.32 | 43d | 1 | 1.50mi |
| 7314 Saunders Rd Houston, TX | 4.0 | 2.0 | 1339 | $1,723 | $1.29 | 14d | 1 | 1.50mi |
Listing history 17 events
-
2026-06-18days on market $220,000 Active 82 DOM
-
2026-06-17days on market $220,000 Active 81 DOM
-
2026-06-16days on market $220,000 Active 80 DOM
-
2026-06-15days on market $220,000 Active 79 DOM
-
2026-06-13days on market $220,000 Active 77 DOM
-
2026-06-10days on market $220,000 Active 73 DOM
-
2026-06-08days on market $220,000 Active 72 DOM
-
2026-06-07days on market $220,000 Active 71 DOM
-
2026-06-04days on market $220,000 Active 68 DOM
-
2026-06-01days on market $220,000 Active 65 DOM
-
2026-05-31days on market $220,000 Active 64 DOM
-
2026-04-11price $225,000 736-char remark
Show marketing remark (736 chars)
Welcome to this charming home situated on an oversized lot in a quiet, rapidly growing community. This well-maintained property features three bedrooms conveniently located on the main level, offering flexibility for a variety of living arrangements. The bathroom includes a tub/shower combination and an extended vanity for added functionality. Enjoy peace of mind with a newly installed central A/C system, along with fresh interior paint that gives the home a clean, modern feel. The expansive lot provides endless possibilities for outdoor living, future expansion, or investment potential. THE HOME AND LOT ARE BEING SOLD TOGETHER, making this a unique opportunity you don’t want to miss. Schedule your private showing today!
-
2026-03-28$250,000 Active 736-char remark
Show marketing remark (736 chars)
Welcome to this charming home situated on an oversized lot in a quiet, rapidly growing community. This well-maintained property features three bedrooms conveniently located on the main level, offering flexibility for a variety of living arrangements. The bathroom includes a tub/shower combination and an extended vanity for added functionality. Enjoy peace of mind with a newly installed central A/C system, along with fresh interior paint that gives the home a clean, modern feel. The expansive lot provides endless possibilities for outdoor living, future expansion, or investment potential. THE HOME AND LOT ARE BEING SOLD TOGETHER, making this a unique opportunity you don’t want to miss. Schedule your private showing today!
-
2022-12-02historical
-
2004-06-02$850
-
2004-06-02historical
-
1995-09-06soldstatus
ⓘ Source: listings_history table (triggers on properties + properties_extension) + one-shot
backfill from property_details.listing_events for pre-trigger history.
Tax reassessment forecast TX · Resets to sale price
- Current annual tax
- $2,607 · $217/mo
- Projected year-2 tax
- $4,026 · $336/mo
- Expected delta
- +$1,419/yr (+$118/mo · 54.5%)
ⓘ Screening estimate from a state-policy table — verify with the county assessor before closing.
Climate risk First Street
- Flood 4/10 Moderate FEMA zone X (unshaded) · 22% chance over 30 yrs
- Wildfire 4/10 Moderate
- Heat 9/10 Extreme 7 d/yr ≥110°F today · 24 d/yr by 30 yrs out
- Wind 9/10 Extreme 99% chance of damaging wind over 30 yrs
- Air quality 3/10 Moderate 3 unhealthy d/yr today · 3 by 30 yrs out
Nearby sold comps map
Loading sold comps map…
Walkable amenities ~0.75 mi
Loading nearby amenities…
Taxation est. · year 1
- Rental income
- $19,859
- − Mortgage interest
- −$12,323
- − Property taxes
- −$2,607
- − Insurance
- −$1,100
- − Repairs & maintenance
- −$1,589
- − Management
- −$1,589
- − Depreciation
- −$6,400
- Taxable loss
- −$5,748
- Est. tax savings @ 24.0%
- +$1,380
- After-tax cash flow
- $-483/yr
For passive investors: Depreciation is non-cash, so a rental often shows a tax loss while cash-flowing — sheltering income. Rental losses are passive: they offset passive income freely, and up to $25,000/yr can offset ordinary (W-2) income if you actively participate and your MAGI is under $100k (phasing out to $0 by $150k); unused losses carry forward. On sale, claimed depreciation is recaptured at up to 25%, and gains may owe capital-gains tax (a 1031 exchange can defer both). Figures are a year-1 estimate at your 24.0% rate — not tax advice; consult a CPA.
Schools (NCES district)
- District
- Houston ISD
- NCES district ID
- 4823640
- Math proficiency
- 27% ▼ -18.00%
- Reading proficiency
- 35% ▼ -6.00%
- Median HH income
- $46,054
- Composite
- 26.63/100
- National rank
- #7173
- State rank
- #593 of 826 in TX
Livability — Houston
- Score
- 74/100
- State rank
- #184
- US rank
- #4771
Category grades
Schools grade is shown separately in the Schools card above.
Census & demographics
- Census place
- Houston, TX
- County
- Harris County · 4,702,590 people
- City population
- 3,226,434
- Metro
- Houston-The Woodlands-Sugar Land, TX
- Population (ZIP)
- 14,247
- Household income
- $39,093
- Rent vs Own
- Severe rent burden
- 780.0
Population outlook (Harris County) Hauer SSP2
- Today (2025)
- 5,571,493 people
- By 2030
- 6,089,821 · +9.3%
- By 2040
- 7,142,806 · +28.2%
- By 2050
- 8,185,864 · +46.9%
- By 2075
- 10,574,329 · +89.8%
- By 2100
- 12,109,958 · +117.4%
Race, ethnicity, and origin ACS 2023
- Race & ethnicity
- Black 49% Hispanic / Latino 46% Two or more races 15% White 5%
- Hispanic origin (detail)
- Mexican 36% Cuban 1%
- Common ancestry
- Italian 1% Hispanic 1%
- Foreign-born
- 24% · Canada
- Languages at home
- 59% English-only · Spanish 41%
Political lean MEDSL · Harris
- 2024 margin
- Lean D (+5.5) · D 52.0% · R 46.4% · Other 1.6%
- 2008→2024 swing
- +3.9pp toward D · 2008: 1.6pp · 2024: 5.5pp
- All cycles
- 2024: D+5.5 2020: D+13.3 2016: D+12.4 2012: D+0.1 2008: D+1.6
Not yet ingested
- Civics
- —
Market trends
- HPI YoY
- ▲ 2.50%
- Current HPI
- 307.0842
- Rent YoY
- —
- Metro
- Houston-The Woodlands-Sugar Land, TX
- State GDP YoY
- ▲ 3.95%
- F500 in state
- 110
Industry mix (Fortune 500 HQ in TX)
| Industry | F500 HQs | Revenue |
|---|---|---|
| Energy | 16 | $1,198B |
|
||
| Technology | 5 | $198B |
|
||
| Engineering / Construction | 4 | $72B |
|
||
| Energy Services | 3 | $60B |
|
||
| Utilities | 3 | $41B |
|
||
| Healthcare | 2 | $330B |
|
||
Price history
-10.0% since first listed6 events — show timeline
- 2026-04-11 Price Changed $225,000 HARMLS
- 2026-03-28 Listed $250,000 HARMLS
- 2022-12-02 Rental Removed — RENT.
- 2004-06-02 Listing Removed — HARMLS
- 2004-06-02 Listed $850 HARMLS
- 1995-09-06 Sold (Public Records) — Public Records
Property tax history
+6.6%/yrLatest (2025): $2,607 · -1.6% YoY. Source: county tax records.
Cash-flow waterfall
monthlySold comps — $/sqft
last 12 mo · ≤1 miLoading sold comps…