 🏷️ Likely Rental
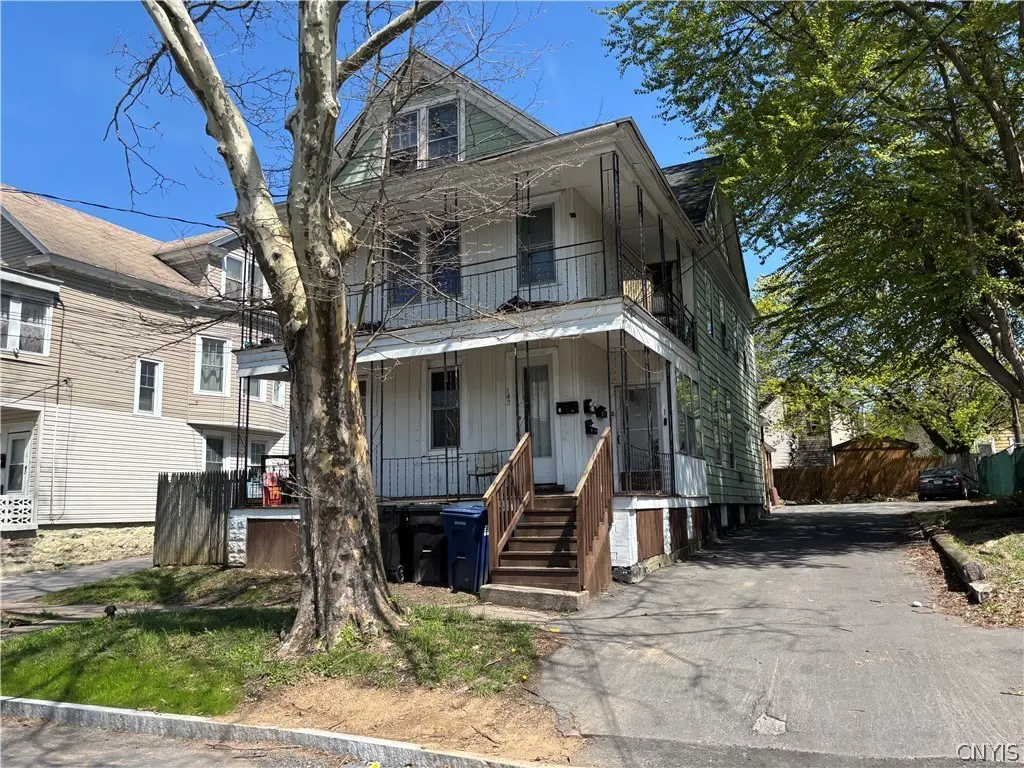
140 Grumbach Ave #42 · Syracuse, NY
Flood risk 3/10 · Minor
- FEMA flood zone
- X (unshaded)
- Chance of flooding over 30 yrs
- 0.2%
- Est. flood insurance / yr
- $473 – $860
Fire risk 1/10 · Minimal
- Est. fire insurance / yr
- $691 – $1,283
Heat risk 3/10 · Minor
- Hot days now (above 94°F)
- 7 days/yr
- Hot days in 30 yrs
- 16 days/yr
Wind risk 1/10 · Minimal
- Chance of severe wind over 30 yrs
- 0.0%
Air-quality risk 2/10 · Minimal
- Unhealthy air days now
- 0 days/yr
- Unhealthy air days in 30 yrs
- 1 days/yr
Risk factors via First Street. Map © Google.
Why this score? — see what drove the B+ grade
The composite is a weighted blend of 9 inputs, each scored 0–100. Each bar is that input's sub-score; the figure is the points it added to the 100-point composite (weight × sub-score).
- Cash flow +30.0/30.0
- ARV discount +15.0/15.0
- 1% rule +10.0/10.0
- DSCR +10.0/10.0
- Rent growth +4.6/5.0
- Livability +3.9/5.0
- Condition / age +2.5/5.0
- Schools +1.8/10.0
- Appreciation +0.0/10.0
$274,900
🖨 Deal sheet (PDF) 📄 Offer letter ✓ Due diligence
Multi-family units
County records classify this as Multi-Family (5+ Unit). Listing-text estimate: 4 units. estimate disagrees with records
5+ unit building — per-unit beds/baths from public records are typically unavailable; the breakdown below (if shown) is an estimate from the listing text.
Listing remarks
4-unit apartment building. Each tenant is responsible for their own utilities. Landlord pays water/sewer. Unit 1 - 3 bedroom rented for $1,400. Unit 2 - 2 bedroom is vacant. Unit 3 - 3 bedroom rented for $850. Unit 4 - 2 bedroom rented for $1,200 per month. All tenants start on 1-year lease and then move to month-to-month tenancy.
Key facts
- 5,495 sq ft lot
- Built 1900
- Listed 19 days
Neighborhood map
What this means for you Summary
Snapshot
- This is a 3×2bd/1.0ba + 1×3bd/1.0ba units multifamily listed at $275k.
Deal economics
- At list price, monthly cash flow is $4k ($45k/yr) — positive. Per door: $927/mo.
- The deal already cash-flows at list — no discount required.
- Meets the 1% rule at list price ($7k rent vs $275k).
- Recommended offer: $271k (1.5% below list) — sets the bar for market timing.
- Cap rate 22.5% vs local median 8.2% in Syracuse — top-decile yield for the area; either an underpriced asset or a hidden risk that comps aren't pricing in. Stress-test before assuming the spread holds.
Location & tenants
- Location reads 77/100 on livability (#187 in NY, #2,869 nationally) — a middle-class / working-renter tenant base. Strengths: amenities A+, commute A+, cost of living A+; Watch: crime F, employment D-.
- Syracuse City School District (urban): math 18% / reading 26% proficiency, ranked #590 of 590 in NY (top 100%) — low school quality limits family demand, transient renter base, plan for 1-2y turnover; 74% free/reduced lunch — lower-income household profile, screen leases tightly.
- Zoned schools: Franklin Elementary School (math 9% / reading 18%, grade F, #2,045 of 2,108 statewide, top 97%, 667 students, 93% FRL); Lincoln Middle School (math 8% / reading 14%, grade F, #721 of 729 statewide, top 99%, 508 students, 90% FRL); Henninger High School (math 65% / reading 50%, grade C, #885 of 1,100 statewide, top 81%, 1,499 students, 85% FRL) — zoned schools average 89% FRL vs 74% district-wide (15 pts higher); higher-poverty schools than district average — tighter screening recommended.
- Market conditions: Rents rising fast (+8.4%/yr); 55 active listings in the ZIP; 616 units permitted in Onondaga County in 2024 (256 in 5+ unit buildings).
- At $6,926/mo this rent would consume 177% of the median local household income ($47k/yr) (locally 1566% of renters already pay >50% of income on rent) — very limited rent-growth headroom before tenants either downsize or default.
Forward outlook
- Local home prices are declining (-3.0%/yr); year-one equity from $2k of loan paydown is wiped out by about $8k of value loss. Plan a longer hold.
- Onondaga County population projected to shrink 9% by 2050 — rents likely to lag national; underwrite the cash flow, not the appreciation.
- At projected returns (-3.0% appreciation + 8.0% rent growth), your $77k cash investment doubles in ~2 years — after that, you're playing with house money.
Negotiation context
- It's been on market 19 days — a 2% lower offer ($271k) is reasonable based on typical stale-listing flexibility.
- Current owner paid $125k; list at $275k implies a 120% gain — meaningful room to come down on a strong offer.
Risks & watch-outs
- Watch-outs: built in 1900 — expect roof / HVAC / electrical / plumbing capex.
Questions for the listing agent
- Can we see the unit-by-unit rent roll, current vacancy, and any below-market leases? What's the average tenancy length?
- What capital expenditures (roof, boiler, parking lot, exteriors) have been made in the last 5 years, and what's planned in the next 2?
- Built in 1900 — when were the roof, HVAC, electrical panel, plumbing, and water heater last replaced?
- Is there a deadline driving the sale (1031 exchange, divorce, estate, relocation)? That informs how much negotiation room exists.
- Schools are D-rated, which usually means shorter tenancies and higher turnover. Who's the typical renter profile here, and what's been the actual vacancy rate?
- Crime grade is F in this area — have there been break-ins, vandalism, or insurance claims at this property in the last 3 years? What carrier currently insures it and at what premium?
- What's the average days-on-market for RENTAL listings here right now (not sales)? A rising rental-DOM trend means longer vacancies and softer asking-rent achievability than the comps imply.
- What's the recent tenant-quality profile in this submarket — average credit score on applications, eviction rate, late-payment / NSF rate, and stable-employment percentage? A property-management company in the area should have these aggregated.
- How much new apartment / multifamily construction is in the pipeline within 1–3 miles? Heavy new supply (>2% of stock underway) typically softens rents 12–24 months out; light construction supports rent growth.
Investment metrics
- 1% rule
- 2.52% ✓
- Cap rate
- 22.49%
- Cash-on-cash
- 57.83%
- DSCR
- 3.57
- GRM
- 3.3
CMA / ARV
- ARV (median comp)
- $387,862
- List price
- $274,900
- Delta
- -29.12%
- Verdict
- UNDERPRICED
- Comps
- 20 within 1.0 mi
Show comp detail 2 sales within ~0.75 mi
| Address | Dist | Beds/Ba | Sqft | Sold | Price | $/sf | Match |
|---|---|---|---|---|---|---|---|
| 319 E Division St | 0.68mi | 8/4.0 | 5,559 (-4%) | 4mo | $250,000 | $45 | 58 |
| 711 Park St | 0.30mi | 9/3.0 (+1) | 5,982 (+4%) | 23mo | $250,000 | $42 | 52 |
Match score weights: distance 35% · size 25% · config 20% · recency 20%. Top-matched comps best support the ARV.
Projected returns pro-forma
-3.0% appreciation · 8.0% rent growth · sell at horizon
- IRR
- 61.8%
- Equity multiple
- 3.97×
- Total profit
- $228,351
- Equity at exit
- $40,988
- IRR
- 68.1%
- Equity multiple
- 9.70×
- Total profit
- $669,757
- Equity at exit
- $23,768
Cash invested: $76,972 (down + closing). Projections, not guarantees.
Landlord ↔ Tenant lean methodology
- Overall (STATE)
- 15 Strongly Tenant-Friendly
- State New York
- 15 Strongly Tenant-Friendly · D+10
- County
- — inherits STATE
- City
- — inherits STATE
ZIP-level market 13203
- Home prices YoY
- -11.9%
- Rents YoY
- 8.4%
- Active inventory
- 55
- Price-to-rent
- 13.4×
Monthly cashflow live
- Estimated rent
- $6,926 high interval (Pro) →
- Mortgage (P&I)
- −$1,442
- Tax from tax record
- −$206 /mo · $2,468/yr
- Insurance
- −$115
- HOA
- −$0
- Vacancy / Maint / Mgmt
- −$1,454
- Net cashflow
- $3,710
Break-even live
Sensitivity live
| Price | -10% $3,865 | -5% $3,788 | +0% $3,710 | +5% $3,632 | +10% $3,554 |
|---|---|---|---|---|---|
| Rent | -10% $3,163 | -5% $3,436 | +0% $3,710 | +5% $3,983 | +10% $4,257 |
| Rate | -1.0pp $3,848 | -0.5pp $3,780 | base $3,710 | +0.5pp $3,638 | +1.0pp $3,566 |
4-unit breakdown (identical units grouped — click to expand)
| Units | Beds | Baths | Est. rent |
|---|---|---|---|
| 3× units | 2 | 1 | $5,127 |
| #1 | 2 | 1 | $1,709 |
| #2 | 2 | 1 | $1,709 |
| #4 | 2 | 1 | $1,709 |
| 1× unit | 3 | 1 | $1,798 |
| Total (4 units) | $6,926 | ||
UW: 25.0% down · 7.5% · 30yr · 1.5% tax · 5.0% vac · 8.0% maint · 8.0% mgmt
Financing live
Cash to close
- Down payment
- $68,725
- Closing costs
- $8,247
- Reserves months
- —
- Total cash needed
- —
Loan-product check · same deal, 3 products live
Conventional
25% down · 7.5% · 30yr
- Down + closing
- —
- Monthly P&I
- —
- Monthly cashflow
- —
- DSCR
- —
- Eligible?
- —
Personal DTI + credit; lowest rate.
DSCR
20% down · 8.5% · 30yr
- Down + closing
- —
- Monthly P&I
- —
- Monthly cashflow
- —
- DSCR
- —
- Eligible?
- —
No personal income docs; deal must DSCR.
Hard money
10% down · 12.0% · 12mo
- Down + closing
- —
- Monthly P&I
- —
- Monthly cashflow
- —
- DSCR
- —
- Eligible?
- —
Short-term bridge; refi at stabilization.
Listing history 7 events
-
2026-06-02days on market $274,900 Active 19 DOM
-
2026-06-01days on market $274,900 Active 18 DOM
-
2026-05-31days on market $274,900 Active 17 DOM
-
2026-05-30days on market $274,900 Active 16 DOM
-
2026-05-14$274,900 Active 332-char remark
-
2007-12-26soldstatus $125,000
-
2007-06-20soldstatus $54,000
ⓘ Source: listings_history table (triggers on properties + properties_extension) + one-shot
backfill from property_details.listing_events for pre-trigger history.
Tax reassessment forecast NY · Partial reset (capped growth)
- Current annual tax
- $2,468 · $206/mo
- Projected year-2 tax
- $3,557 · $296/mo
- Expected delta
- +$1,089/yr (+$91/mo · 44.1%)
ⓘ Screening estimate from a state-policy table — verify with the county assessor before closing.
Climate risk First Street
- Flood 3/10 Moderate FEMA zone X (unshaded) · 20% chance over 30 yrs
- Wildfire 1/10 Low
- Heat 3/10 Moderate 7 d/yr ≥94°F today · 16 d/yr by 30 yrs out
- Wind 1/10 Low 0% chance of damaging wind over 30 yrs
- Air quality 2/10 Low 0 unhealthy d/yr today · 1 by 30 yrs out
Nearby sold comps map
Loading sold comps map…
Walkable amenities ~0.75 mi
Loading nearby amenities…
Taxation est. · year 1
- Rental income
- $83,112
- − Mortgage interest
- −$15,399
- − Property taxes
- −$2,468
- − Insurance
- −$1,374
- − Repairs & maintenance
- −$6,649
- − Management
- −$6,649
- − Depreciation
- −$7,997
- Taxable income
- $42,576
- Est. tax owed @ 24.0%
- −$10,218
- After-tax cash flow
- $34,299/yr
For passive investors: Depreciation is non-cash, so a rental often shows a tax loss while cash-flowing — sheltering income. Rental losses are passive: they offset passive income freely, and up to $25,000/yr can offset ordinary (W-2) income if you actively participate and your MAGI is under $100k (phasing out to $0 by $150k); unused losses carry forward. On sale, claimed depreciation is recaptured at up to 25%, and gains may owe capital-gains tax (a 1031 exchange can defer both). Figures are a year-1 estimate at your 24.0% rate — not tax advice; consult a CPA.
Schools (NCES district)
- District
- Syracuse City School District
- NCES district ID
- 3628590
- Math proficiency
- 18% ▼ -5.00%
- Reading proficiency
- 26% ▬ 0.00%
- Median HH income
- $32,097
- Composite
- 17.83/100
- National rank
- #9007
- State rank
- #590 of 590 in NY
Livability — Syracuse
- Score
- 77/100
- State rank
- #187
- US rank
- #2869
Category grades
Schools grade is shown separately in the Schools card above.
Census & demographics
- Census place
- Syracuse, NY
- County
- Onondaga County · 247,257 people
- City population
- 152,627
- Metro
- Syracuse, NY
- Population (ZIP)
- 16,180
- Household income
- $46,997
- Rent vs Own
- Severe rent burden
- 1566.0
Population outlook (Onondaga County) Hauer SSP2
- Today (2025)
- 467,894 people
- By 2030
- 463,381 · -1.0%
- By 2040
- 447,697 · -4.3%
- By 2050
- 426,399 · -8.9%
- By 2075
- 373,661 · -20.1%
- By 2100
- 307,967 · -34.2%
Race, ethnicity, and origin ACS 2023
- Neighborhood character
- Diverse neighborhood (Simpson 0.67)
- Race & ethnicity
- White 52% Black 22% Hispanic / Latino 11% Two or more races 9% Asian 7%
- Hispanic origin (detail)
- Puerto Rican 6% Cuban 2%
- Common ancestry
- Romanian 3% Lithuanian 2% Iranian 2%
- Foreign-born
- 13% · Canada, India, Philippines
- Languages at home
- 81% English-only · Spanish 6% Other Indo-European 3% Other Asian/Pacific 3%
Political lean MEDSL · Onondaga
- 2024 margin
- D (+17.3) · D 58.6% · R 41.4%
- 2008→2024 swing
- -3.0pp toward R · 2008: 20.3pp · 2024: 17.3pp
- All cycles
- 2024: D+17.3 2020: D+20.6 2016: D+12.8 2012: D+21.1 2008: D+20.3
Not yet ingested
- Civics
- —
Market trends
- HPI YoY
- ▼ -35.69%
- Current HPI
- 263.2588
- Rent YoY
- ▲ 8.39%
- Metro
- Syracuse, NY
- State GDP YoY
- ▲ 2.60%
- F500 in state
- 92
Industry mix (Fortune 500 HQ in NY)
| Industry | F500 HQs | Revenue |
|---|---|---|
| Financial Services | 10 | $950B |
|
||
| Consumer Goods | 9 | $162B |
|
||
| Insurance | 4 | $225B |
|
||
| Telecommunications | 2 | $144B |
|
||
| Pharmaceuticals | 2 | $112B |
|
||
| Media / Entertainment | 2 | $69B |
|
||
Price history
+131.5% since first listed2 events — show timeline
- 2007-12-26 Sold (Public Records) $125,000 Public Records
- 2007-06-20 Sold (Public Records) $54,000 Public Records
Property tax history
-0.0%/yrLatest (2025): $2,468 · +0.9% YoY. Source: county tax records.
Cash-flow waterfall
monthlySold comps — $/sqft
last 12 mo · ≤1 miLoading sold comps…