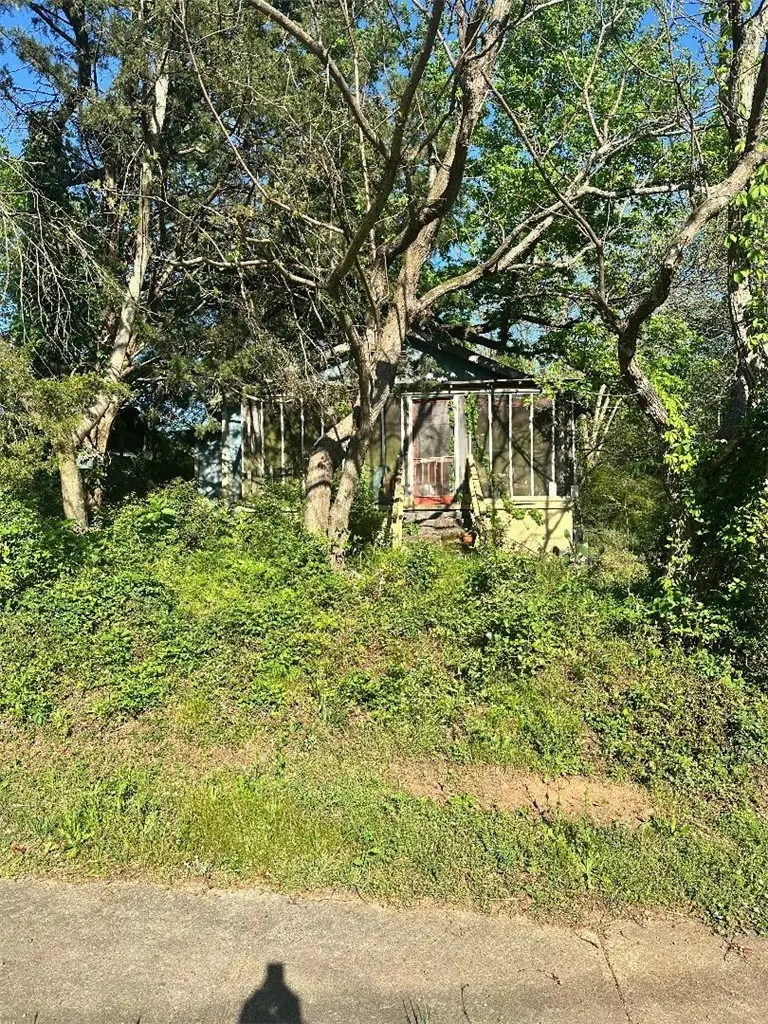
546 Boykin St · Auburn, AL
Flood risk 1/10 · Minimal
- FEMA flood zone
- X (unshaded)
- Chance of flooding over 30 yrs
- 0.0%
- Est. flood insurance / yr
- $507 – $1,088
Fire risk 3/10 · Minor
- Est. fire insurance / yr
- $916 – $1,700
Heat risk 6/10 · Moderate
- Hot days now (above 104°F)
- 7 days/yr
- Hot days in 30 yrs
- 20 days/yr
Wind risk 6/10 · Moderate
- Chance of severe wind over 30 yrs
- 76.0%
Air-quality risk 2/10 · Minimal
- Unhealthy air days now
- 1 days/yr
- Unhealthy air days in 30 yrs
- 1 days/yr
Risk factors via First Street. Map © Google.
Why this score? — see what drove the B+ grade
The composite is a weighted blend of 9 inputs, each scored 0–100. Each bar is that input's sub-score; the figure is the points it added to the 100-point composite (weight × sub-score).
- Cash flow +30.0/30.0
- ARV discount +15.0/15.0
- DSCR +10.0/10.0
- 1% rule +8.7/10.0
- Schools +5.0/10.0
- Rent growth +4.0/5.0
- Livability +4.0/5.0
- Condition / age +2.5/5.0
- Appreciation +0.0/10.0
$150,000
🖨 Deal sheet 📄 Offer letter ✓ Due diligence
Listing remarks
Attention investors! This promising investment property is just a short walk from the University and Drake Middle School. House is being Sold AS IS.
Key facts
- 0.43 acre lot
- Built 1942
- Listed 10 days
Tags
Property features AI
Finance
- Other: Directions: Head down North Donahue Dr, turn left onto Martin Luther King Jr Dr, then right onto Boykin St. The house will be on the right with a sign in the yard.
- HOA & community: No association amenities
Exterior
- Utilities: Cable available; Natural gas available; Public water available; Sewer connected
- Home design: Residential single-story home; One level
- Construction: Masonite exterior; 1,024 finished square feet; Built as a single-story structure
- Exterior features: No fencing; Lot in the Toomer subdivision
Interior
- Bathrooms: 1 full bathroom (main level)
- Heating & cooling: Natural gas and electric heating; No central cooling listed
- Interior features: Crawl space basement
Neighborhood map
What this means for you Summary
Snapshot
- This is a 3-bed/1.0-bath single-family listed at $150k.
Deal economics
- At list price, monthly cash flow is $715 ($9k/yr) — positive.
- The deal already cash-flows at list — no discount required.
- Meets the 1% rule at list price ($2k rent vs $150k).
- Cap rate 12.0% vs local median 2.7% in Auburn — top-decile yield for the area; either an underpriced asset or a hidden risk that comps aren't pricing in. Stress-test before assuming the spread holds.
Location & tenants
- Location reads 80/100 on livability (#6 in AL, #1,842 nationally) — a professional / high-income tenant draw. Strengths: crime A+, amenities A+, health & safety A+; Watch: commute F.
- Auburn City (urban): math 51% / reading 69% proficiency, ranked #7 of 129 in AL (top 5%) — acceptable for families but not a draw, mixed tenant base, ~2y average lease.
- Zoned schools: Wrights Mill Road Elementary School (math 65% / reading 75%, grade A-, #26 of 627 statewide, top 4%, 397 students, 33% FRL).
- Market conditions: Rents rising fast (+6.2%/yr); 359 active listings in the ZIP; 20 comparable units currently listed for rent nearby; rentals lingering (median 44d on market — plan ~5-8 weeks vacancy on turnover, expect pricing pressure); 55% of comp listings sitting > 30 days — soft ceiling on asking rent; lower-income renter base — watch delinquency; 1,858 units permitted in Lee County in 2024 (113 in 5+ unit buildings).
- At $2,059/mo this rent would consume 58% of the median local household income ($43k/yr) (locally 2503% of renters already pay >50% of income on rent) — very limited rent-growth headroom before tenants either downsize or default.
Forward outlook
- Local home prices are declining (-3.0%/yr); year-one equity from $1k of loan paydown is wiped out by about $4k of value loss. Plan a longer hold.
- Lee County population projected at +54% by 2050 — long-run rental-demand tailwind backs the buy-and-hold thesis.
- At projected returns (-3.0% appreciation + 6.2% rent growth), your $42k cash investment doubles in ~6 years — after that, you're playing with house money.
Negotiation context
- Only 10 days on market — expect competitive offers; lowballing is unlikely to land.
- 2 sale attempts since 3y ago with the ask held roughly flat each time — persistent listings suggest the price (not the market) is what's stuck; bring a comps-based counter.
Risks & watch-outs
- Watch-outs: built in 1942 — expect roof / HVAC / electrical / plumbing capex.
- Climate carrying-cost: major wind risk, 76% chance of damaging wind over 30y; extreme-heat days projected 7→20/yr by 2055 (HVAC capex compounding) — expect insurance premiums to compound above CPI over the hold.
Questions for the listing agent
- Built in 1942 — when were the roof, HVAC, electrical panel, plumbing, and water heater last replaced?
- Is there a deadline driving the sale (1031 exchange, divorce, estate, relocation)? That informs how much negotiation room exists.
- Schools are A-rated — typically a magnet for longer-tenancy family renters. What's the average tenant stay here, and is there a school-zone premium baked into asking?
- What's the average days-on-market for RENTAL listings here right now (not sales)? A rising rental-DOM trend means longer vacancies and softer asking-rent achievability than the comps imply.
- What's the recent tenant-quality profile in this submarket — average credit score on applications, eviction rate, late-payment / NSF rate, and stable-employment percentage? A property-management company in the area should have these aggregated.
- How much new for-sale + rental construction is in the pipeline within 1–3 miles? Heavy new supply typically softens prices + rents 12–24 months out; constrained supply supports both.
Investment metrics
- 1% rule
- 1.37% ✓
- Cap rate
- 12.01%
- Cash-on-cash
- 20.42%
- DSCR
- 1.91
- GRM
- 6.1
CMA / ARV
- ARV (on-the-fly)
- $209,920
- Comps found
- 12
Show comp detail 12 sales within ~0.75 mi
| Address | Dist | Beds/Ba | Sqft | Sold | Price | $/sf | Match |
|---|---|---|---|---|---|---|---|
| 538 Carlisle Dr | 0.07mi | 3/2.0 | 1,080 (+6%) | 3mo | $216,000 | $200 | 81 |
| 364 Frazier St | 0.55mi | 2/1.0 (-1) | 1,022 (-0%) | 3mo | $210,000 | $205 | 67 |
| 718 Ellis St | 0.27mi | 3/2.0 | 1,074 (+5%) | 13mo | $223,000 | $208 | 64 |
| 314 Byrd St | 0.60mi | 3/1.0 | 1,050 (+2%) | 9mo | $212,000 | $202 | 60 |
| 833 Lunsford Dr | 0.51mi | 3/1.0 | 1,056 (+3%) | 14mo | $215,000 | $204 | 59 |
| 841 Lunsford Dr | 0.53mi | 3/2.0 | 1,112 (+9%) | 1mo | $234,000 | $210 | 56 |
| 336 Byrd St | 0.58mi | 3/1.0 | 1,066 (+4%) | 12mo | $171,000 | $160 | 56 |
| 368 Frazier St | 0.54mi | 2/1.0 (-1) | 949 (-7%) | 3mo | $210,000 | $221 | 55 |
| 513 N Donahue Dr | 0.23mi | 3/2.0 | 1,175 (+15%) | 13mo | $220,000 | $187 | 50 |
| 329 Byrd St | 0.61mi | 3/2.0 | 1,104 (+8%) | 6mo | $215,000 | $195 | 50 |
| 876 Zellars Ct | 0.23mi | 3/2.0 | 1,167 (+14%) | 16mo | $240,000 | $206 | 49 |
| 1121 Dunford Ave | 0.67mi | 2/1.0 (-1) | 888 (-13%) | 12mo | $220,000 | $248 | 31 |
Match score weights: distance 35% · size 25% · config 20% · recency 20%. Top-matched comps best support the ARV.
Projected returns pro-forma
-3.0% appreciation · 6.18% rent growth · sell at horizon
- IRR
- 16.0%
- Equity multiple
- 1.67×
- Total profit
- $27,965
- Equity at exit
- $22,365
- IRR
- 26.7%
- Equity multiple
- 3.68×
- Total profit
- $112,562
- Equity at exit
- $12,969
Cash invested: $42,000 (down + closing). Projections, not guarantees.
Landlord ↔ Tenant lean methodology
- Overall (STATE)
- 90 Strongly Landlord-Friendly
- State Alabama
- 90 Strongly Landlord-Friendly · R+15
- County
- — inherits STATE
- City
- — inherits STATE
ZIP-level market 36832
- Home prices YoY
- -23.3%
- Rents YoY
- 6.2%
- Active inventory
- 359
- Price-to-rent
- 6.1×
Monthly cashflow live
- Estimated rent
- $2,059 high interval (Pro) →
- Mortgage (P&I)
- −$787
- Tax from tax record
- −$63 /mo · $757/yr
- Insurance
- −$62
- HOA
- −$0
- Vacancy / Maint / Mgmt
- −$432
- Net cashflow
- $715
Break-even live
UW: 25.0% down · 7.5% · 30yr · 1.5% tax · 5.0% vac · 8.0% maint · 8.0% mgmt
Financing live
Cash to close
- Down payment
- $37,500
- Closing costs
- $4,500
- Reserves months
- —
- Total cash needed
- —
Loan-product check · same deal, 3 products live
Conventional
25% down · 7.5% · 30yr
- Down + closing
- —
- Monthly P&I
- —
- Monthly cashflow
- —
- DSCR
- —
- Eligible?
- —
Personal DTI + credit; lowest rate.
DSCR
20% down · 8.5% · 30yr
- Down + closing
- —
- Monthly P&I
- —
- Monthly cashflow
- —
- DSCR
- —
- Eligible?
- —
No personal income docs; deal must DSCR.
Hard money
10% down · 12.0% · 12mo
- Down + closing
- —
- Monthly P&I
- —
- Monthly cashflow
- —
- DSCR
- —
- Eligible?
- —
Short-term bridge; refi at stabilization.
Rent comps 20 comps
| Address | Beds | Baths | Sqft | Rent | $/sqft | DOM | Units | Dist |
|---|---|---|---|---|---|---|---|---|
| 449 N Donahue Dr Auburn, AL | 1.0–3.0 | 1.0–3.0 | 1080 | $1,650 | $1.53 | 43d | 1 | 0.20mi |
| 340 N Donahue Dr Unit A103 Auburn, AL | 2.0 | 2.0 | 944 | $2,800 | $2.97 | 43d | 1 | 0.34mi |
| 836 W Glenn Ave #212 Auburn, AL | 2.0 | 2.0 | 1200 | $2,000 | $1.67 | 13d | 1 | 0.44mi |
| 981 Pleasant Ave Auburn, AL | 3.0 | 2.0 | 1268 | $1,650 | $1.30 | 43d | 1 | 0.52mi |
| 577 Piper Ave Auburn, AL | 3.0 | 2.0 | 1289 | $2,550 | $1.98 | 21d | 1 | 0.69mi |
| 535 Heritage Ct Auburn, AL | 2.0 | 3.0 | 1150 | $3,500 | $3.04 | 43d | 1 | 0.78mi |
| 1200 Martin Luther King Dr Auburn, AL | 2.0 | 1.0 | 846 | $1,000 | $1.18 | 13d | 1 | 0.78mi |
| 121 Wright St Unit 1E Auburn, AL | 2.0 | 2.0 | 950 | $2,500 | $2.63 | 43d | 1 | 0.79mi |
| Ross Park 3/3 TH Auburn, AL | 3.0 | 3.0 | 1495 | $1,575 | $1.05 | 43d | 1 | 0.79mi |
| 601 N Gay St Auburn, AL | 2.0 | 2.0 | 1150 | $1,700 | $1.48 | 43d | 1 | 0.83mi |
| 122 N College St Unit 1 Auburn, AL | 2.0 | 2.0 | 1010 | $1,600 | $1.58 | 21d | 1 | 0.91mi |
| 1550 Richland Rd Auburn, AL | 4.0 | 1.0–3.5 | 1157 | $2,650 | $2.29 | 13d | 97 | 0.92mi |
| 145 E Magnolia Ave #311 Auburn, AL | 2.0 | 2.0 | 1233 | $3,500 | $2.84 | 43d | 1 | 0.97mi |
| 640 N Ross St Auburn, AL | 1.0–3.0 | 1.0–3.0 | 927 | $1,775 | $1.91 | 13d | 1 | 1.16mi |
| 427 Harper Ave Auburn, AL | 2.0 | 2.0 | 1136 | $1,400 | $1.23 | 43d | 1 | 1.17mi |
| 675 Nissa Ct Auburn, AL | 3.0 | 3.0 | 1500 | $1,850 | $1.23 | 43d | 1 | 1.20mi |
| Ross Park 3/3 Duplex Auburn, AL | 3.0 | 3.0 | 1448 | $1,762 | $1.22 | 13d | 3 | 1.21mi |
| 507 E Glenn Ave Auburn, AL | 2.0 | 1.0 | 876 | $1,250 | $1.43 | 13d | 1 | 1.32mi |
| 516 E Glenn Ave Auburn, AL | 1.0–2.0 | 1.0–2.0 | 775 | $1,495 | $1.93 | 13d | 1 | 1.35mi |
| 650 DeKalb St Auburn, AL | 2.0–3.0 | 2.5–3.0 | 1326 | $2,800 | $2.11 | 43d | 1 | 1.48mi |
Listing history 4 events
-
2026-04-19status Pending
-
2026-04-09$150,000 Active
-
2023-10-04status Pending
-
2023-09-02$66,000 Active
ⓘ Source: listings_history table (triggers on properties + properties_extension) + one-shot
backfill from property_details.listing_events for pre-trigger history.
Tax reassessment forecast AL · Resets to sale price
- Current annual tax
- $757 · $63/mo
- Projected year-2 tax
- $757 · $63/mo
- Expected delta
- $0/yr ($0/mo · 0.0%)
ⓘ Screening estimate from a state-policy table — verify with the county assessor before closing.
Climate risk First Street
- Flood 1/10 Low FEMA zone X (unshaded) · 0% chance over 30 yrs
- Wildfire 3/10 Moderate
- Heat 6/10 Major 7 d/yr ≥104°F today · 20 d/yr by 30 yrs out
- Wind 6/10 Major 76% chance of damaging wind over 30 yrs
- Air quality 2/10 Low 1 unhealthy d/yr today · 1 by 30 yrs out
Nearby sold comps map
Loading sold comps map…
Walkable amenities ~0.75 mi
Loading nearby amenities…
Taxation est. · year 1
- Rental income
- $24,712
- − Mortgage interest
- −$8,402
- − Property taxes
- −$757
- − Insurance
- −$750
- − Repairs & maintenance
- −$1,977
- − Management
- −$1,977
- − Depreciation
- −$4,364
- Taxable income
- $6,485
- Est. tax owed @ 24.0%
- −$1,556
- After-tax cash flow
- $7,020/yr
For passive investors: Depreciation is non-cash, so a rental often shows a tax loss while cash-flowing — sheltering income. Rental losses are passive: they offset passive income freely, and up to $25,000/yr can offset ordinary (W-2) income if you actively participate and your MAGI is under $100k (phasing out to $0 by $150k); unused losses carry forward. On sale, claimed depreciation is recaptured at up to 25%, and gains may owe capital-gains tax (a 1031 exchange can defer both). Figures are a year-1 estimate at your 24.0% rate — not tax advice; consult a CPA.
Schools (NCES district)
- District
- Auburn City
- NCES district ID
- 0100210
- Math proficiency
- 51% ▼ -21.00%
- Reading proficiency
- 69% ▲ 5.00%
- Median HH income
- $38,126
- Composite
- 49.87/100
- National rank
- #1944
- State rank
- #7 of 129 in AL
Livability — Auburn
- Score
- 80/100
- State rank
- #6
- US rank
- #1842
Category grades
Schools grade is shown separately in the Schools card above.
Census & demographics
- Census place
- Auburn, AL
- County
- Lee County · 144,175 people
- City population
- 80,251
- Metro
- Auburn-Opelika, AL
- Population (ZIP)
- 30,959
- Household income
- $42,717
- Rent vs Own
- Severe rent burden
- 2503.0
Population outlook (Lee County) Hauer SSP2
- Today (2025)
- 196,440 people
- By 2030
- 217,417 · +10.7%
- By 2040
- 259,467 · +32.1%
- By 2050
- 301,557 · +53.5%
- By 2075
- 402,186 · +104.7%
- By 2100
- 474,503 · +141.6%
Race, ethnicity, and origin ACS 2023
- Neighborhood character
- Diverse neighborhood (Simpson 0.58)
- Race & ethnicity
- White 59% Black 26% Asian 6% Hispanic / Latino 6% Two or more races 4%
- Hispanic origin (detail)
- Mexican 3%
- Common ancestry
- Italian 3% Slovak 2% Serbian 1%
- Foreign-born
- 8% · South Korea, Canada, China
- Languages at home
- 89% English-only · Spanish 4% Korean 2% Chinese 1%
Political lean MEDSL · Lee
- 2024 margin
- Strong R (+27.8) · D 35.5% · R 63.3% · Other 1.2%
- 2008→2024 swing
- -8.1pp toward R · 2008: -19.8pp · 2024: -27.8pp
- All cycles
- 2024: R+27.8 2020: R+20.1 2016: R+23.1 2012: R+19.9 2008: R+19.8
Not yet ingested
- Civics
- —
Market trends
- HPI YoY
- ▼ -75.65%
- Current HPI
- 248.9059
- Rent YoY
- ▲ 6.18%
- Metro
- Auburn-Opelika, AL
- State GDP YoY
- ▲ 2.94%
- F500 in state
- 4
Industry mix (Fortune 500 HQ in AL)
| Industry | F500 HQs | Revenue |
|---|---|---|
| Financial Services | 1 | $8B |
|
||
| Healthcare | 1 | $5B |
|
||
Price history
+127.3% since first listed4 events — show timeline
- 2026-04-19 Pending — LCMLS
- 2026-04-09 Listed $150,000 LCMLS
- 2023-10-04 Pending — LCMLS
- 2023-09-02 Listed $66,000 LCMLS
Property tax history
+6.6%/yrLatest (2025): $757 · +0.0% YoY. Source: county tax records.
Cash-flow waterfall
monthlySold comps — $/sqft
last 12 mo · ≤1 miLoading sold comps…