1767 County Road 2224 · Lone Star, TX
Flood risk 1/10 · Minimal
- FEMA flood zone
- X
- Chance of flooding over 30 yrs
- 0.0%
- Est. flood insurance / yr
- $507 – $1,088
Fire risk 5/10 · Moderate
- Est. fire insurance / yr
- $1,222 – $2,270
Heat risk 7/10 · Major
- Hot days now (above 112°F)
- 7 days/yr
- Hot days in 30 yrs
- 24 days/yr
Wind risk 6/10 · Moderate
- Chance of severe wind over 30 yrs
- 27.0%
Air-quality risk 2/10 · Minimal
- Unhealthy air days now
- 0 days/yr
- Unhealthy air days in 30 yrs
- 1 days/yr
Risk factors via First Street. Map © Google.
Why this score? — see what drove the C- grade
The composite is a weighted blend of 9 inputs, each scored 0–100. Each bar is that input's sub-score; the figure is the points it added to the 100-point composite (weight × sub-score).
- Cash flow +17.8/30.0
- ARV discount +7.5/15.0
- Appreciation +6.6/10.0
- DSCR +5.6/10.0
- 1% rule +4.7/10.0
- Livability +3.2/5.0
- Condition / age +2.8/5.0
- Rent growth +2.5/5.0
- Schools +2.3/10.0
$115,000
🖨 Deal sheet 📄 Offer letter ✓ Due diligence
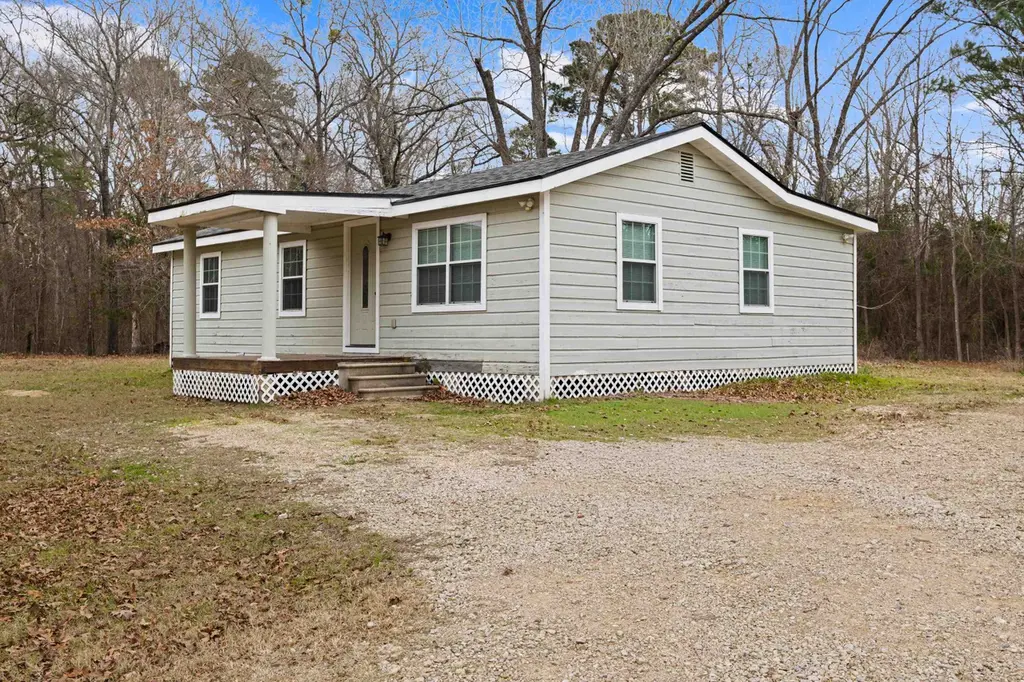
Listing remarks MLS
Don't miss this charming cottage, granite kitchen with recess lighting. Large laundry room with plenty of counter space. large deck to enjoy evening on a large lot !!!
Key facts
- Large deck
- Recess lighting
- Large lot
Tags
Neighborhood map
What this means for you Summary
Snapshot
- This is a 3-bed/1.0-bath single-family listed at $115k. Condition is rated average.
Deal economics
- At list price, monthly cash flow is $95 ($1k/yr) — positive.
- The deal already cash-flows at list — no discount required.
- To meet the 1% rule (rent ≥ 1% of price), the offer needs to be $112k (2.8% below list).
- Recommended offer: $101k (12.0% below list) — sets the bar for market timing.
Location & tenants
- Location reads 64/100 on livability (#786 in TX) — a middle-class / working-renter tenant base. Strengths: cost of living A+, housing A+, health & safety A+; Watch: employment C-, schools F, amenities F.
- Daingerfield-Lone Star ISD (town): math 24% / reading 32% proficiency, ranked #679 of 826 in TX (top 82%) — low school quality limits family demand, transient renter base, plan for 1-2y turnover; 71% free/reduced lunch — lower-income household profile, screen leases tightly.
- Market conditions: 82 active listings in the ZIP; 3 units permitted in Morris County in 2024 (0 in 5+ unit buildings).
Forward outlook
- In year one you build about $4k of equity ($795 loan paydown + $4k appreciation (3.1% local appreciation)).
- Morris County population projected at -19% by 2050 — secular population decline; favor cash flow + early exit over multi-decade hold.
- At projected returns (3.1% appreciation + 3.0% rent growth), your $32k cash investment doubles in ~6 years — after that, you're playing with house money.
- By year 8, paydown + projected appreciation supports a ~$32k cash-out refi (75% LTV) — recoverable capital for the next deal without selling this one.
Negotiation context
- It's been on market 142 days — a 12% lower offer ($101k) is reasonable based on typical stale-listing flexibility.
Risks & watch-outs
- Climate carrying-cost: major wind risk, 27% chance of damaging wind over 30y; moderate wildfire risk; extreme-heat days projected 7→24/yr by 2055 (HVAC capex compounding) — expect insurance premiums to compound above CPI over the hold.
Questions for the listing agent
- It's been on market 142 days. Have you received any prior offers? Is the seller open to a 12% concession, seller financing, or rate buy-down credit?
- Why hasn't it sold? Are there any deal-killer items the seller is aware of (foundation, flood, title, zoning, code violations)?
- Is there a deadline driving the sale (1031 exchange, divorce, estate, relocation)? That informs how much negotiation room exists.
- Schools are F-rated, which usually means shorter tenancies and higher turnover. Who's the typical renter profile here, and what's been the actual vacancy rate?
- What's the average days-on-market for RENTAL listings here right now (not sales)? A rising rental-DOM trend means longer vacancies and softer asking-rent achievability than the comps imply.
- What's the recent tenant-quality profile in this submarket — average credit score on applications, eviction rate, late-payment / NSF rate, and stable-employment percentage? A property-management company in the area should have these aggregated.
- How much new for-sale + rental construction is in the pipeline within 1–3 miles? Heavy new supply typically softens prices + rents 12–24 months out; constrained supply supports both.
Investment metrics
- 1% rule
- 0.97% ✗
- Cap rate
- 7.28%
- Cash-on-cash
- 3.54%
- DSCR
- 1.16
- GRM
- 8.6
CMA / ARV
- ARV (median comp)
- $318,601
- List price
- $115,000
- Delta
- -63.90%
- Verdict
- UNDERPRICED
- Comps
- 4 within 2.0 mi
Projected returns pro-forma
3.11% appreciation · 3.0% rent growth · sell at horizon
- IRR
- 11.1%
- Equity multiple
- 1.64×
- Total profit
- $20,581
- Equity at exit
- $52,419
- IRR
- 13.2%
- Equity multiple
- 2.99×
- Total profit
- $64,001
- Equity at exit
- $81,341
Cash invested: $32,200 (down + closing). Projections, not guarantees.
Landlord ↔ Tenant lean methodology
- Overall (STATE)
- 87 Strongly Landlord-Friendly
- State Texas
- 87 Strongly Landlord-Friendly · R+5
- County
- — inherits STATE
- City
- — inherits STATE
ZIP-level market 75638
- Home prices YoY
- 1.7%
- Active inventory
- 82
- Price-to-rent
- 8.6×
Monthly cashflow live
- Estimated rent
- $1,117 medium interval (Pro) →
- Mortgage (P&I)
- −$603
- Tax from tax record
- −$137 /mo · $1,642/yr
- Insurance
- −$48
- HOA
- −$0
- Vacancy / Maint / Mgmt
- −$235
- Net cashflow
- $95
Break-even live
UW: 25.0% down · 7.5% · 30yr · 1.5% tax · 5.0% vac · 8.0% maint · 8.0% mgmt
Financing live
Cash to close
- Down payment
- $28,750
- Closing costs
- $3,450
- Reserves months
- —
- Total cash needed
- —
Loan-product check · same deal, 3 products live
Conventional
25% down · 7.5% · 30yr
- Down + closing
- —
- Monthly P&I
- —
- Monthly cashflow
- —
- DSCR
- —
- Eligible?
- —
Personal DTI + credit; lowest rate.
DSCR
20% down · 8.5% · 30yr
- Down + closing
- —
- Monthly P&I
- —
- Monthly cashflow
- —
- DSCR
- —
- Eligible?
- —
No personal income docs; deal must DSCR.
Hard money
10% down · 12.0% · 12mo
- Down + closing
- —
- Monthly P&I
- —
- Monthly cashflow
- —
- DSCR
- —
- Eligible?
- —
Short-term bridge; refi at stabilization.
Listing history 16 events
-
2026-06-19days on market $115,000 Active 142 DOM
-
2026-06-18days on market $115,000 Active 141 DOM
-
2026-06-17days on market $115,000 Active 140 DOM
-
2026-06-16days on market $115,000 Active 139 DOM
-
2026-06-15days on market $115,000 Active 138 DOM
-
2026-06-14days on market $115,000 Active 136 DOM
-
2026-06-12days on market $115,000 Active 135 DOM
-
2026-06-09days on market $115,000 Active 132 DOM
-
2026-06-08days on market $115,000 Active 131 DOM
-
2026-06-07days on market $115,000 Active 130 DOM
-
2026-06-07days on market $115,000 Active 129 DOM
-
2026-06-02days on market $115,000 Active 125 DOM
-
2026-06-01days on market $115,000 Active 124 DOM
-
2026-05-31days on market $115,000 Active 123 DOM
-
2026-05-30days on market $115,000 Active 122 DOM
-
2026-01-28$115,000 Active 167-char remark
Show marketing remark (167 chars)
Don't miss this charming cottage, granite kitchen with recess lighting. Large laundry room with plenty of counter space. large deck to enjoy evening on a large lot !!!
ⓘ Source: listings_history table (triggers on properties + properties_extension) + one-shot
backfill from property_details.listing_events for pre-trigger history.
Tax reassessment forecast TX · Resets to sale price
- Current annual tax
- $1,642 · $137/mo
- Projected year-2 tax
- $2,104 · $175/mo
- Expected delta
- +$463/yr (+$39/mo · 28.2%)
ⓘ Screening estimate from a state-policy table — verify with the county assessor before closing.
Climate risk First Street
- Flood 1/10 Low FEMA zone X · 0% chance over 30 yrs
- Wildfire 5/10 Major
- Heat 7/10 Severe 7 d/yr ≥112°F today · 24 d/yr by 30 yrs out
- Wind 6/10 Major 27% chance of damaging wind over 30 yrs
- Air quality 2/10 Low 0 unhealthy d/yr today · 1 by 30 yrs out
Nearby sold comps map
Loading sold comps map…
Walkable amenities ~0.75 mi
Loading nearby amenities…
Taxation est. · year 1
- Rental income
- $13,409
- − Mortgage interest
- −$6,442
- − Property taxes
- −$1,642
- − Insurance
- −$575
- − Repairs & maintenance
- −$1,073
- − Management
- −$1,073
- − Depreciation
- −$3,345
- Taxable loss
- −$741
- Est. tax savings @ 24.0%
- +$178
- After-tax cash flow
- $1,317/yr
For passive investors: Depreciation is non-cash, so a rental often shows a tax loss while cash-flowing — sheltering income. Rental losses are passive: they offset passive income freely, and up to $25,000/yr can offset ordinary (W-2) income if you actively participate and your MAGI is under $100k (phasing out to $0 by $150k); unused losses carry forward. On sale, claimed depreciation is recaptured at up to 25%, and gains may owe capital-gains tax (a 1031 exchange can defer both). Figures are a year-1 estimate at your 24.0% rate — not tax advice; consult a CPA.
Condition & rehab AI · 12 photos
This charming cottage requires moderate repairs and maintenance to improve its condition and value. Painting, cleaning, and landscaping will significantly enhance its curb appeal and marketability.
Repairs flagged
- Minor porch steps — worn and uneven
- Minor hardwood floors — dust and debris present
Value-add opportunities
- Both painting interior walls — fresh paint enhances curb appeal and interior aesthetics
- Both cleaning and organizing kitchen and bath — clutter detracts from home's appeal
- Both repairing porch steps — improves safety and enhances curb appeal
- Both landscaping yard — improves curb appeal and enhances property value
Renovation cost estimate screening
| Repair item | Severity | Est. cost |
|---|---|---|
| porch steps · worn and uneven | Minor | $500–3,000 |
| hardwood floors · dust and debris present | Minor | $500–3,000 |
| Total estimated repair cost · 2 items | $1,000–6,000 |
Value-add ROI direction
- Both painting interior walls — fresh paint enhances curb appeal and interior aesthetics ↑
- Both cleaning and organizing kitchen and bath — clutter detracts from home's appeal ↑
- Both repairing porch steps — improves safety and enhances curb appeal ↑
- Both landscaping yard — improves curb appeal and enhances property value ↑
ⓘ Cost ranges are severity-bucket heuristics (US national rule-of-thumb). Get contractor quotes + a written scope before underwriting a rehab budget.
Schools (NCES district)
- District
- Daingerfield-Lone Star ISD
- NCES district ID
- 4816180
- Math proficiency
- 24% ▼ -11.00%
- Reading proficiency
- 32% ▼ -4.00%
- Median HH income
- $39,097
- Composite
- 23.48/100
- National rank
- #7877
- State rank
- #679 of 826 in TX
Livability — Lone Star
- Score
- 64/100
- State rank
- #786
- US rank
- #14389
Category grades
Schools grade is shown separately in the Schools card above.
Census & demographics
- Population (ZIP)
- 5,363
Population outlook (Morris County) Hauer SSP2
- Today (2025)
- 11,628 people
- By 2030
- 11,126 · -4.3%
- By 2040
- 10,181 · -12.4%
- By 2050
- 9,408 · -19.1%
- By 2075
- 8,268 · -28.9%
- By 2100
- 7,463 · -35.8%
Race, ethnicity, and origin ACS 2023
- Neighborhood character
- Diverse neighborhood (Simpson 0.60)
- Race & ethnicity
- White 59% Black 20% Hispanic / Latino 13% Two or more races 11% Asian 2%
- Hispanic origin (detail)
- Mexican 12%
- Common ancestry
- Scottish 4% Italian 2% Lithuanian 1%
- Foreign-born
- 6% · Canada, Vietnam
- Languages at home
- 87% English-only · Spanish 10% Vietnamese 1% Russian/Polish/Slavic 1%
Political lean MEDSL · Morris
- 2024 margin
- Solid R (+51.2) · D 24.1% · R 75.3%
- 2008→2024 swing
- -30.2pp toward R · 2008: -21.0pp · 2024: -51.2pp
- All cycles
- 2024: R+51.2 2020: R+39.4 2016: R+40.6 2012: R+26.7 2008: R+21.0
Not yet ingested
- Civics
- —
Market trends
- HPI YoY
- ▲ 3.11%
- Current HPI
- 186.7313
- Rent YoY
- —
- Metro
- —
- State GDP YoY
- ▲ 3.95%
- F500 in state
- 110
Industry mix (Fortune 500 HQ in TX)
| Industry | F500 HQs | Revenue |
|---|---|---|
| Energy | 16 | $1,198B |
|
||
| Technology | 5 | $198B |
|
||
| Engineering / Construction | 4 | $72B |
|
||
| Energy Services | 3 | $60B |
|
||
| Utilities | 3 | $41B |
|
||
| Healthcare | 2 | $330B |
|
||
Price history
1 event — show timeline
- 2026-01-28 Listed $115,000 LAAR
Cash-flow waterfall
monthlySold comps — $/sqft
last 12 mo · ≤1 miLoading sold comps…