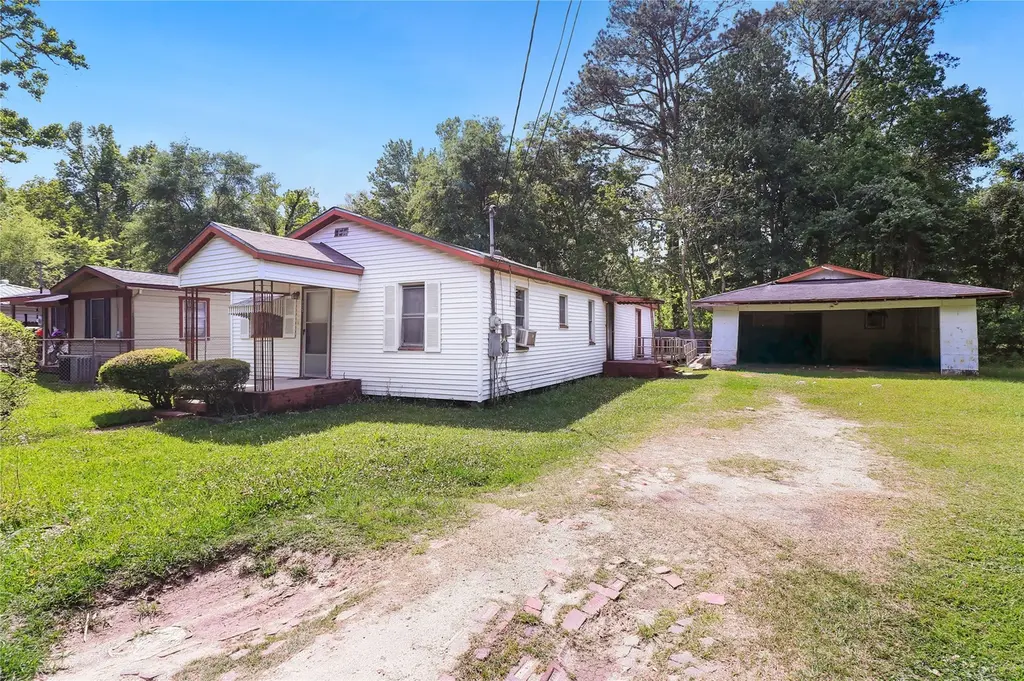
325 S 19th St · Silsbee, TX
Flood risk 1/10 · Minimal
- FEMA flood zone
- X (unshaded)
- Chance of flooding over 30 yrs
- 0.0%
- Est. flood insurance / yr
- $507 – $1,088
Fire risk 3/10 · Minor
- Est. fire insurance / yr
- $1,222 – $2,270
Heat risk 9/10 · Severe
- Hot days now (above 112°F)
- 7 days/yr
- Hot days in 30 yrs
- 23 days/yr
Wind risk 9/10 · Severe
- Chance of severe wind over 30 yrs
- 99.0%
Air-quality risk 2/10 · Minimal
- Unhealthy air days now
- 0 days/yr
- Unhealthy air days in 30 yrs
- 1 days/yr
Risk factors via First Street. Map © Google.
Why this score? — see what drove the D grade
The composite is a weighted blend of 9 inputs, each scored 0–100. Each bar is that input's sub-score; the figure is the points it added to the 100-point composite (weight × sub-score).
- Cash flow +15.0/30.0
- ARV discount +7.5/15.0
- 1% rule +5.0/10.0
- DSCR +5.0/10.0
- Livability +3.6/5.0
- Schools +2.6/10.0
- Rent growth +2.5/5.0
- Condition / age +2.5/5.0
- Appreciation +0.0/10.0
$29,000
🖨 Deal sheet 📄 Offer letter ✓ Due diligence
Listing remarks
Priced to sell! Motivated seller offering a great opportunity in a booming market. Huge lot with plenty of upside, perfect for investors or buyers with the right vision. Strong potential, solid value, and positioned for growth. Opportunities like this don't come around often, and this one won't last long.
Key facts
- 0.41 acre lot
- 2 garage spots
- Built 1933
Property features AI
Finance
- Other: Living area about 1,392; Lot size about 0.41 acres (approx. 17,999 sq ft)
- Financial info: Lease not considered
Exterior
- Parking: Detached garage; 2-car garage
- Utilities: Public water; Public sewer
- Home design: Residential property; Built in 1933; Single-story entry (entry level not specified)
- Construction: Vinyl siding; Composition roof; Pillar/post/pier foundation
- Exterior features: Cleared lot
Interior
- Bathrooms: 2 full bathrooms
- Heating & cooling: Heating provided (window unit); Window cooling units
- Interior features: 7 total rooms; Living room on the first floor (approx. 15x15)
Neighborhood map
What this means for you Summary
Snapshot
- This is a 3-bed/1.0-bath single-family listed at $29k.
Deal economics
- At list price, monthly cash flow is $1k ($12k/yr) — positive.
- The deal already cash-flows at list — no discount required.
- Meets the 1% rule at list price ($2k rent vs $29k).
- Cap rate 48.8% vs local median 5.2% in Silsbee — top-decile yield for the area; either an underpriced asset or a hidden risk that comps aren't pricing in. Stress-test before assuming the spread holds.
Location & tenants
- Location reads 72/100 on livability (#263 in TX) — a middle-class / working-renter tenant base. Strengths: cost of living A+, housing A+, health & safety A+; Watch: amenities F, commute F.
- Silsbee ISD (town): math 25% / reading 36% proficiency, ranked #614 of 826 in TX (top 74%) — families likely to look elsewhere, expect single-tenant / working-renter base with shorter leases.
- Zoned schools: Edwards-Johnson Memorial Middle (math 23% / reading 31%, grade F, #1,177 of 1,662 statewide, top 72%, 633 students, 65% FRL); Silsbee H S (math 22% / reading 43%, grade F, #1,029 of 1,632 statewide, top 64%, 814 students, 62% FRL).
- Market conditions: 127 active listings in the ZIP; 4 comparable units currently listed for rent nearby; rentals at typical pace (median 21d on market — plan ~3-4 weeks tenant-placement turnaround); 358 units permitted in Hardin County in 2024 (0 in 5+ unit buildings).
Forward outlook
- Local home prices are declining (-3.0%/yr); year-one equity from $200 of loan paydown is wiped out by about $870 of value loss. Plan a longer hold.
- At projected returns (-3.0% appreciation + 3.0% rent growth), your $8k cash investment doubles in ~1 year — after that, you're playing with house money.
Negotiation context
- Only 7 days on market — expect competitive offers; lowballing is unlikely to land.
- 3 sale attempts with the ask held roughly flat each time — persistent listings suggest the price (not the market) is what's stuck; bring a comps-based counter.
Risks & watch-outs
- Watch-outs: built in 1933 — expect roof / HVAC / electrical / plumbing capex.
- Climate carrying-cost: severe wind risk, 99% chance of damaging wind over 30y; extreme-heat days projected 7→23/yr by 2055 (HVAC capex compounding) — expect insurance premiums to compound above CPI over the hold.
Questions for the listing agent
- Built in 1933 — when were the roof, HVAC, electrical panel, plumbing, and water heater last replaced?
- Is there a deadline driving the sale (1031 exchange, divorce, estate, relocation)? That informs how much negotiation room exists.
- The area grade is low — what's the realistic commute time and amenity access for the typical tenant pool here? Any planned neighborhood developments (good or bad) we should know about?
- What's the average days-on-market for RENTAL listings here right now (not sales)? A rising rental-DOM trend means longer vacancies and softer asking-rent achievability than the comps imply.
- What's the recent tenant-quality profile in this submarket — average credit score on applications, eviction rate, late-payment / NSF rate, and stable-employment percentage? A property-management company in the area should have these aggregated.
- How much new for-sale + rental construction is in the pipeline within 1–3 miles? Heavy new supply typically softens prices + rents 12–24 months out; constrained supply supports both.
Investment metrics
- 1% rule
- 5.36% ✓
- Cap rate
- 48.80%
- Cash-on-cash
- 151.82%
- DSCR
- 7.76
- GRM
- 1.6
CMA / ARV
- ARV (median comp)
- $137,241
- List price
- $29,000
- Delta
- -71.58%
- Verdict
- UNDERPRICED
- Comps
- 11 within 1.0 mi
Show comp detail 2 sales within ~0.75 mi
| Address | Dist | Beds/Ba | Sqft | Sold | Price | $/sf | Match |
|---|---|---|---|---|---|---|---|
| 1570 Old Highway 418 | 0.55mi | 3/2.0 | 1,440 (+3%) | 1mo | $219,900 | $153 | 64 |
| 317 Pinewood Dr | 0.74mi | 3/1.0 | 1,300 (-7%) | 12mo | $165,000 | $127 | 44 |
Match score weights: distance 35% · size 25% · config 20% · recency 20%. Top-matched comps best support the ARV.
Projected returns pro-forma
-3.0% appreciation · 3.0% rent growth · sell at horizon
- IRR
- —
- Equity multiple
- 8.48×
- Total profit
- $60,756
- Equity at exit
- $4,324
- IRR
- —
- Equity multiple
- 17.90×
- Total profit
- $137,254
- Equity at exit
- $2,507
Cash invested: $8,120 (down + closing). Projections, not guarantees.
Landlord ↔ Tenant lean methodology
- Overall (STATE)
- 87 Strongly Landlord-Friendly
- State Texas
- 87 Strongly Landlord-Friendly · R+5
- County
- — inherits STATE
- City
- — inherits STATE
ZIP-level market 77656
- Active inventory
- 127
- Price-to-rent
- 1.6×
Monthly cashflow live
- Estimated rent
- $1,554 medium interval (Pro) →
- Mortgage (P&I)
- −$152
- Tax est. 1.5%
- −$36 /mo · $435/yr
- Insurance
- −$12
- HOA
- −$0
- Vacancy / Maint / Mgmt
- −$326
- Net cashflow
- $1,027
Break-even live
UW: 25.0% down · 7.5% · 30yr · 1.5% tax · 5.0% vac · 8.0% maint · 8.0% mgmt
Financing live
Cash to close
- Down payment
- $7,250
- Closing costs
- $870
- Reserves months
- —
- Total cash needed
- —
Loan-product check · same deal, 3 products live
Conventional
25% down · 7.5% · 30yr
- Down + closing
- —
- Monthly P&I
- —
- Monthly cashflow
- —
- DSCR
- —
- Eligible?
- —
Personal DTI + credit; lowest rate.
DSCR
20% down · 8.5% · 30yr
- Down + closing
- —
- Monthly P&I
- —
- Monthly cashflow
- —
- DSCR
- —
- Eligible?
- —
No personal income docs; deal must DSCR.
Hard money
10% down · 12.0% · 12mo
- Down + closing
- —
- Monthly P&I
- —
- Monthly cashflow
- —
- DSCR
- —
- Eligible?
- —
Short-term bridge; refi at stabilization.
Rent comps 4 comps
| Address | Beds | Baths | Sqft | Rent | $/sqft | DOM | Units | Dist |
|---|---|---|---|---|---|---|---|---|
| 680 S 3rd St Silsbee, TX | 3.0 | 1.0 | 1510 | $1,600 | $1.06 | 13d | 1 | 1.17mi |
| 750 S 3rd St Unit 12 Silsbee, TX | 2.0 | 1.0 | 900 | $875 | $0.97 | 43d | 1 | 1.18mi |
| 1108 N 3rd St Silsbee, TX | 3.0 | 1.5 | 1500 | $1,500 | $1.00 | 21d | 1 | 1.28mi |
| 454 Winters St Silsbee, TX | 3.0 | 2.0 | 1330 | $1,695 | $1.27 | 21d | 1 | 1.40mi |
Listing history 12 events
-
2026-06-15status $29,000 Pending 7 DOM
-
2026-06-15days on market $29,000 Active 7 DOM
-
2026-06-14days on market $29,000 Active 5 DOM
-
2026-06-10days on market $29,000 Active 2 DOM
-
2026-06-09pricedays on market $29,000 Active 1 DOM
-
2026-05-04price $55,000 306-char remark
-
2026-04-11$65,000 Active 306-char remark
-
2026-03-16historical
-
2026-03-10price $49,000
-
2026-03-03price $59,000
-
2026-02-24$75,000 Active
-
2012-01-17soldstatus
ⓘ Source: listings_history table (triggers on properties + properties_extension) + one-shot
backfill from property_details.listing_events for pre-trigger history.
Climate risk First Street
- Flood 1/10 Low FEMA zone X (unshaded) · 0% chance over 30 yrs
- Wildfire 3/10 Moderate
- Heat 9/10 Extreme 7 d/yr ≥112°F today · 23 d/yr by 30 yrs out
- Wind 9/10 Extreme 99% chance of damaging wind over 30 yrs
- Air quality 2/10 Low 0 unhealthy d/yr today · 1 by 30 yrs out
Nearby sold comps map
Loading sold comps map…
Walkable amenities ~0.75 mi
Loading nearby amenities…
Taxation est. · year 1
- Rental income
- $18,649
- − Mortgage interest
- −$1,624
- − Property taxes
- −$435
- − Insurance
- −$145
- − Repairs & maintenance
- −$1,492
- − Management
- −$1,492
- − Depreciation
- −$844
- Taxable income
- $12,617
- Est. tax owed @ 24.0%
- −$3,028
- After-tax cash flow
- $9,300/yr
For passive investors: Depreciation is non-cash, so a rental often shows a tax loss while cash-flowing — sheltering income. Rental losses are passive: they offset passive income freely, and up to $25,000/yr can offset ordinary (W-2) income if you actively participate and your MAGI is under $100k (phasing out to $0 by $150k); unused losses carry forward. On sale, claimed depreciation is recaptured at up to 25%, and gains may owe capital-gains tax (a 1031 exchange can defer both). Figures are a year-1 estimate at your 24.0% rate — not tax advice; consult a CPA.
Schools (NCES district)
- District
- Silsbee ISD
- NCES district ID
- 4840230
- Math proficiency
- 25% ▼ -23.00%
- Reading proficiency
- 36% ▼ -11.00%
- Median HH income
- $44,907
- Composite
- 26.09/100
- National rank
- #7292
- State rank
- #614 of 826 in TX
Livability — Silsbee
- Score
- 72/100
- State rank
- #263
- US rank
- #6215
Category grades
Schools grade is shown separately in the Schools card above.
Census & demographics
- Census place
- Silsbee, TX
- County
- Hardin County · 39,783 people
- City population
- 17,525
- Metro
- Beaumont-Port Arthur, TX
- Population (ZIP)
- 17,525
- Household income
- $62,303
- Rent vs Own
- Severe rent burden
- 306.0
Population outlook (Hardin County) Hauer SSP2
- Today (2025)
- 57,780 people
- By 2030
- 58,296 · +0.9%
- By 2040
- 58,421 · +1.1%
- By 2050
- 57,391 · -0.7%
- By 2075
- 53,132 · -8.0%
- By 2100
- 44,905 · -22.3%
Race, ethnicity, and origin ACS 2023
- Neighborhood character
- Predominantly White (74%)
- Race & ethnicity
- White 74% Black 14% Two or more races 8% Hispanic / Latino 7%
- Hispanic origin (detail)
- Mexican 4%
- Common ancestry
- Lithuanian 4% Serbian 3% Italian 2%
- Foreign-born
- 3% · Canada
- Languages at home
- 96% English-only · Spanish 3% Other Indo-European 1%
Political lean MEDSL · Hardin
- 2024 margin
- Solid R (+75.8) · D 11.9% · R 87.7%
- 2008→2024 swing
- -14.6pp toward R · 2008: -61.2pp · 2024: -75.8pp
- All cycles
- 2024: R+75.8 2020: R+73.8 2016: R+73.9 2012: R+67.6 2008: R+61.2
Not yet ingested
- Civics
- —
Market trends
- HPI YoY
- ▼ -93.73%
- Current HPI
- 141.1371
- Rent YoY
- —
- Metro
- Beaumont-Port Arthur, TX
- State GDP YoY
- ▲ 3.95%
- F500 in state
- 110
Industry mix (Fortune 500 HQ in TX)
| Industry | F500 HQs | Revenue |
|---|---|---|
| Energy | 16 | $1,198B |
|
||
| Technology | 5 | $198B |
|
||
| Engineering / Construction | 4 | $72B |
|
||
| Energy Services | 3 | $60B |
|
||
| Utilities | 3 | $41B |
|
||
| Healthcare | 2 | $330B |
|
||
Price history
-61.3% since first listed12 events — show timeline
- 2026-06-16 Sold (MLS) — HARMLS
- 2026-06-15 Pending — HARMLS
- 2026-06-08 Listed $29,000 HARMLS
- 2026-05-29 Listing Removed — HARMLS
- 2026-05-27 Price Changed $39,000 HARMLS
- 2026-05-04 Price Changed $55,000 HARMLS
- 2026-04-11 Listed $65,000 HARMLS
- 2026-03-16 Listing Removed — HARMLS
- 2026-03-10 Price Changed $49,000 HARMLS
- 2026-03-03 Price Changed $59,000 HARMLS
- 2026-02-24 Listed $75,000 HARMLS
- 2012-01-17 Sold (Public Records) — Public Records
Property tax history
+6.4%/yrLatest (2025): $1,790 · -1.4% YoY. Source: county tax records.
Cash-flow waterfall
monthlySold comps — $/sqft
last 12 mo · ≤1 miLoading sold comps…