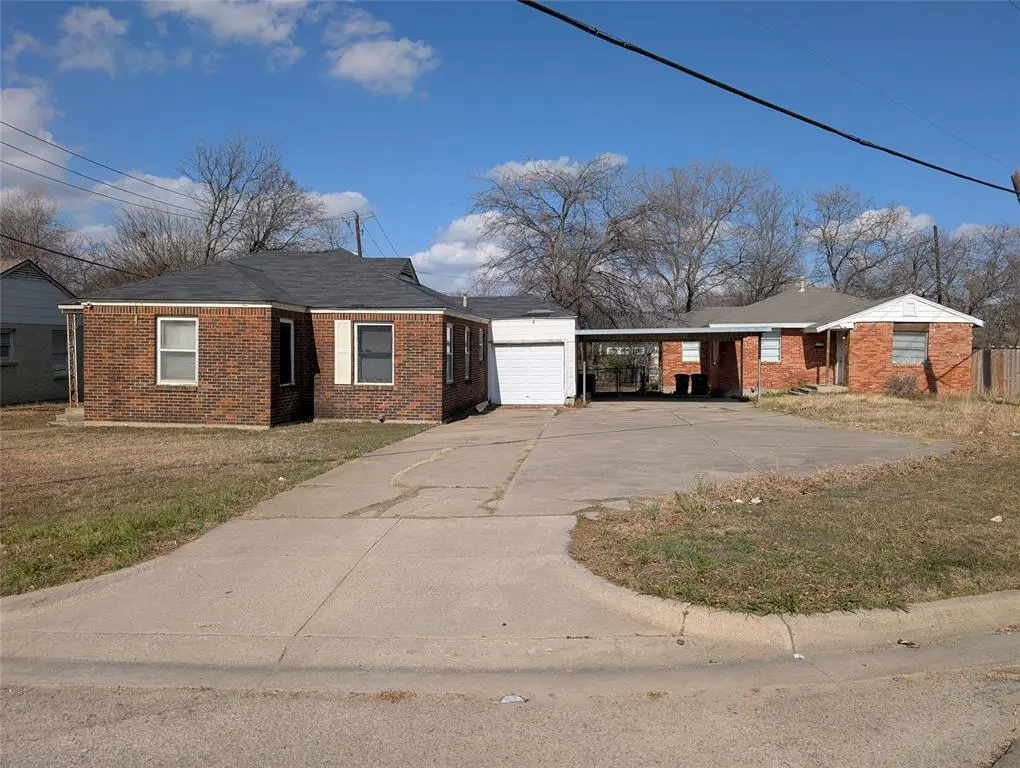
2600 W Bewick St · Fort Worth, TX
Flood risk 1/10 · Minimal
- FEMA flood zone
- X (unshaded)
- Chance of flooding over 30 yrs
- 0.0%
- Est. flood insurance / yr
- $507 – $1,088
Fire risk 1/10 · Minimal
- Est. fire insurance / yr
- $1,222 – $2,270
Heat risk 7/10 · Major
- Hot days now (above 109°F)
- 7 days/yr
- Hot days in 30 yrs
- 23 days/yr
Wind risk 4/10 · Minor
- Chance of severe wind over 30 yrs
- 24.0%
Air-quality risk 3/10 · Minor
- Unhealthy air days now
- 2 days/yr
- Unhealthy air days in 30 yrs
- 3 days/yr
Risk factors via First Street. Map © Google.
Why this score? — see what drove the D grade
The composite is a weighted blend of 9 inputs, each scored 0–100. Each bar is that input's sub-score; the figure is the points it added to the 100-point composite (weight × sub-score).
- ARV discount +14.4/15.0
- Cash flow +9.1/30.0
- Livability +4.0/5.0
- Rent growth +3.7/5.0
- DSCR +2.5/10.0
- Condition / age +2.5/5.0
- 1% rule +2.4/10.0
- Schools +2.0/10.0
- Appreciation +0.0/10.0
$419,000
🖨 Deal sheet 📄 Offer letter ✓ Due diligence
Listing remarks MLS
Full Duplex, two separate units each roughly 1000 sq ft. Large lot with plenty of parking. Hard wood floors throughout both units. The unit on the right has 3 bedrooms, 1 bath, living room and kitchen. The unit on the left has 2 bedrooms, 1 bath, kitchen, living room and dining room.
Key facts
- Hard wood floors
- Large lot
- Full duplex
Tags
Neighborhood map
What this means for you Summary
Snapshot
- This is a 3-bed/1.0-bath single-family listed at $419k.
Deal economics
- At list price, monthly cash flow is $-325 ($-4k/yr) — negative.
- To cash-flow at today's rent, offer at most $362k (13.7% below list).
- To meet the 1% rule (rent ≥ 1% of price), the offer needs to be $309k (26.3% below list).
- Recommended offer: $309k (26.3% below list) — sets the bar for 1% rule.
- Cap rate 5.4% vs local median 3.9% in Fort Worth — top-decile yield for the area; either an underpriced asset or a hidden risk that comps aren't pricing in. Stress-test before assuming the spread holds.
Location & tenants
- Location reads 80/100 on livability (#49 in TX, #1,954 nationally) — a professional / high-income tenant draw. Strengths: amenities A+, cost of living A+, housing A+; Watch: schools D+, crime F.
- Fort Worth ISD (urban): math 18% / reading 28% proficiency, ranked #742 of 826 in TX (top 90%) — low school quality limits family demand, transient renter base, plan for 1-2y turnover; 73% free/reduced lunch — lower-income household profile, screen leases tightly.
- Market conditions: Rents rising fast (+4.7%/yr); 185 active listings in the ZIP; 40 comparable units currently listed for rent nearby; rentals at typical pace (median 19d on market — plan ~3-4 weeks tenant-placement turnaround); solid renter incomes; 18,938 units permitted in Tarrant County in 2024 (8,336 in 5+ unit buildings).
- This rent runs 37% of the median local income ($101k/yr) — at the standard rent-burdened threshold; future hikes will face affordability resistance.
Forward outlook
- Local home prices are declining (-3.0%/yr); year-one equity from $3k of loan paydown is wiped out by about $13k of value loss. Plan a longer hold.
- Tarrant County population projected at +41% by 2050 — long-run rental-demand tailwind backs the buy-and-hold thesis.
Negotiation context
- It's been on market 139 days — a 12% lower offer ($369k) is reasonable based on typical stale-listing flexibility.
- 2 sale attempts; this cycle's ask has dropped $26k (6%) from the opening price — seller is motivated, your offer sets the floor, not the list.
Risks & watch-outs
- Watch-outs: built in 1947 — expect roof / HVAC / electrical / plumbing capex.
- Climate carrying-cost: extreme-heat days projected 7→23/yr by 2055 (HVAC capex compounding) — expect insurance premiums to compound above CPI over the hold.
Questions for the listing agent
- What do current leases actually rent for vs. the listed asking? Can we see a recent rent roll and the last 12 months of T-12 income?
- It's been on market 139 days. Have you received any prior offers? Is the seller open to a 26% concession, seller financing, or rate buy-down credit?
- Built in 1947 — when were the roof, HVAC, electrical panel, plumbing, and water heater last replaced?
- Why hasn't it sold? Are there any deal-killer items the seller is aware of (foundation, flood, title, zoning, code violations)?
- Is there a deadline driving the sale (1031 exchange, divorce, estate, relocation)? That informs how much negotiation room exists.
- Schools are D-rated, which usually means shorter tenancies and higher turnover. Who's the typical renter profile here, and what's been the actual vacancy rate?
- Crime grade is F in this area — have there been break-ins, vandalism, or insurance claims at this property in the last 3 years? What carrier currently insures it and at what premium?
- The area grade is low — what's the realistic commute time and amenity access for the typical tenant pool here? Any planned neighborhood developments (good or bad) we should know about?
- What's the average days-on-market for RENTAL listings here right now (not sales)? A rising rental-DOM trend means longer vacancies and softer asking-rent achievability than the comps imply.
- What's the recent tenant-quality profile in this submarket — average credit score on applications, eviction rate, late-payment / NSF rate, and stable-employment percentage? A property-management company in the area should have these aggregated.
- How much new for-sale + rental construction is in the pipeline within 1–3 miles? Heavy new supply typically softens prices + rents 12–24 months out; constrained supply supports both.
Investment metrics
- 1% rule
- 0.74% ✗
- Cap rate
- 5.36%
- Cash-on-cash
- -3.32%
- DSCR
- 0.85
- GRM
- 11.3
CMA / ARV
- ARV (median comp)
- $494,920
- List price
- $419,000
- Delta
- -15.34%
- Verdict
- UNDERPRICED
- Comps
- 20 within 1.0 mi
Show comp detail 12 sales within ~0.75 mi
| Address | Dist | Beds/Ba | Sqft | Sold | Price | $/sf | Match |
|---|---|---|---|---|---|---|---|
| 3221 Waits Ave | 0.25mi | 3/1.0 | 1,804 (-6%) | 8mo | $395,000 | $219 | 72 |
| 3241 Waits Ave | 0.21mi | 3/3.0 | 2,132 (+11%) | 0mo | $695,000 | $326 | 63 |
| 3118 Greene Ave | 0.41mi | 3/1.0 | 1,809 (-6%) | 11mo | $550,000 | $304 | 62 |
| 3224 Cockrell Ave | 0.34mi | 3/2.0 | 1,754 (-9%) | 5mo | $455,000 | $259 | 61 |
| 3516 Rogers Ave | 0.46mi | 4/2.0 (+1) | 1,862 (-3%) | 10mo | $499,000 | $268 | 56 |
| 3305 Park Ridge Blvd | 0.18mi | 4/3.0 (+1) | 1,674 (-13%) | 3mo | $445,000 | $266 | 55 |
| 3529 Stadium Dr | 0.61mi | 3/2.0 | 1,789 (-7%) | 5mo | $499,000 | $279 | 52 |
| 3605 Jeanette Dr | 0.45mi | 3/2.0 | 1,660 (-14%) | 3mo | $478,000 | $288 | 50 |
| 3128 Odessa Ave | 0.62mi | 3/3.5 | 2,065 (+8%) | 1mo | $775,000 | $375 | 47 |
| 3221 Stadium Dr | 0.60mi | 3/2.0 | 2,093 (+9%) | 10mo | $799,900 | $382 | 44 |
| 2833 W Biddison St | 0.23mi | 4/4.5 (+1) | 2,109 (+10%) | 12mo | $599,999 | $284 | 43 |
| 3032 James Ave | 0.70mi | 3/2.0 | 1,676 (-13%) | 9mo | $399,995 | $239 | 34 |
Match score weights: distance 35% · size 25% · config 20% · recency 20%. Top-matched comps best support the ARV.
Projected returns pro-forma
-3.0% appreciation · 4.67% rent growth · sell at horizon
- IRR
- -20.1%
- Equity multiple
- 0.29×
- Total profit
- $-83,336
- Equity at exit
- $62,474
- IRR
- -10.1%
- Equity multiple
- 0.34×
- Total profit
- $-76,928
- Equity at exit
- $36,227
Cash invested: $117,320 (down + closing). Projections, not guarantees.
Landlord ↔ Tenant lean methodology
- Overall (STATE)
- 87 Strongly Landlord-Friendly
- State Texas
- 87 Strongly Landlord-Friendly · R+5
- County
- — inherits STATE
- City
- — inherits STATE
ZIP-level market 76109
- Rents YoY
- 4.7%
- Active inventory
- 185
- Price-to-rent
- 11.3×
Monthly cashflow live
- Estimated rent
- $3,090 high interval (Pro) →
- Mortgage (P&I)
- −$2,197
- Tax from tax record
- −$394 /mo · $4,726/yr
- Insurance
- −$175
- HOA
- −$0
- Vacancy / Maint / Mgmt
- −$649
- Net cashflow
- $-325
Break-even live
UW: 25.0% down · 7.5% · 30yr · 1.5% tax · 5.0% vac · 8.0% maint · 8.0% mgmt
Financing live
Cash to close
- Down payment
- $104,750
- Closing costs
- $12,570
- Reserves months
- —
- Total cash needed
- —
Loan-product check · same deal, 3 products live
Conventional
25% down · 7.5% · 30yr
- Down + closing
- —
- Monthly P&I
- —
- Monthly cashflow
- —
- DSCR
- —
- Eligible?
- —
Personal DTI + credit; lowest rate.
DSCR
20% down · 8.5% · 30yr
- Down + closing
- —
- Monthly P&I
- —
- Monthly cashflow
- —
- DSCR
- —
- Eligible?
- —
No personal income docs; deal must DSCR.
Hard money
10% down · 12.0% · 12mo
- Down + closing
- —
- Monthly P&I
- —
- Monthly cashflow
- —
- DSCR
- —
- Eligible?
- —
Short-term bridge; refi at stabilization.
Rent comps 40 comps
| Address | Beds | Baths | Sqft | Rent | $/sqft | DOM | Units | Dist |
|---|---|---|---|---|---|---|---|---|
| 2716 W Biddison St Fort Worth, TX | 4.0 | 3.0 | 1572 | $4,000 | $2.54 | 12d | 1 | 0.11mi |
| 2521 Benbrook Blvd Fort Worth, TX | 3.0 | 3.0 | 1849 | $4,000 | $2.16 | 4d | 1 | 0.12mi |
| 2804 W Biddison St Fort Worth, TX | 4.0 | 3.0 | 2200 | $4,250 | $1.93 | 14d | 1 | 0.13mi |
| 2509 Benbrook Blvd Unit 902 Fort Worth, TX | 3.0 | 3.0 | 1756 | $2,595 | $1.48 | 43d | 1 | 0.13mi |
| 2505 Benbrook Blvd Unit 503 Fort Worth, TX | 3.0 | 3.0 | 1367 | $2,495 | $1.83 | 43d | 1 | 0.14mi |
| 3240 Sandage Ave Fort Worth, TX | 4.0 | 4.0 | 2200 | $3,900 | $1.77 | 14d | 1 | 0.18mi |
| 3229 Waits Ave Fort Worth, TX | 4.0 | 3.0 | 1830 | $3,900 | $2.13 | 43d | 1 | 0.24mi |
| 3217 Lubbock Ave Unit B Fort Worth, TX | 3.0 | 3.0 | 1856 | $3,150 | $1.70 | 18d | 1 | 0.25mi |
| 3445 Frazier Ave Fort Worth, TX | 3.0 | 2.5 | 1540 | $2,200 | $1.43 | 43d | 1 | 0.29mi |
| 3245 Cockrell Ave Fort Worth, TX | 2.0 | 1.0 | 1402 | $2,500 | $1.78 | 43d | 1 | 0.29mi |
| 3201 Forest Park Blvd Fort Worth, TX | 4.0 | 4.0 | 1772 | $3,750 | $2.12 | 18d | 1 | 0.32mi |
| 3145 Waits Ave #302 Fort Worth, TX | 3.0 | 3.0 | 1245 | $3,000 | $2.41 | 24d | 1 | 0.33mi |
| 3259 S University Dr Unit A Fort Worth, TX | 3.0 | 3.0 | 1490 | $2,495 | $1.67 | 43d | 1 | 0.33mi |
| 3553 Mission St Fort Worth, TX | 4.0 | 2.0 | 1510 | $2,950 | $1.95 | 6d | 1 | 0.34mi |
| 3128 Lubbock Ave Fort Worth, TX | 4.0 | 4.0 | 1800 | $3,500 | $1.94 | 6d | 1 | 0.34mi |
| 3324 S University Dr Unit Down Fort Worth, TX | 2.0 | 2.0 | 1312 | $1,600 | $1.22 | 4d | 1 | 0.34mi |
| 2933 South Hills Ave Fort Worth, TX | 4.0 | 3.0 | 2301 | $3,500 | $1.52 | 18d | 1 | 0.35mi |
| 3136 Wayside Ave Fort Worth, TX | 3.0 | 2.5 | 1875 | $3,000 | $1.60 | 6d | 1 | 0.37mi |
| 3134 Wayside Ave Fort Worth, TX | 3.0 | 2.5 | 1922 | $3,000 | $1.56 | 6d | 1 | 0.38mi |
| 3315 Rogers Ave Fort Worth, TX | 3.0 | 1.0 | 1532 | $3,300 | $2.15 | 43d | 1 | 0.38mi |
| 3144 Cockrell Ave Fort Worth, TX | 3.0 | 3.0 | 2210 | $2,550 | $1.15 | 4d | 1 | 0.40mi |
| 3136 Cockrell Ave Unit 102 Fort Worth, TX | 3.0 | 3.0 | 1376 | $3,900 | $2.83 | 5d | 1 | 0.42mi |
| 3208 S University Dr Unit The Carter 306B Fort Worth, TX | 4.0 | 2.0 | 1385 | $4,800 | $3.47 | 18d | 1 | 0.43mi |
| 3605 Jeanette Dr Fort Worth, TX | 3.0 | 2.0 | 1660 | $3,200 | $1.93 | 24d | 1 | 0.43mi |
| 3704 Jeanette Dr Fort Worth, TX | 4.0 | 3.0 | 2148 | $2,900 | $1.35 | 14d | 1 | 0.49mi |
| 3616 Harwen Ter Fort Worth, TX | 3.0 | 2.0 | 1664 | $3,300 | $1.98 | 43d | 1 | 0.59mi |
| 3533 Stadium Dr Fort Worth, TX | 3.0 | 2.0 | 1683 | $3,000 | $1.78 | 4d | 1 | 0.60mi |
| 3103 Odessa Ave Fort Worth, TX | 4.0 | 2.0 | 1884 | $4,500 | $2.39 | 43d | 1 | 0.63mi |
| 3817 Winfield Ave Unit 2026 2027 Fort Worth, TX | 4.0 | 4.0 | 2283 | $2,995 | $1.31 | 18d | 1 | 0.65mi |
| 3557 Winston Rd Fort Worth, TX | 4.0 | 2.0 | 2184 | $3,095 | $1.42 | 43d | 1 | 0.65mi |
| 3417 Westcliff Rd S Fort Worth, TX | 3.0 | 2.0 | 1818 | $3,500 | $1.93 | 18d | 1 | 0.65mi |
| 3411 8th Ave Fort Worth, TX | 3.0 | 2.0 | 1280 | $1,700 | $1.33 | 4d | 1 | 0.66mi |
| 3303 8th Ave Fort Worth, TX | 3.0 | 2.0 | 1348 | $2,000 | $1.48 | 24d | 1 | 0.68mi |
| 2821 Parmer Ave #125 Fort Worth, TX | 3.0 | 3.5 | 1898 | $2,350 | $1.24 | 43d | 1 | 0.73mi |
| 2800 Sandage Ave Apt 203 Fort Worth, TX | 3.0 | 3.0 | 1931 | $3,300 | $1.71 | 6d | 1 | 0.75mi |
| 3518 Westcliff Rd S Fort Worth, TX | 4.0 | 4.0 | 2539 | $4,000 | $1.58 | 11d | 1 | 0.76mi |
| 2813 Parmer Ave Unit 103 Fort Worth, TX | 3.0 | 2.5 | 2405 | $4,200 | $1.75 | 19d | 1 | 0.76mi |
| 2800 Lubbock Ave Unit 102 Fort Worth, TX | 3.0 | 2.5 | 2405 | $4,200 | $1.75 | 22d | 1 | 0.76mi |
| 3201 Ryan Ave Fort Worth, TX | 4.0 | 2.0 | 2000 | $2,100 | $1.05 | 43d | 1 | 0.77mi |
| 2816 Gordon Ave Fort Worth, TX | 3.0 | 3.0 | 1570 | $3,000 | $1.91 | 6d | 1 | 0.82mi |
Listing history 18 events
-
2026-06-18days on market $419,000 Active 139 DOM
-
2026-06-17days on market $419,000 Active 138 DOM
-
2026-06-16days on market $419,000 Active 137 DOM
-
2026-06-15days on market $419,000 Active 136 DOM
-
2026-06-13days on market $419,000 Active 134 DOM
-
2026-06-09days on market $419,000 Active 130 DOM
-
2026-06-08days on market $419,000 Active 129 DOM
-
2026-06-07days on market $419,000 Active 128 DOM
-
2026-06-04days on market $419,000 Active 125 DOM
-
2026-06-03days on market $419,000 Active 124 DOM
-
2026-06-02days on market $419,000 Active 123 DOM
-
2026-06-02days on market $419,000 Active 122 DOM
-
2026-05-31days on market $419,000 Active 121 DOM
-
2026-05-18status Active 284-char remark
Show marketing remark (284 chars)
Full Duplex, two separate units each roughly 1000 sq ft. Large lot with plenty of parking. Hard wood floors throughout both units. The unit on the right has 3 bedrooms, 1 bath, living room and kitchen. The unit on the left has 2 bedrooms, 1 bath, kitchen, living room and dining room.
-
2026-05-12historical Active Option Contract 284-char remark
Show marketing remark (284 chars)
Full Duplex, two separate units each roughly 1000 sq ft. Large lot with plenty of parking. Hard wood floors throughout both units. The unit on the right has 3 bedrooms, 1 bath, living room and kitchen. The unit on the left has 2 bedrooms, 1 bath, kitchen, living room and dining room.
-
2026-03-27price $419,000 284-char remark
Show marketing remark (284 chars)
Full Duplex, two separate units each roughly 1000 sq ft. Large lot with plenty of parking. Hard wood floors throughout both units. The unit on the right has 3 bedrooms, 1 bath, living room and kitchen. The unit on the left has 2 bedrooms, 1 bath, kitchen, living room and dining room.
-
2026-01-28$444,900 Active 284-char remark
Show marketing remark (284 chars)
Full Duplex, two separate units each roughly 1000 sq ft. Large lot with plenty of parking. Hard wood floors throughout both units. The unit on the right has 3 bedrooms, 1 bath, living room and kitchen. The unit on the left has 2 bedrooms, 1 bath, kitchen, living room and dining room.
-
1994-07-13soldstatus
ⓘ Source: listings_history table (triggers on properties + properties_extension) + one-shot
backfill from property_details.listing_events for pre-trigger history.
Tax reassessment forecast TX · Resets to sale price
- Current annual tax
- $4,726 · $394/mo
- Projected year-2 tax
- $7,668 · $639/mo
- Expected delta
- +$2,942/yr (+$245/mo · 62.2%)
ⓘ Screening estimate from a state-policy table — verify with the county assessor before closing.
Climate risk First Street
- Flood 1/10 Low FEMA zone X (unshaded) · 0% chance over 30 yrs
- Wildfire 1/10 Low
- Heat 7/10 Severe 7 d/yr ≥109°F today · 23 d/yr by 30 yrs out
- Wind 4/10 Moderate 24% chance of damaging wind over 30 yrs
- Air quality 3/10 Moderate 2 unhealthy d/yr today · 3 by 30 yrs out
Nearby sold comps map
Loading sold comps map…
Walkable amenities ~0.75 mi
Loading nearby amenities…
Taxation est. · year 1
- Rental income
- $37,077
- − Mortgage interest
- −$23,471
- − Property taxes
- −$4,726
- − Insurance
- −$2,095
- − Repairs & maintenance
- −$2,966
- − Management
- −$2,966
- − Depreciation
- −$12,189
- Taxable loss
- −$11,336
- Est. tax savings @ 24.0%
- +$2,721
- After-tax cash flow
- $-1,177/yr
For passive investors: Depreciation is non-cash, so a rental often shows a tax loss while cash-flowing — sheltering income. Rental losses are passive: they offset passive income freely, and up to $25,000/yr can offset ordinary (W-2) income if you actively participate and your MAGI is under $100k (phasing out to $0 by $150k); unused losses carry forward. On sale, claimed depreciation is recaptured at up to 25%, and gains may owe capital-gains tax (a 1031 exchange can defer both). Figures are a year-1 estimate at your 24.0% rate — not tax advice; consult a CPA.
Schools (NCES district)
- District
- Fort Worth ISD
- NCES district ID
- 4819700
- Math proficiency
- 18% ▼ -16.00%
- Reading proficiency
- 28% ▼ -6.00%
- Median HH income
- $42,109
- Composite
- 19.61/100
- National rank
- #8753
- State rank
- #742 of 826 in TX
Livability — Fort Worth
- Score
- 80/100
- State rank
- #49
- US rank
- #1954
Category grades
Schools grade is shown separately in the Schools card above.
Census & demographics
- Census place
- Fort Worth, TX
- County
- Tarrant County · 2,033,669 people
- City population
- 911,619
- Metro
- Dallas-Fort Worth-Arlington, TX
- Population (ZIP)
- 26,006
- Household income
- $100,507
- Rent vs Own
- Severe rent burden
- 1281.0
Population outlook (Tarrant County) Hauer SSP2
- Today (2025)
- 2,380,417 people
- By 2030
- 2,578,900 · +8.3%
- By 2040
- 2,974,995 · +25.0%
- By 2050
- 3,350,489 · +40.8%
- By 2075
- 4,216,909 · +77.2%
- By 2100
- 4,741,527 · +99.2%
Race, ethnicity, and origin ACS 2023
- Neighborhood character
- Predominantly White (75%)
- Race & ethnicity
- White 75% Hispanic / Latino 11% Two or more races 7% Asian 6% Black 5%
- Hispanic origin (detail)
- Mexican 8%
- Common ancestry
- Slovak 5% Italian 3% Lithuanian 2%
- Foreign-born
- 9% · Canada, China, Vietnam
- Languages at home
- 85% English-only · Spanish 7% Other Indo-European 2% Arabic 2%
Political lean MEDSL · Tarrant
- 2024 margin
- Lean R (+5.1) · D 46.7% · R 51.9% · Other 1.4%
- 2008→2024 swing
- +6.6pp toward D · 2008: -11.7pp · 2024: -5.1pp
- All cycles
- 2024: R+5.1 2020: D+0.2 2016: R+8.7 2012: R+15.7 2008: R+11.7
Not yet ingested
- Civics
- —
Market trends
- HPI YoY
- ▼ -505.62%
- Current HPI
- 296.162
- Rent YoY
- ▲ 4.67%
- Metro
- Dallas-Fort Worth-Arlington, TX
- State GDP YoY
- ▲ 3.95%
- F500 in state
- 110
Industry mix (Fortune 500 HQ in TX)
| Industry | F500 HQs | Revenue |
|---|---|---|
| Energy | 16 | $1,198B |
|
||
| Technology | 5 | $198B |
|
||
| Engineering / Construction | 4 | $72B |
|
||
| Energy Services | 3 | $60B |
|
||
| Utilities | 3 | $41B |
|
||
| Healthcare | 2 | $330B |
|
||
Price history
-5.8% since first listed5 events — show timeline
- 2026-05-18 Relisted — NTREIS
- 2026-05-12 Contingent — NTREIS
- 2026-03-27 Price Changed $419,000 NTREIS
- 2026-01-28 Listed $444,900 NTREIS
- 1994-07-13 Sold (Public Records) — Public Records
Property tax history
+3.7%/yrLatest (2025): $4,726 · -2.4% YoY. Source: county tax records.
Cash-flow waterfall
monthlySold comps — $/sqft
last 12 mo · ≤1 miLoading sold comps…