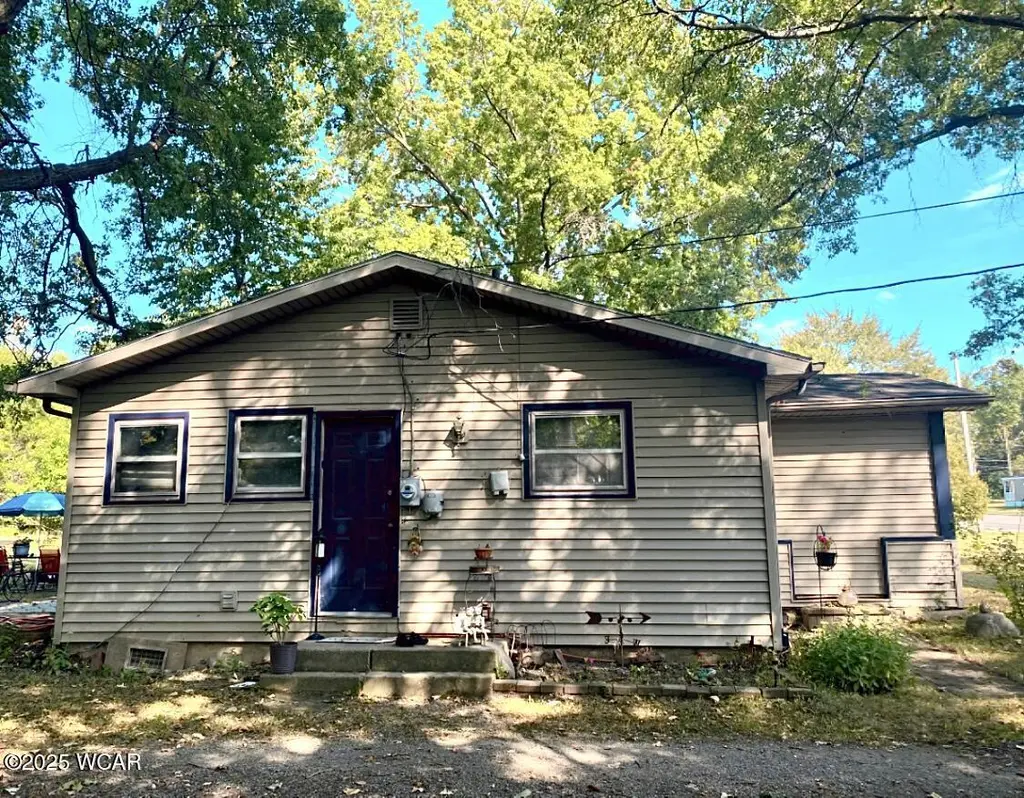
1580 W Robb Ave · Lima, OH
Flood risk 4/10 · Minor
- FEMA flood zone
- X (unshaded)
- Chance of flooding over 30 yrs
- 0.22%
- Est. flood insurance / yr
- $473 – $860
Fire risk 1/10 · Minimal
- Est. fire insurance / yr
- $713 – $1,323
Heat risk 3/10 · Minor
- Hot days now (above 100°F)
- 7 days/yr
- Hot days in 30 yrs
- 18 days/yr
Wind risk 2/10 · Minimal
- Chance of severe wind over 30 yrs
- —
Air-quality risk 2/10 · Minimal
- Unhealthy air days now
- 1 days/yr
- Unhealthy air days in 30 yrs
- 2 days/yr
Risk factors via First Street. Map © Google.
Why this score? — see what drove the B grade
The composite is a weighted blend of 9 inputs, each scored 0–100. Each bar is that input's sub-score; the figure is the points it added to the 100-point composite (weight × sub-score).
- Cash flow +27.6/30.0
- ARV discount +14.0/15.0
- DSCR +9.7/10.0
- 1% rule +7.7/10.0
- Schools +5.0/10.0
- Livability +3.2/5.0
- Rent growth +2.5/5.0
- Condition / age +2.5/5.0
- Appreciation +0.0/10.0
$109,900
🖨 Deal sheet 📄 Offer letter ✓ Due diligence
Listing remarks MLS
Great location for this 2 bedroom 1 bath home in Elida school district. Home features a large living room and enclosed porch. Laundry room. Beautiful 1.17 acre lot with lots of mature shade trees. 2 car garage.
Key facts
- Laundry room
- Large living room
- Enclosed porch
Tags
Neighborhood map
What this means for you Summary
Snapshot
- This is a 2-bed/1.0-bath single-family listed at $110k.
Deal economics
- At list price, monthly cash flow is $328 ($4k/yr) — positive.
- The deal already cash-flows at list — no discount required.
- Meets the 1% rule at list price ($1k rent vs $110k).
- Recommended offer: $97k (12.0% below list) — sets the bar for market timing.
- Cap rate 9.9% vs local median 7.7% in Lima — meaningfully above typical; check what's discounted (condition, days-on-market, listing class) to confirm the premium yield is real.
Location & tenants
- Location reads 64/100 on livability (#787 in OH) — a middle-class / working-renter tenant base. Strengths: cost of living A+, housing A+, health & safety A-; Watch: crime F, amenities F, commute F.
- Elida Local (rural): math 59% / reading 59% proficiency, ranked #311 of 656 in OH (top 47%) — acceptable for families but not a draw, mixed tenant base, ~2y average lease.
- Market conditions: 105 active listings in the ZIP; 1 comparable units currently listed for rent nearby; 88 units permitted in Allen County in 2024 (0 in 5+ unit buildings).
Forward outlook
- Local home prices are declining (-3.0%/yr); year-one equity from $760 of loan paydown is wiped out by about $3k of value loss. Plan a longer hold.
- Allen County population projected at -14% by 2050 — secular population decline; favor cash flow + early exit over multi-decade hold.
- At projected returns (-3.0% appreciation + 3.0% rent growth), your $31k cash investment doubles in ~9 years — after that, you're playing with house money.
Negotiation context
- It's been on market 127 days — a 12% lower offer ($97k) is reasonable based on typical stale-listing flexibility.
- 3 sale attempts; this cycle's ask has dropped $12k (10%) from the opening price — seller is motivated, your offer sets the floor, not the list.
- Current owner paid $56k; list at $110k implies a 96% gain — meaningful room to come down on a strong offer.
Questions for the listing agent
- It's been on market 127 days. Have you received any prior offers? Is the seller open to a 12% concession, seller financing, or rate buy-down credit?
- Built in 1963 — when were the roof, HVAC, electrical panel, plumbing, and water heater last replaced?
- Why hasn't it sold? Are there any deal-killer items the seller is aware of (foundation, flood, title, zoning, code violations)?
- Is there a deadline driving the sale (1031 exchange, divorce, estate, relocation)? That informs how much negotiation room exists.
- Crime grade is F in this area — have there been break-ins, vandalism, or insurance claims at this property in the last 3 years? What carrier currently insures it and at what premium?
- What's the average days-on-market for RENTAL listings here right now (not sales)? A rising rental-DOM trend means longer vacancies and softer asking-rent achievability than the comps imply.
- What's the recent tenant-quality profile in this submarket — average credit score on applications, eviction rate, late-payment / NSF rate, and stable-employment percentage? A property-management company in the area should have these aggregated.
- How much new for-sale + rental construction is in the pipeline within 1–3 miles? Heavy new supply typically softens prices + rents 12–24 months out; constrained supply supports both.
Investment metrics
- 1% rule
- 1.27% ✓
- Cap rate
- 9.87%
- Cash-on-cash
- 12.77%
- DSCR
- 1.57
- GRM
- 6.5
CMA / ARV
- ARV (median comp)
- $128,458
- List price
- $109,900
- Delta
- -14.45%
- Verdict
- UNDERPRICED
- Comps
- 20 within 1.0 mi
Show comp detail 9 sales within ~0.75 mi
| Address | Dist | Beds/Ba | Sqft | Sold | Price | $/sf | Match |
|---|---|---|---|---|---|---|---|
| 1153 Bahama Dr | 0.36mi | 3/1.0 (+1) | 1,026 (+12%) | 10mo | $150,000 | $146 | 49 |
| 806 Ewing Ave | 0.75mi | 3/1.0 (+1) | 992 (+9%) | 1mo | $31,000 | $31 | 45 |
| 1372 Latham Ave | 0.61mi | 2/1.0 | 1,019 (+12%) | 9mo | $125,000 | $123 | 44 |
| 1121 Bahama Dr | 0.44mi | 3/1.0 (+1) | 1,026 (+12%) | 11mo | $142,450 | $139 | 44 |
| 765 W Lane Ave | 0.69mi | 3/1.0 (+1) | 999 (+10%) | 5mo | $141,000 | $141 | 42 |
| 1128 Bahama Dr | 0.42mi | 3/1.0 (+1) | 1,026 (+12%) | 16mo | $139,900 | $136 | 42 |
| 1120 Melrose St | 0.64mi | 3/1.0 (+1) | 1,040 (+14%) | 2mo | $165,000 | $159 | 40 |
| 1011 Logan Ave | 0.53mi | 2/1.0 | 792 (-13%) | 23mo | $110,000 | $139 | 34 |
| 805 N Nixon Ave | 0.68mi | 2/2.0 | 1,036 (+14%) | 20mo | $169,500 | $164 | 25 |
Match score weights: distance 35% · size 25% · config 20% · recency 20%. Top-matched comps best support the ARV.
Projected returns pro-forma
-3.0% appreciation · 3.0% rent growth · sell at horizon
- IRR
- 2.6%
- Equity multiple
- 1.10×
- Total profit
- $3,084
- Equity at exit
- $16,386
- IRR
- 12.2%
- Equity multiple
- 1.96×
- Total profit
- $29,679
- Equity at exit
- $9,502
Cash invested: $30,772 (down + closing). Projections, not guarantees.
Landlord ↔ Tenant lean methodology
- Overall (STATE)
- 73 Landlord-Friendly
- State Ohio
- 73 Landlord-Friendly · R+6
- County
- — inherits STATE
- City
- — inherits STATE
ZIP-level market 45805
- Active inventory
- 105
- Price-to-rent
- 6.5×
Monthly cashflow live
- Estimated rent
- $1,400 medium interval (Pro) →
- Mortgage (P&I)
- −$576
- Tax from tax record
- −$156 /mo · $1,876/yr
- Insurance
- −$46
- HOA
- −$0
- Vacancy / Maint / Mgmt
- −$294
- Net cashflow
- $328
Break-even live
UW: 25.0% down · 7.5% · 30yr · 1.5% tax · 5.0% vac · 8.0% maint · 8.0% mgmt
Financing live
Cash to close
- Down payment
- $27,475
- Closing costs
- $3,297
- Reserves months
- —
- Total cash needed
- —
Loan-product check · same deal, 3 products live
Conventional
25% down · 7.5% · 30yr
- Down + closing
- —
- Monthly P&I
- —
- Monthly cashflow
- —
- DSCR
- —
- Eligible?
- —
Personal DTI + credit; lowest rate.
DSCR
20% down · 8.5% · 30yr
- Down + closing
- —
- Monthly P&I
- —
- Monthly cashflow
- —
- DSCR
- —
- Eligible?
- —
No personal income docs; deal must DSCR.
Hard money
10% down · 12.0% · 12mo
- Down + closing
- —
- Monthly P&I
- —
- Monthly cashflow
- —
- DSCR
- —
- Eligible?
- —
Short-term bridge; refi at stabilization.
Rent comps 1 comps
| Address | Beds | Baths | Sqft | Rent | $/sqft | DOM | Units | Dist |
|---|---|---|---|---|---|---|---|---|
| 1014 W Market St Apt 3 Lima, OH | 2.0 | 1.0 | 800 | $1,400 | $1.75 | 43d | 1 | 1.34mi |
Listing history 22 events
-
2026-06-19days on market $109,900 Active 127 DOM
-
2026-06-18days on market $109,900 Active 126 DOM
-
2026-06-17days on market $109,900 Active 125 DOM
-
2026-06-16days on market $109,900 Active 124 DOM
-
2026-06-15days on market $109,900 Active 123 DOM
-
2026-06-14days on market $109,900 Active 121 DOM
-
2026-06-12days on market $109,900 Active 120 DOM
-
2026-06-08days on market $109,900 Active 116 DOM
-
2026-06-07days on market $109,900 Active 115 DOM
-
2026-06-05days on market $109,900 Active 113 DOM
-
2026-06-04days on market $109,900 Active 111 DOM
-
2026-06-02days on market $109,900 Active 110 DOM
-
2026-06-01days on market $109,900 Active 109 DOM
-
2026-05-31days on market $109,900 Active 108 DOM
-
2026-05-31days on market $109,900 Active 107 DOM
-
2026-03-09status Active 212-char remark
Show marketing remark (212 chars)
Great location for this 2 bedroom 1 bath home in Elida school district. Home features a large living room and enclosed porch. Laundry room. Beautiful 1.17 acre lot with lots of mature shade trees. 2 car garage.
-
2026-03-09price $109,900 212-char remark
Show marketing remark (212 chars)
Great location for this 2 bedroom 1 bath home in Elida school district. Home features a large living room and enclosed porch. Laundry room. Beautiful 1.17 acre lot with lots of mature shade trees. 2 car garage.
-
2025-10-31status Active 212-char remark
Show marketing remark (212 chars)
Great location for this 2 bedroom 1 bath home in Elida school district. Home features a large living room and enclosed porch. Laundry room. Beautiful 1.17 acre lot with lots of mature shade trees. 2 car garage.
-
2025-10-06status Pending 212-char remark
Show marketing remark (212 chars)
Great location for this 2 bedroom 1 bath home in Elida school district. Home features a large living room and enclosed porch. Laundry room. Beautiful 1.17 acre lot with lots of mature shade trees. 2 car garage.
-
2025-09-11$121,500 Active 212-char remark
Show marketing remark (212 chars)
Great location for this 2 bedroom 1 bath home in Elida school district. Home features a large living room and enclosed porch. Laundry room. Beautiful 1.17 acre lot with lots of mature shade trees. 2 car garage.
-
1999-01-05soldstatus $56,000
-
1996-02-27soldstatus $42,000
ⓘ Source: listings_history table (triggers on properties + properties_extension) + one-shot
backfill from property_details.listing_events for pre-trigger history.
Tax reassessment forecast OH · Partial reset (capped growth)
- Current annual tax
- $1,876 · $156/mo
- Projected year-2 tax
- $1,876 · $156/mo
- Expected delta
- $0/yr ($0/mo · 0.0%)
ⓘ Screening estimate from a state-policy table — verify with the county assessor before closing.
Climate risk First Street
- Flood 4/10 Moderate FEMA zone X (unshaded) · 22% chance over 30 yrs
- Wildfire 1/10 Low
- Heat 3/10 Moderate 7 d/yr ≥100°F today · 18 d/yr by 30 yrs out
- Wind 2/10 Low
- Air quality 2/10 Low 1 unhealthy d/yr today · 2 by 30 yrs out
Nearby sold comps map
Loading sold comps map…
Walkable amenities ~0.75 mi
Loading nearby amenities…
Taxation est. · year 1
- Rental income
- $16,800
- − Mortgage interest
- −$6,156
- − Property taxes
- −$1,876
- − Insurance
- −$550
- − Repairs & maintenance
- −$1,344
- − Management
- −$1,344
- − Depreciation
- −$3,197
- Taxable income
- $2,333
- Est. tax owed @ 24.0%
- −$560
- After-tax cash flow
- $3,370/yr
For passive investors: Depreciation is non-cash, so a rental often shows a tax loss while cash-flowing — sheltering income. Rental losses are passive: they offset passive income freely, and up to $25,000/yr can offset ordinary (W-2) income if you actively participate and your MAGI is under $100k (phasing out to $0 by $150k); unused losses carry forward. On sale, claimed depreciation is recaptured at up to 25%, and gains may owe capital-gains tax (a 1031 exchange can defer both). Figures are a year-1 estimate at your 24.0% rate — not tax advice; consult a CPA.
Schools (NCES district)
- District
- Elida Local
- NCES district ID
- 3904577
- Math proficiency
- 59% ▼ -11.00%
- Reading proficiency
- 59% ▼ -7.00%
- Median HH income
- $46,632
- Composite
- 49.93/100
- National rank
- #1934
- State rank
- #311 of 656 in OH
Livability — Lima
- Score
- 64/100
- State rank
- #787
- US rank
- #14288
Category grades
Schools grade is shown separately in the Schools card above.
Census & demographics
- County
- Allen · 98,169 people
- City population
- 21,739
- Metro
- Lima, OH
- Population (ZIP)
- 24,746
- Household income
- $65,954
- Rent vs Own
- Severe rent burden
- 8.0
Population outlook (Allen County) Hauer SSP2
- Today (2025)
- 100,321 people
- By 2030
- 97,693 · -2.6%
- By 2040
- 91,802 · -8.5%
- By 2050
- 86,152 · -14.1%
- By 2075
- 73,659 · -26.6%
- By 2100
- 58,716 · -41.5%
Race, ethnicity, and origin ACS 2023
- Neighborhood character
- Predominantly White (74%)
- Race & ethnicity
- White 74% Black 15% Two or more races 6% Hispanic / Latino 4% Asian 1%
- Common ancestry
- Italian 2% Slovak 2% Romanian 2%
- Foreign-born
- 2% · Canada, Vietnam
- Languages at home
- 96% English-only · Spanish 1% Vietnamese 1%
Political lean MEDSL · Allen
- 2024 margin
- Solid R (+44.1) · D 27.5% · R 71.6%
- 2008→2024 swing
- -23.4pp toward R · 2008: -20.7pp · 2024: -44.1pp
- All cycles
- 2024: R+44.1 2020: R+39.5 2016: R+38.2 2012: R+25.7 2008: R+20.7
Not yet ingested
- Civics
- —
Market trends
- HPI YoY
- ▼ -156.78%
- Current HPI
- 210.6397
- Rent YoY
- —
- Metro
- —
- State GDP YoY
- ▲ 1.98%
- F500 in state
- 48
Industry mix (Fortune 500 HQ in OH)
| Industry | F500 HQs | Revenue |
|---|---|---|
| Insurance | 3 | $145B |
|
||
| Industrial Machinery | 3 | $49B |
|
||
| Financial Services | 3 | $24B |
|
||
| Consumer Goods | 2 | $93B |
|
||
| Aerospace / Defense | 2 | $47B |
|
||
| Utilities | 2 | $33B |
|
||
Price history
+161.7% since first listed7 events — show timeline
- 2026-03-09 Relisted — WCARE
- 2026-03-09 Price Changed $109,900 WCARE
- 2025-10-31 Relisted — WCARE
- 2025-10-06 Pending — WCARE
- 2025-09-11 Listed $121,500 WCARE
- 1999-01-05 Sold (Public Records) $56,000 Public Records
- 1996-02-27 Sold (Public Records) $42,000 Public Records
Property tax history
+1.5%/yrLatest (2025): $1,876 · +0.7% YoY. Source: county tax records.
Cash-flow waterfall
monthlySold comps — $/sqft
last 12 mo · ≤1 miLoading sold comps…