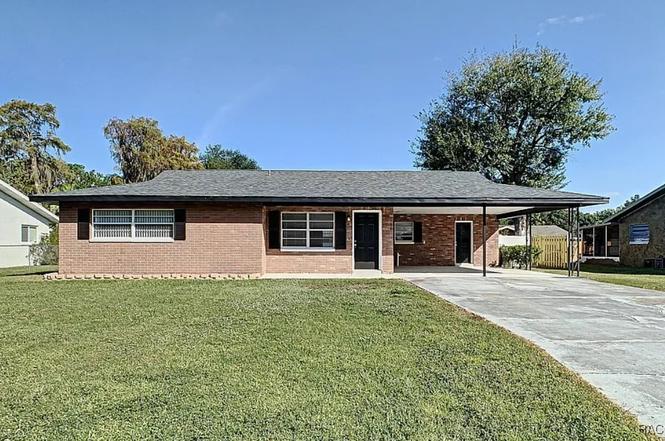
1113 SE 2nd St · Crystal River, FL
Flood risk 10/10 · Severe
- FEMA flood zone
- AE
- Chance of flooding over 30 yrs
- 0.99%
- Est. flood insurance / yr
- $1,737 – $8,500
Fire risk 5/10 · Moderate
- Est. fire insurance / yr
- $947 – $1,759
Heat risk 10/10 · Severe
- Hot days now (above 109°F)
- 7 days/yr
- Hot days in 30 yrs
- 26 days/yr
Wind risk 9/10 · Severe
- Chance of severe wind over 30 yrs
- 99.0%
Air-quality risk 1/10 · Minimal
- Unhealthy air days now
- 0 days/yr
- Unhealthy air days in 30 yrs
- 0 days/yr
Risk factors via First Street. Map © Google.
Why this score? — see what drove the B+ grade
The composite is a weighted blend of 9 inputs, each scored 0–100. Each bar is that input's sub-score; the figure is the points it added to the 100-point composite (weight × sub-score).
- Cash flow +30.0/30.0
- ARV discount +13.8/15.0
- 1% rule +10.0/10.0
- DSCR +10.0/10.0
- Schools +4.1/10.0
- Livability +3.3/5.0
- Rent growth +2.5/5.0
- Condition / age +2.5/5.0
- Appreciation +0.0/10.0
$189,000
🖨 Deal sheet 📄 Offer letter ✓ Due diligence
Listing remarks MLS
Spacious 3 bedroom, 2 bath home that features a oversized living room, family area just off the kitchen, enclosed porch in the back, and inside laundry.
Key facts
- Expanded kitchen
- Breakfast bar
- Remodeled bathrooms
Tags
Property features AI
Finance
- Other: Irrigation metered; Level, rectangular lot (approximately 0.19 acres); Zoned R1; Subdivision: Charpias Add to Crystal River
Exterior
- Parking: 2 parking spaces; Attached carport; Driveway; Paved parking
- Utilities: Public water; Public sewer
- Home design: Single family residence; One story
- Construction: Brick and stucco construction; Asphalt shingle roof; Block, brick/mortar, and slab foundation; Built recently (year built not provided)
- Exterior features: Fenced yard; Outdoor pool; Paved road access
Interior
- Kitchen: Dishwasher; Electric oven; Electric range; Freezer; Microwave; Refrigerator
- Bedrooms: 3 total rooms
- Flooring: Vinyl flooring
- Bathrooms: 2 full bathrooms
- Heating & cooling: Central heating (electric); Central electric cooling
- Interior features: Open floorplan
Neighborhood map
What this means for you Summary
Snapshot
- This is a 3-bed/2.0-bath single-family listed at $189k.
Deal economics
- At list price, monthly cash flow is $425 ($5k/yr) — positive.
- The deal already cash-flows at list — no discount required.
- Meets the 1% rule at list price ($3k rent vs $189k).
- Recommended offer: $166k (12.0% below list) — sets the bar for market timing.
- Cap rate 11.7% vs local median 2.1% in Crystal River — top-decile yield for the area; either an underpriced asset or a hidden risk that comps aren't pricing in. Stress-test before assuming the spread holds.
Location & tenants
- Location reads 66/100 on livability (#603 in FL) — a middle-class / working-renter tenant base. Strengths: crime A+, cost of living A+; Watch: health & safety C-, amenities F, commute F.
- Citrus (rural): math 49% / reading 50% proficiency, ranked #44 of 73 in FL (top 60%) — families likely to look elsewhere, expect single-tenant / working-renter base with shorter leases.
- Zoned schools: Crystal River Primary School (math 45% / reading 55%, grade D+, #1,070 of 2,144 statewide, top 51%, 654 students, 70% FRL); Crystal River Middle School (math 49% / reading 47%, grade C-, #286 of 571 statewide, top 50%, 900 students, 64% FRL); Crystal River High School (math 31% / reading 44%, grade F, #336 of 667 statewide, top 51%, 1,249 students, 56% FRL).
- Market conditions: 325 active listings in the ZIP; 2 comparable units currently listed for rent nearby; 2,443 units permitted in Citrus County in 2024 (0 in 5+ unit buildings).
Forward outlook
- Local home prices are declining (-3.0%/yr); year-one equity from $1k of loan paydown is wiped out by about $6k of value loss. Plan a longer hold.
- Citrus County population projected to shrink 10% by 2050 — rents likely to lag national; underwrite the cash flow, not the appreciation.
Negotiation context
- It's been on market 201 days — a 12% lower offer ($166k) is reasonable based on typical stale-listing flexibility.
- 6 sale attempts since 22y ago; this cycle's ask has dropped $61k (24%) from the opening price — seller is motivated, your offer sets the floor, not the list.
- Current owner paid $157k; 20% above their basis — modest negotiation headroom, anchor on the comps not their cost.
Risks & watch-outs
- Watch-outs: flood insurance adds $427/mo.
- Climate carrying-cost: in FEMA flood zone AE (mandatory federal flood insurance); severe wind risk, 99% chance of damaging wind over 30y; moderate wildfire risk; extreme-heat days projected 7→26/yr by 2055 (HVAC capex compounding) — expect insurance premiums to compound above CPI over the hold.
Questions for the listing agent
- It's been on market 201 days. Have you received any prior offers? Is the seller open to a 12% concession, seller financing, or rate buy-down credit?
- Built in 1974 — when were the roof, HVAC, electrical panel, plumbing, and water heater last replaced?
- What's the actual annual flood-insurance premium (NFIP or private), and is the property in a SFHA with mandatory coverage?
- Why hasn't it sold? Are there any deal-killer items the seller is aware of (foundation, flood, title, zoning, code violations)?
- Is there a deadline driving the sale (1031 exchange, divorce, estate, relocation)? That informs how much negotiation room exists.
- Schools are D-rated, which usually means shorter tenancies and higher turnover. Who's the typical renter profile here, and what's been the actual vacancy rate?
- What's the average days-on-market for RENTAL listings here right now (not sales)? A rising rental-DOM trend means longer vacancies and softer asking-rent achievability than the comps imply.
- What's the recent tenant-quality profile in this submarket — average credit score on applications, eviction rate, late-payment / NSF rate, and stable-employment percentage? A property-management company in the area should have these aggregated.
- How much new for-sale + rental construction is in the pipeline within 1–3 miles? Heavy new supply typically softens prices + rents 12–24 months out; constrained supply supports both.
Investment metrics
- 1% rule
- 1.50% ✓
- Cap rate
- 11.70%
- Cash-on-cash
- 19.32%
- DSCR
- 1.86
- GRM
- 5.6
CMA / ARV
- ARV (on-the-fly)
- $219,696
- Comps found
- 6
Show comp detail 6 sales within ~0.75 mi
| Address | Dist | Beds/Ba | Sqft | Sold | Price | $/sf | Match |
|---|---|---|---|---|---|---|---|
| 1103 SE 3rd St | 0.05mi | 3/2.0 | 1,596 (+0%) | 1mo | $220,000 | $138 | 96 |
| 1225 NE 2nd St | 0.25mi | 3/2.0 | 1,500 (-6%) | 0mo | $288,000 | $192 | 78 |
| 1134 SE 2nd St | 0.04mi | 3/2.0 | 1,794 (+13%) | 9mo | $160,000 | $89 | 70 |
| 1124 SE 2nd St | 0.03mi | 2/1.0 (-1) | 1,424 (-11%) | 22mo | $197,000 | $138 | 53 |
| 115 NE 9th Ave | 0.33mi | 3/2.0 | 1,456 (-8%) | 22mo | $160,000 | $110 | 52 |
| 745 NE 5th Ter | 0.62mi | 4/2.0 (+1) | 1,680 (+6%) | 16mo | $130,000 | $77 | 43 |
Match score weights: distance 35% · size 25% · config 20% · recency 20%. Top-matched comps best support the ARV.
Projected returns pro-forma
-3.0% appreciation · 3.0% rent growth · sell at horizon
- IRR
- -1.6%
- Equity multiple
- 0.94×
- Total profit
- $-3,187
- Equity at exit
- $28,181
- IRR
- 8.3%
- Equity multiple
- 1.63×
- Total profit
- $33,530
- Equity at exit
- $16,341
Cash invested: $52,920 (down + closing). Projections, not guarantees.
Landlord ↔ Tenant lean methodology
- Overall (STATE)
- 87 Strongly Landlord-Friendly
- State Florida
- 87 Strongly Landlord-Friendly · R+3
- County
- — inherits STATE
- City
- — inherits STATE
ZIP-level market 34429
- Home prices YoY
- -17.8%
- Active inventory
- 325
- Price-to-rent
- 5.6×
Monthly cashflow live
- Estimated rent
- $2,827 medium interval (Pro) →
- Mortgage (P&I)
- −$991
- Tax from tax record
- −$311 /mo · $3,736/yr
- Insurance
- −$79
- Flood insurance flood zone
- −$427 /mo · $5,118/yr
- HOA
- −$0
- Vacancy / Maint / Mgmt
- −$594
- Net cashflow
- $425
Break-even live
UW: 25.0% down · 7.5% · 30yr · 1.5% tax · 5.0% vac · 8.0% maint · 8.0% mgmt
Financing live
Cash to close
- Down payment
- $47,250
- Closing costs
- $5,670
- Reserves months
- —
- Total cash needed
- —
Loan-product check · same deal, 3 products live
Conventional
25% down · 7.5% · 30yr
- Down + closing
- —
- Monthly P&I
- —
- Monthly cashflow
- —
- DSCR
- —
- Eligible?
- —
Personal DTI + credit; lowest rate.
DSCR
20% down · 8.5% · 30yr
- Down + closing
- —
- Monthly P&I
- —
- Monthly cashflow
- —
- DSCR
- —
- Eligible?
- —
No personal income docs; deal must DSCR.
Hard money
10% down · 12.0% · 12mo
- Down + closing
- —
- Monthly P&I
- —
- Monthly cashflow
- —
- DSCR
- —
- Eligible?
- —
Short-term bridge; refi at stabilization.
Rent comps 2 comps
| Address | Beds | Baths | Sqft | Rent | $/sqft | DOM | Units | Dist |
|---|---|---|---|---|---|---|---|---|
| 1004 SE 5th Ave Crystal River, FL | 3.0 | 2.5 | 2114 | $3,500 | $1.66 | 21d | 1 | 0.90mi |
| 1328 NE 5th Ave Crystal River, FL | 3.0 | 2.0 | 1946 | $2,000 | $1.03 | 21d | 1 | 1.20mi |
Listing history 32 events
-
2026-06-15status $189,000 Pending 201 DOM
-
2026-06-15days on market $189,000 Active 201 DOM
-
2026-06-14days on market $189,000 Active 199 DOM
-
2026-06-13days on market $189,000 Active 198 DOM
-
2026-06-09days on market $189,000 Active 195 DOM
-
2026-06-08days on market $189,000 Active 194 DOM
-
2026-06-03days on market $189,000 Active 189 DOM
-
2026-06-02days on market $189,000 Active 188 DOM
-
2026-06-01days on market $189,000 Active 187 DOM
-
2026-05-31days on market $189,000 Active 186 DOM
-
2026-05-30days on market $189,000 Active 185 DOM
-
2026-05-19price $189,000
-
2026-04-07price $199,000
-
2026-01-27price $219,900
-
2026-01-07status Active
-
2025-11-04historical
-
2025-09-23$249,900 Active
-
2022-11-30historical
-
2022-11-14price $279,000
-
2022-10-27price $289,800
-
2022-10-19$299,800 Active
-
2022-03-09soldstatus $157,100 Closed 152-char remark
Show marketing remark (152 chars)
Spacious 3 bedroom, 2 bath home that features a oversized living room, family area just off the kitchen, enclosed porch in the back, and inside laundry.
-
2022-01-20status Pending 152-char remark
Show marketing remark (152 chars)
Spacious 3 bedroom, 2 bath home that features a oversized living room, family area just off the kitchen, enclosed porch in the back, and inside laundry.
-
2022-01-10$135,000 Active 152-char remark
Show marketing remark (152 chars)
Spacious 3 bedroom, 2 bath home that features a oversized living room, family area just off the kitchen, enclosed porch in the back, and inside laundry.
-
2018-02-22soldstatus $114,900
-
2018-02-13soldstatus $114,900
-
2017-08-29$114,900
-
2005-03-16soldstatus $115,000
-
2005-03-11soldstatus $115,000
-
2004-11-03$119,900
-
2004-09-16soldstatus $75,500
-
1995-04-21soldstatus $45,000
ⓘ Source: listings_history table (triggers on properties + properties_extension) + one-shot
backfill from property_details.listing_events for pre-trigger history.
Tax reassessment forecast FL · Resets to sale price
- Current annual tax
- $3,736 · $311/mo
- Projected year-2 tax
- $3,736 · $311/mo
- Expected delta
- $0/yr ($0/mo · 0.0%)
ⓘ Screening estimate from a state-policy table — verify with the county assessor before closing.
Climate risk First Street
- Flood 10/10 Extreme FEMA zone AE · 99% chance over 30 yrs
- Wildfire 5/10 Major
- Heat 10/10 Extreme 7 d/yr ≥109°F today · 26 d/yr by 30 yrs out
- Wind 9/10 Extreme 99% chance of damaging wind over 30 yrs
- Air quality 1/10 Low 0 unhealthy d/yr today · 0 by 30 yrs out
Nearby sold comps map
Loading sold comps map…
Walkable amenities ~0.75 mi
Loading nearby amenities…
Taxation est. · year 1
- Rental income
- $33,920
- − Mortgage interest
- −$10,587
- − Property taxes
- −$3,736
- − Insurance
- −$6,064
- − Repairs & maintenance
- −$2,714
- − Management
- −$2,714
- − Depreciation
- −$5,498
- Taxable income
- $2,608
- Est. tax owed @ 24.0%
- −$626
- After-tax cash flow
- $4,478/yr
For passive investors: Depreciation is non-cash, so a rental often shows a tax loss while cash-flowing — sheltering income. Rental losses are passive: they offset passive income freely, and up to $25,000/yr can offset ordinary (W-2) income if you actively participate and your MAGI is under $100k (phasing out to $0 by $150k); unused losses carry forward. On sale, claimed depreciation is recaptured at up to 25%, and gains may owe capital-gains tax (a 1031 exchange can defer both). Figures are a year-1 estimate at your 24.0% rate — not tax advice; consult a CPA.
Schools (NCES district)
- District
- Citrus
- NCES district ID
- 1200270
- Math proficiency
- 49% ▼ -10.00%
- Reading proficiency
- 50% ▼ -6.00%
- Median HH income
- $38,618
- Composite
- 41.28/100
- National rank
- #3519
- State rank
- #44 of 73 in FL
Livability — Crystal River
- Score
- 66/100
- State rank
- #603
- US rank
- #11564
Category grades
Schools grade is shown separately in the Schools card above.
Census & demographics
- Census place
- Crystal River, FL
- City population
- 10,163
- Population (ZIP)
- 9,494
Population outlook (Citrus County) Hauer SSP2
- Today (2025)
- 138,622 people
- By 2030
- 136,886 · -1.3%
- By 2040
- 132,009 · -4.8%
- By 2050
- 125,196 · -9.7%
- By 2075
- 108,570 · -21.7%
- By 2100
- 84,454 · -39.1%
Race, ethnicity, and origin ACS 2023
- Neighborhood character
- Predominantly White (88%)
- Race & ethnicity
- White 88% Black 5% Hispanic / Latino 4% Two or more races 3%
- Common ancestry
- Italian 7% Slovak 2% Lithuanian 2%
- Foreign-born
- 4% · Canada
- Languages at home
- 97% English-only · Spanish 1% Tagalog/Filipino 1%
Political lean MEDSL · Citrus
- 2024 margin
- Solid R (+45.9) · D 26.8% · R 72.6%
- 2008→2024 swing
- -29.8pp toward R · 2008: -16.1pp · 2024: -45.9pp
- All cycles
- 2024: R+45.9 2020: R+41.0 2016: R+39.7 2012: R+21.9 2008: R+16.1
Not yet ingested
- Civics
- —
Market trends
- HPI YoY
- ▼ -58.92%
- Current HPI
- 271.3171
- Rent YoY
- —
- Metro
- —
- State GDP YoY
- ▲ 3.28%
- F500 in state
- 36
Industry mix (Fortune 500 HQ in FL)
| Industry | F500 HQs | Revenue |
|---|---|---|
| Industrial Technology | 2 | $29B |
|
||
| Insurance | 2 | $17B |
|
||
| Retail | 1 | $60B |
|
||
| Technology Distribution | 1 | $58B |
|
||
| Homebuilding | 1 | $35B |
|
||
| Technology Manufacturing | 1 | $35B |
|
||
Price history
+320.0% since first listed21 events — show timeline
- 2026-05-19 Price Changed $189,000 RACC
- 2026-04-07 Price Changed $199,000 RACC
- 2026-01-27 Price Changed $219,900 RACC
- 2026-01-07 Relisted — RACC
- 2025-11-04 Delisted — RACC
- 2025-09-23 Listed $249,900 RACC
- 2022-11-30 Rental Removed — STELLARMLS
- 2022-11-14 Price Changed $279,000 Stellar MLS as Distributed by MLS Grid
- 2022-10-27 Price Changed $289,800 Stellar MLS as Distributed by MLS Grid
- 2022-10-19 Listed $299,800 Stellar MLS as Distributed by MLS Grid
- 2022-03-09 Sold (MLS) $157,100 Stellar MLS as Distributed by MLS Grid
- 2022-01-20 Pending — Stellar MLS as Distributed by MLS Grid
- 2022-01-10 Listed $135,000 Stellar MLS as Distributed by MLS Grid
- 2018-02-22 Sold (Public Records) $114,900 Public Records
- 2018-02-13 Sold (MLS) $114,900 RACC
- 2017-08-29 Listed $114,900 RACC
- 2005-03-16 Sold (Public Records) $115,000 Public Records
- 2005-03-11 Sold (MLS) $115,000 RACC
- 2004-11-03 Listed $119,900 RACC
- 2004-09-16 Sold (Public Records) $75,500 Public Records
- 1995-04-21 Sold (Public Records) $45,000 Public Records
Property tax history
+46.0%/yrLatest (2025): $3,736 · -3.1% YoY. Source: county tax records.
Cash-flow waterfall
monthlySold comps — $/sqft
last 12 mo · ≤1 miLoading sold comps…