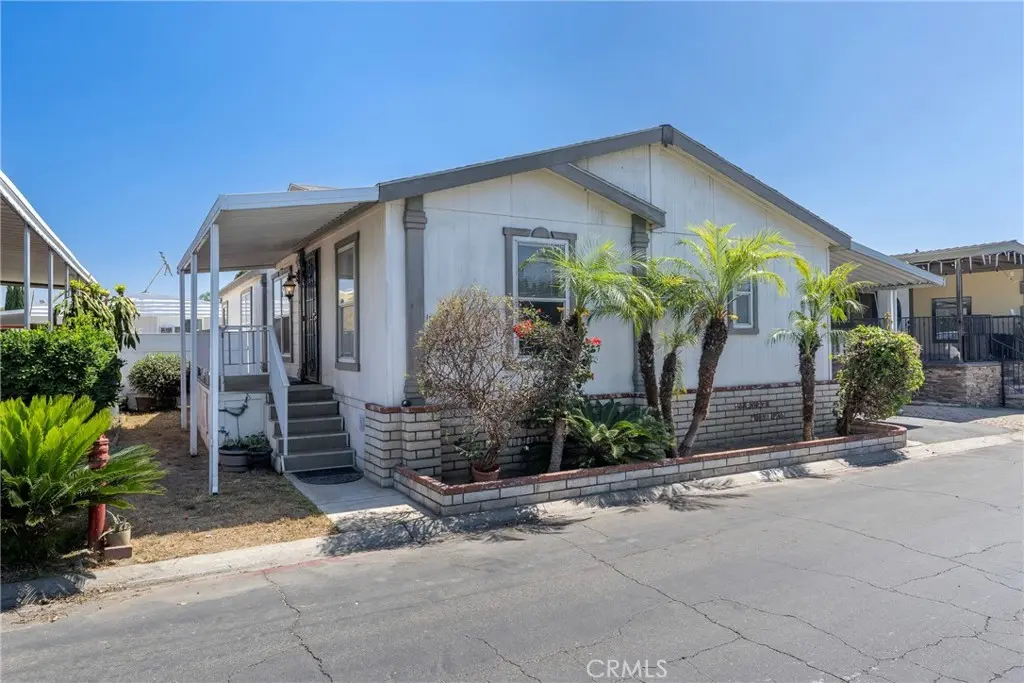
300 N Rampart #197 · Orange, CA
Flood risk 4/10 · Minor
- FEMA flood zone
- X
- Chance of flooding over 30 yrs
- 0.24%
- Est. flood insurance / yr
- $507 – $1,088
Fire risk 1/10 · Minimal
- Est. fire insurance / yr
- $659 – $1,223
Heat risk 5/10 · Moderate
- Hot days now (above 94°F)
- 7 days/yr
- Hot days in 30 yrs
- 22 days/yr
Wind risk 1/10 · Minimal
- Chance of severe wind over 30 yrs
- —
Air-quality risk 6/10 · Moderate
- Unhealthy air days now
- 12 days/yr
- Unhealthy air days in 30 yrs
- 13 days/yr
Risk factors via First Street. Map © Google.
Why this score? — see what drove the B- grade
The composite is a weighted blend of 9 inputs, each scored 0–100. Each bar is that input's sub-score; the figure is the points it added to the 100-point composite (weight × sub-score).
- Cash flow +30.0/30.0
- 1% rule +10.0/10.0
- DSCR +10.0/10.0
- Schools +4.5/10.0
- ARV discount +3.9/15.0
- Livability +3.7/5.0
- Rent growth +3.0/5.0
- Condition / age +2.5/5.0
- Appreciation +0.0/10.0
$235,000
🖨 Deal sheet 📄 Offer letter ✓ Due diligence
Listing remarks
Welcome to Park Royale, one of Orange's most desirable all-age communities! Ideally situated within walking distance of Angel Stadium and just minutes from the Honda Center and the exciting new OCVIBE entertainment district, this spacious home offers comfort, convenience, and an exceptional location. Fresh interior paint and new carpet make this home move-in ready, while vaulted ceilings and abundant natural light create a bright, open atmosphere throughout. The spacious kitchen is designed for both everyday living and entertaining, featuring granite countertops, a center island, abundant cabinetry, and a large pantry for exceptional storage. The adjacent living and dining areas provide ple
Key facts
- New carpet
- Spacious kitchen
- Fresh interior paint
Tags
Property features AI
Finance
- Other: Manager approval required for the park; Pets allowed with breed restrictions
- Financial info: Land lease (monthly): $2,700
- HOA & community: Part of an association with monthly association fees; Park name: Park Royale; Street lighting
Exterior
- Parking: Attached carport (1 space)
- Utilities: Public sewer; District/public water
- Home design: Single-story home; Front door entry; Mobile home (Sunpoint 2001 model, remains on site; approx. 26' x 56')
- Construction: Year built: (source listed as Other); Total stories: 1
- Exterior features: Community pool; Back yard; One shed
Interior
- Kitchen: Kitchen island; Granite counters; Gas range; Dishwasher
- Bedrooms: All bedrooms on main level; Primary suite
- Flooring: Carpet; Laminate
- Bathrooms: Two full bathrooms; Separate tub and shower in master; Double sinks in master bath; Shower
- Heating & cooling: Central heating (furnace); Central cooling
- Interior features: Ceiling fan; Open floor plan; Granite counters
- Laundry & utility: Dedicated laundry room
Neighborhood map
What this means for you Summary
Snapshot
- This is a 3-bed/2.0-bath manufactured listed at $235k.
Deal economics
- At list price, monthly cash flow is $2k ($19k/yr) — positive.
- The deal already cash-flows at list — no discount required.
- Meets the 1% rule at list price ($4k rent vs $235k).
- Cap rate 14.4% vs local median 2.3% in Orange — top-decile yield for the area; either an underpriced asset or a hidden risk that comps aren't pricing in. Stress-test before assuming the spread holds.
Location & tenants
- Location reads 73/100 on livability (#172 in CA) — a middle-class / working-renter tenant base. Strengths: amenities A+, employment A+, crime B; Watch: schools C-, health & safety C-, cost of living F.
- Orange Unified (urban): math 39% / reading 60% proficiency, ranked #127 of 517 in CA (top 25%) — families likely to look elsewhere, expect single-tenant / working-renter base with shorter leases.
- Market conditions: Rents rising (+1.9%/yr); 36 active listings in the ZIP; 40 comparable units currently listed for rent nearby; rentals leasing fast (median 2d on market — plan ~1-2 weeks tenant-placement turnaround); solid renter incomes; 6,974 units permitted in Orange County in 2024 (3,839 in 5+ unit buildings).
- At $4,075/mo this rent would consume 50% of the median local household income ($98k/yr) (locally 1763% of renters already pay >50% of income on rent) — very limited rent-growth headroom before tenants either downsize or default.
Forward outlook
- Local home prices are declining (-3.0%/yr); year-one equity from $2k of loan paydown is wiped out by about $7k of value loss. Plan a longer hold.
- Orange County population projected at +14% by 2050 — modest demand growth; plan on rents tracking national, not racing it.
- At projected returns (-3.0% appreciation + 1.9% rent growth), your $66k cash investment doubles in ~5 years — after that, you're playing with house money.
Negotiation context
- Only 14 days on market — expect competitive offers; lowballing is unlikely to land.
Risks & watch-outs
- Climate carrying-cost: extreme-heat days projected 7→22/yr by 2055 (HVAC capex compounding) — expect insurance premiums to compound above CPI over the hold.
Questions for the listing agent
- Is there a deadline driving the sale (1031 exchange, divorce, estate, relocation)? That informs how much negotiation room exists.
- What's the average days-on-market for RENTAL listings here right now (not sales)? A rising rental-DOM trend means longer vacancies and softer asking-rent achievability than the comps imply.
- What's the recent tenant-quality profile in this submarket — average credit score on applications, eviction rate, late-payment / NSF rate, and stable-employment percentage? A property-management company in the area should have these aggregated.
- How much new for-sale + rental construction is in the pipeline within 1–3 miles? Heavy new supply typically softens prices + rents 12–24 months out; constrained supply supports both.
Investment metrics
- 1% rule
- 1.73% ✓
- Cap rate
- 14.44%
- Cash-on-cash
- 29.09%
- DSCR
- 2.29
- GRM
- 4.8
CMA / ARV
- ARV (on-the-fly)
- $217,500
- Comps found
- 12
Show comp detail 12 sales within ~0.75 mi
| Address | Dist | Beds/Ba | Sqft | Sold | Price | $/sf | Match |
|---|---|---|---|---|---|---|---|
| 300 N Rampart St #125 | 0.00mi | 4/2.0 (+1) | 1,534 (+2%) | 9mo | $170,000 | $111 | 84 |
| 300 N Rampart St #113 | 0.00mi | 3/2.5 | 1,440 (-4%) | 9mo | $260,000 | $181 | 84 |
| 300 Rampart #194 | 0.00mi | 3/2.0 | 1,600 (+7%) | 7mo | $215,000 | $134 | 83 |
| 300 N Rampart St #62 | 0.00mi | 2/2.0 (-1) | 1,560 (+4%) | 9mo | $110,000 | $71 | 81 |
| 300 N Rampart St #37 | 0.00mi | 2/2.0 (-1) | 1,440 (-4%) | 10mo | $212,000 | $147 | 80 |
| 300 N Rampart St #76 | 0.00mi | 3/2.0 | 1,400 (-7%) | 11mo | $131,000 | $94 | 80 |
| 300 N Rampart St #198 | 0.00mi | 2/2.0 (-1) | 1,440 (-4%) | 14mo | $66,000 | $46 | 77 |
| 300 N Rampart St #174 | 0.00mi | 3/2.0 | 1,344 (-10%) | 8mo | $249,900 | $186 | 76 |
| 2300 S Lewis St #143 | 0.62mi | 4/2.0 (+1) | 1,573 (+5%) | 0mo | $229,500 | $146 | 58 |
| 2300 S Lewis St #72 | 0.62mi | 3/2.0 | 1,340 (-11%) | 14mo | $270,000 | $201 | 41 |
| 2300 S Lewis St #20 | 0.62mi | 2/2.0 (-1) | 1,368 (-9%) | 15mo | $65,000 | $48 | 39 |
| 2300 Lewis St #183 | 0.62mi | 2/2.0 (-1) | 1,344 (-10%) | 14mo | $195,000 | $145 | 37 |
Match score weights: distance 35% · size 25% · config 20% · recency 20%. Top-matched comps best support the ARV.
Projected returns pro-forma
-3.0% appreciation · 1.89% rent growth · sell at horizon
- IRR
- 22.2%
- Equity multiple
- 1.90×
- Total profit
- $59,072
- Equity at exit
- $35,039
- IRR
- 29.5%
- Equity multiple
- 3.50×
- Total profit
- $164,441
- Equity at exit
- $20,319
Cash invested: $65,800 (down + closing). Projections, not guarantees.
Landlord ↔ Tenant lean methodology
- Overall (STATE)
- 18 Strongly Tenant-Friendly
- State California
- 18 Strongly Tenant-Friendly · D+13
- County
- — inherits STATE
- City
- — inherits STATE
ZIP-level market 92868
- Rents YoY
- 1.9%
- Active inventory
- 36
- Price-to-rent
- 4.8×
Monthly cashflow live
- Estimated rent
- $4,075 high interval (Pro) →
- Mortgage (P&I)
- −$1,232
- Tax est. 1.5%
- −$294 /mo · $3,525/yr
- Insurance
- −$98
- HOA
- −$0
- Vacancy / Maint / Mgmt
- −$856
- Net cashflow
- $1,595
Break-even live
UW: 25.0% down · 7.5% · 30yr · 1.5% tax · 5.0% vac · 8.0% maint · 8.0% mgmt
Financing live
Cash to close
- Down payment
- $58,750
- Closing costs
- $7,050
- Reserves months
- —
- Total cash needed
- —
Loan-product check · same deal, 3 products live
Conventional
25% down · 7.5% · 30yr
- Down + closing
- —
- Monthly P&I
- —
- Monthly cashflow
- —
- DSCR
- —
- Eligible?
- —
Personal DTI + credit; lowest rate.
DSCR
20% down · 8.5% · 30yr
- Down + closing
- —
- Monthly P&I
- —
- Monthly cashflow
- —
- DSCR
- —
- Eligible?
- —
No personal income docs; deal must DSCR.
Hard money
10% down · 12.0% · 12mo
- Down + closing
- —
- Monthly P&I
- —
- Monthly cashflow
- —
- DSCR
- —
- Eligible?
- —
Short-term bridge; refi at stabilization.
Rent comps 40 comps
| Address | Beds | Baths | Sqft | Rent | $/sqft | DOM | Units | Dist |
|---|---|---|---|---|---|---|---|---|
| 3063 W Chapman Ave Orange, CA | 1.0–2.0 | 1.0–2.0 | 869 | $3,247 | $3.73 | 1d | 30 | 0.18mi |
| 299 N State College Blvd Orange, CA | 2.0 | 1.0–2.0 | 1006 | $4,805 | $4.78 | 1d | 75 | 0.23mi |
| 2324 W Palm Ave Orange, CA | 4.0 | 2.0 | 1480 | $5,200 | $3.51 | 7d | 1 | 0.43mi |
| 938 E Weaver Ln Anaheim, CA | 3.0 | 3.0 | 1576 | $3,995 | $2.53 | 1d | 1 | 0.48mi |
| 385 S Manchester Ave Orange, CA | 2.0 | 1.0–2.0 | 903 | $4,346 | $4.81 | 2d | 26 | 0.55mi |
| 1912 S Jacaranda St Anaheim, CA | 3.0 | 1.0–2.0 | 993 | $4,731 | $4.76 | 1d | 21 | 0.56mi |
| 1910 S Union St Anaheim, CA | 2.0 | 1.0–2.0 | 1135 | $3,773 | $3.32 | 1d | 20 | 0.60mi |
| 1921 S Union St Anaheim, CA | 3.0 | 1.0–2.0 | 962 | $4,392 | $4.57 | 1d | 19 | 0.65mi |
| 1893 S Union St #120 Anaheim, CA | 3.0 | 2.0 | 1700 | $3,950 | $2.32 | 20d | 1 | 0.73mi |
| 1891 S Union St #111 Anaheim, CA | 2.0 | 2.0 | 1599 | $3,900 | $2.44 | 1d | 1 | 0.74mi |
| 1818 S State College Blvd Anaheim, CA | 1.0–2.0 | 1.0–2.0 | 1033 | $3,280 | $3.17 | 1d | 14 | 0.75mi |
| 1730 Anaheim, CA | 4.0 | 3.5 | 2102 | $5,500 | $2.62 | 1d | 1 | 0.75mi |
| 200 City Blvd W Orange, CA | 2.0 | 1.0–2.0 | 897 | $3,263 | $3.64 | 1d | 12 | 0.76mi |
| 2100 E Katella Ave Anaheim, CA | 1.0–2.0 | 2.0 | 1190 | $3,350 | $2.81 | 1d | 7 | 0.77mi |
| 2000 W Palmyra Ave Orange, CA | 3.0 | 2.5 | 1387 | $3,599 | $2.59 | 10d | 1 | 0.86mi |
| 1801 E Katella Ave Anaheim, CA | 1.0–2.0 | 1.0–2.0 | 919 | $3,075 | $3.34 | 10d | 5 | 0.90mi |
| 1801 E Katella Ave Anaheim, CA | 1.0–2.0 | 1.0–2.0 | 911 | $3,075 | $3.37 | 24d | 4 | 0.90mi |
| 1801 E Katella Ave Anaheim, CA | 1.0–2.0 | 1.0–2.0 | 911 | $3,075 | $3.37 | 1d | 4 | 0.90mi |
| 1801 E Katella Ave Anaheim, CA | 1.0–2.0 | 1.0–2.0 | 911 | $3,075 | $3.37 | 21d | 6 | 0.90mi |
| 1815 S Westside Dr Anaheim, CA | 2.0 | 1.0–2.5 | 1033 | $3,995 | $3.87 | 1d | 27 | 0.91mi |
| 1910 W Palmyra Ave #92 Orange, CA | 3.0 | 1.5 | 1358 | $3,400 | $2.50 | 12d | 1 | 0.94mi |
| 13392 Dawn Ave Garden Grove, CA | 3.0 | 2.0 | 1628 | $3,795 | $2.33 | 2d | 1 | 0.94mi |
| 1721 W Palmyra Ave Orange, CA | 4.0 | 2.0 | 1810 | $4,000 | $2.21 | 20d | 1 | 0.95mi |
| 1781 S Campton Ave Anaheim, CA | 1.0–3.0 | 1.0–2.0 | 1071 | $3,999 | $3.73 | 1d | 7 | 0.96mi |
| 1725 S Auburn Way Anaheim, CA | 2.0 | 1.0–2.0 | 821 | $3,150 | $3.83 | 1d | 14 | 1.02mi |
| 331 E Bluebell Pl Anaheim, CA | 4.0 | 2.0 | 2000 | $6,500 | $3.25 | 1d | 1 | 1.02mi |
| 1118 W Orange Rd Santa Ana, CA | 4.0 | 3.0 | 2203 | $6,000 | $2.72 | 12d | 1 | 1.08mi |
| 977 E Mason Ln #116 Anaheim, CA | 3.0 | 2.5 | 1967 | $4,300 | $2.19 | 15d | 1 | 1.10mi |
| 987 E Mason Ln #129 Anaheim, CA | 3.0 | 2.5 | 1967 | $4,500 | $2.29 | 17d | 1 | 1.12mi |
| 331 E Wakefield Ave Anaheim, CA | 3.0 | 2.0 | 1134 | $3,200 | $2.82 | 16d | 1 | 1.13mi |
| 331 E Wakefield Ave Anaheim, CA | 4.0 | 2.0 | 1344 | $3,500 | $2.60 | 1d | 1 | 1.13mi |
| 1690 S Lewis St Anaheim, CA | 3.0 | 2.5 | 1772 | $12,000 | $6.77 | 1d | 1 | 1.18mi |
| 1676 S Lewis St Anaheim, CA | 3.0 | 2.5 | 1821 | $5,200 | $2.86 | 1d | 1 | 1.19mi |
| 3825 W Garden Grove Blvd Orange, CA | 1.0–3.0 | 1.0–2.5 | 1112 | $2,845 | $2.56 | 2d | 3 | 1.22mi |
| 526 N Emerald Dr Orange, CA | 4.0 | 2.0 | 1527 | $5,350 | $3.50 | 4d | 1 | 1.23mi |
| 417 N Citrus St Orange, CA | 4.0 | 2.0 | 1400 | $5,000 | $3.57 | 2d | 1 | 1.29mi |
| 923 W Maple Ave Orange, CA | 4.0 | 2.0 | 1281 | $6,000 | $4.68 | 43d | 1 | 1.31mi |
| 2624 N Towner St Santa Ana, CA | 3.0 | 2.0 | 1406 | $4,900 | $3.49 | 19d | 1 | 1.35mi |
| 2045 S Haster St Anaheim, CA | 2.0 | 1.0–1.5 | 1035 | $3,048 | $2.94 | 1d | 3 | 1.35mi |
| 126 S Batavia St Orange, CA | 3.0 | 2.0 | 1200 | $3,695 | $3.08 | 3d | 1 | 1.36mi |
Listing history 10 events
-
2026-06-18days on market $235,000 Active 14 DOM
-
2026-06-17days on market $235,000 Active 13 DOM
-
2026-06-16days on market $235,000 Active 12 DOM
-
2026-06-15days on market $235,000 Active 11 DOM
-
2026-06-13days on market $235,000 Active 9 DOM
-
2026-06-13days on market $235,000 Active 8 DOM
-
2026-06-09days on market $235,000 Active 5 DOM
-
2026-06-08days on market $235,000 Active 4 DOM
-
2026-06-07remarks 699-char remark
-
2026-06-07$235,000 Active 3 DOM
ⓘ Source: listings_history table (triggers on properties + properties_extension) + one-shot
backfill from property_details.listing_events for pre-trigger history.
Climate risk First Street
- Flood 4/10 Moderate FEMA zone X · 24% chance over 30 yrs
- Wildfire 1/10 Low
- Heat 5/10 Major 7 d/yr ≥94°F today · 22 d/yr by 30 yrs out
- Wind 1/10 Low
- Air quality 6/10 Major 12 unhealthy d/yr today · 13 by 30 yrs out
Nearby sold comps map
Loading sold comps map…
Walkable amenities ~0.75 mi
Loading nearby amenities…
Taxation est. · year 1
- Rental income
- $48,898
- − Mortgage interest
- −$13,164
- − Property taxes
- −$3,525
- − Insurance
- −$1,175
- − Repairs & maintenance
- −$3,912
- − Management
- −$3,912
- − Depreciation
- −$6,836
- Taxable income
- $16,374
- Est. tax owed @ 24.0%
- −$3,930
- After-tax cash flow
- $15,211/yr
For passive investors: Depreciation is non-cash, so a rental often shows a tax loss while cash-flowing — sheltering income. Rental losses are passive: they offset passive income freely, and up to $25,000/yr can offset ordinary (W-2) income if you actively participate and your MAGI is under $100k (phasing out to $0 by $150k); unused losses carry forward. On sale, claimed depreciation is recaptured at up to 25%, and gains may owe capital-gains tax (a 1031 exchange can defer both). Figures are a year-1 estimate at your 24.0% rate — not tax advice; consult a CPA.
Schools (NCES district)
- District
- Orange Unified
- NCES district ID
- 0628650
- Math proficiency
- 39% ▼ -6.00%
- Reading proficiency
- 60% ▲ 3.00%
- Median HH income
- $83,557
- Composite
- 45.5/100
- National rank
- #2609
- State rank
- #127 of 517 in CA
Livability — Orange
- Score
- 73/100
- State rank
- #172
- US rank
- #5560
Category grades
Schools grade is shown separately in the Schools card above.
Census & demographics
- Census place
- Orange, CA
- County
- Orange County · 3,096,323 people
- City population
- 143,297
- Metro
- Los Angeles-Long Beach-Anaheim, CA
- Population (ZIP)
- 26,380
- Household income
- $97,500
- Rent vs Own
- Severe rent burden
- 1763.0
Population outlook (Orange County) Hauer SSP2
- Today (2025)
- 3,477,456 people
- By 2030
- 3,613,117 · +3.9%
- By 2040
- 3,835,945 · +10.3%
- By 2050
- 3,968,736 · +14.1%
- By 2075
- 4,097,053 · +17.8%
- By 2100
- 3,903,633 · +12.3%
Race, ethnicity, and origin ACS 2023
- Neighborhood character
- Diverse neighborhood (Simpson 0.65)
- Race & ethnicity
- Hispanic / Latino 51% White 25% Asian 16% Two or more races 15% Black 3% Native American 2%
- Hispanic origin (detail)
- Mexican 44%
- Common ancestry
- Italian 2% Portuguese 1% Romanian 1%
- Foreign-born
- 25% · Canada, Vietnam, South Korea
- Languages at home
- 53% English-only · Spanish 32% Vietnamese 4% Tagalog/Filipino 3%
Political lean MEDSL · Orange
- 2024 margin
- Toss-up / Even · D 49.7% · R 47.1% · Other 3.2%
- 2008→2024 swing
- +5.2pp toward D · 2008: -2.6pp · 2024: 2.6pp
- All cycles
- 2024: D+2.6 2020: D+9.0 2016: D+7.7 2012: R+8.3 2008: R+2.6
Not yet ingested
- Civics
- —
Market trends
- HPI YoY
- ▼ -537.48%
- Current HPI
- 489.0285
- Rent YoY
- ▲ 1.89%
- Metro
- Los Angeles-Long Beach-Anaheim, CA
- State GDP YoY
- ▲ 3.21%
- F500 in state
- 116
Industry mix (Fortune 500 HQ in CA)
| Industry | F500 HQs | Revenue |
|---|---|---|
| Technology | 27 | $1,492B |
|
||
| Financial Services | 3 | $174B |
|
||
| Retail | 3 | $44B |
|
||
| Insurance | 3 | $26B |
|
||
| Media / Entertainment | 2 | $115B |
|
||
| Pharmaceuticals / Biotech | 2 | $62B |
|
||
Price history
1 event — show timeline
- 2026-06-04 Listed $235,000 CRMLS
Property tax history
-3.9%/yrLatest (2025): $296 · +0.2% YoY. Source: county tax records.
Cash-flow waterfall
monthlySold comps — $/sqft
last 12 mo · ≤1 miLoading sold comps…