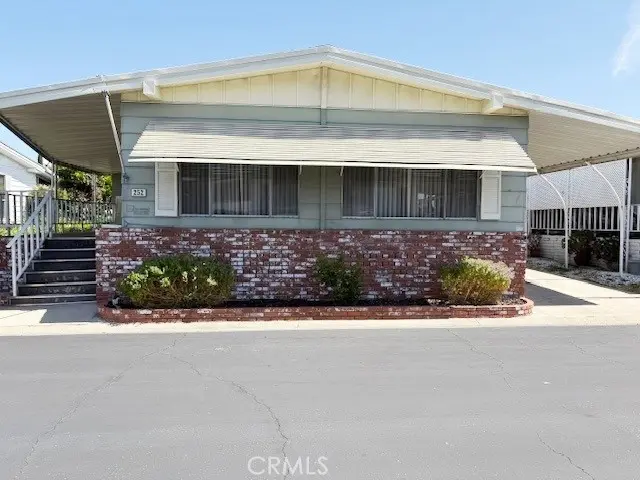
24701 Raymond Way #252 · Lake Forest, CA
Flood risk 1/10 · Minimal
- FEMA flood zone
- X (unshaded)
- Chance of flooding over 30 yrs
- 0.0%
- Est. flood insurance / yr
- $507 – $1,088
Fire risk 1/10 · Minimal
- Est. fire insurance / yr
- $659 – $1,223
Heat risk 5/10 · Moderate
- Hot days now (above 91°F)
- 7 days/yr
- Hot days in 30 yrs
- 23 days/yr
Wind risk 1/10 · Minimal
- Chance of severe wind over 30 yrs
- —
Air-quality risk 4/10 · Minor
- Unhealthy air days now
- 4 days/yr
- Unhealthy air days in 30 yrs
- 5 days/yr
Risk factors via First Street. Map © Google.
Why this score? — see what drove the B grade
The composite is a weighted blend of 9 inputs, each scored 0–100. Each bar is that input's sub-score; the figure is the points it added to the 100-point composite (weight × sub-score).
- Cash flow +30.0/30.0
- 1% rule +10.0/10.0
- DSCR +10.0/10.0
- ARV discount +5.8/15.0
- Schools +5.6/10.0
- Livability +3.2/5.0
- Rent growth +3.1/5.0
- Condition / age +2.5/5.0
- Appreciation +0.0/10.0
$235,000
🖨 Deal sheet 📄 Offer letter ✓ Due diligence
Listing remarks MLS
55+ Park. Triple Wide. .. On the Boardwalk! Nice open floor plan w/ custom features. Great 2 Bedroom, 2 Bath. Entertain in huge familyroom with wetbar & built-in bookcases. Sunkissed living room. Lovely dining room with built-in china cabinet! Circular eat-in kitcen w/ lots of storage. Private master suite w/ sunken tub + shower; large walk-in closet! Relax on lovely porch. Nice, easy to maintain landscaping. 2 storage sheds. Central A/C. This is one of the largest homes in the park. .. call now to see!!
Key facts
- Circular kitchen
- Newer dishwasher
- Cooktop
Tags
Property features AI
Finance
- HOA & community: Senior community; Street lighting; Land lease in place ($1,300 monthly)
Exterior
- Parking: Located in Prothero park
- Utilities: Public sewer; District/public water
- Home design: Single-story mobile home; Entry on level 1; Mobile home remains on site; Mobile dimensions approximately 24' x 61'; Facing/directions: Cross Streets: El Toro Road
- Construction: Seller-provided year built; Double wide body type
- Exterior features: Shed; Front yard; Association pool
Interior
- Kitchen: Kitchen
- Bedrooms: Primary bedroom (main level)
- Bathrooms: 2 full bathrooms
- Heating & cooling: Has cooling (details: see remarks)
- Interior features: Ceiling fan
- Laundry & utility: Inside laundry with washer and dryer included
Neighborhood map
What this means for you Summary
Snapshot
- This is a 2-bed/2.0-bath manufactured listed at $235k.
Deal economics
- At list price, monthly cash flow is $1k ($15k/yr) — positive.
- The deal already cash-flows at list — no discount required.
- Meets the 1% rule at list price ($4k rent vs $235k).
- Recommended offer: $228k (3.0% below list) — sets the bar for market timing.
- Cap rate 12.7% vs local median 2.1% in Lake Forest — top-decile yield for the area; either an underpriced asset or a hidden risk that comps aren't pricing in. Stress-test before assuming the spread holds.
Location & tenants
- Location reads 65/100 on livability (#387 in CA) — a middle-class / working-renter tenant base. Strengths: crime A+, employment A+, housing B; Watch: commute C-, amenities F, cost of living F.
- Saddleback Valley Unified (suburban): math 51% / reading 73% proficiency, ranked #67 of 517 in CA (top 13%) — acceptable for families but not a draw, mixed tenant base, ~2y average lease.
- Market conditions: Rents rising (+2.5%/yr); 205 active listings in the ZIP; 25 comparable units currently listed for rent nearby; rentals at typical pace (median 25d on market — plan ~3-4 weeks tenant-placement turnaround); 40% of comp listings sitting > 30 days — soft ceiling on asking rent; high-income renter base; 6,974 units permitted in Orange County in 2024 (3,839 in 5+ unit buildings).
- This rent runs 35% of the median local income ($126k/yr) — at the standard rent-burdened threshold; future hikes will face affordability resistance.
Forward outlook
- Local home prices are declining (-3.0%/yr); year-one equity from $2k of loan paydown is wiped out by about $7k of value loss. Plan a longer hold.
- Orange County population projected at +14% by 2050 — modest demand growth; plan on rents tracking national, not racing it.
- At projected returns (-3.0% appreciation + 2.5% rent growth), your $66k cash investment doubles in ~6 years — after that, you're playing with house money.
Negotiation context
- It's been on market 35 days — a 3% lower offer ($228k) is reasonable based on typical stale-listing flexibility.
- 5 sale attempts since 24y ago with the ask held roughly flat each time — persistent listings suggest the price (not the market) is what's stuck; bring a comps-based counter.
- Current owner paid $102k; list at $235k implies a 130% gain — meaningful room to come down on a strong offer.
Risks & watch-outs
- Climate carrying-cost: extreme-heat days projected 7→23/yr by 2055 (HVAC capex compounding) — expect insurance premiums to compound above CPI over the hold.
Questions for the listing agent
- It's been on market 35 days. Have you received any prior offers? Is the seller open to a 3% concession, seller financing, or rate buy-down credit?
- Built in 1977 — when were the roof, HVAC, electrical panel, plumbing, and water heater last replaced?
- Is there a deadline driving the sale (1031 exchange, divorce, estate, relocation)? That informs how much negotiation room exists.
- Schools are B-rated — typically a magnet for longer-tenancy family renters. What's the average tenant stay here, and is there a school-zone premium baked into asking?
- What's the average days-on-market for RENTAL listings here right now (not sales)? A rising rental-DOM trend means longer vacancies and softer asking-rent achievability than the comps imply.
- What's the recent tenant-quality profile in this submarket — average credit score on applications, eviction rate, late-payment / NSF rate, and stable-employment percentage? A property-management company in the area should have these aggregated.
- How much new for-sale + rental construction is in the pipeline within 1–3 miles? Heavy new supply typically softens prices + rents 12–24 months out; constrained supply supports both.
Investment metrics
- 1% rule
- 1.55% ✓
- Cap rate
- 12.71%
- Cash-on-cash
- 22.93%
- DSCR
- 2.02
- GRM
- 5.4
CMA / ARV
- ARV (median comp)
- $226,598
- List price
- $235,000
- Delta
- 3.71%
- Verdict
- FAIR
- Comps
- 20 within 1.0 mi
Show comp detail 12 sales within ~0.75 mi
| Address | Dist | Beds/Ba | Sqft | Sold | Price | $/sf | Match |
|---|---|---|---|---|---|---|---|
| 24701 Raymond Way #230 | 0.00mi | 2/2.0 | 1,680 (-6%) | 7mo | $230,000 | $137 | 84 |
| 24701 Raymond Way #195 | 0.15mi | 2/2.0 | 1,760 (-1%) | 12mo | $247,500 | $141 | 81 |
| 24701 Raymond Way #170 | 0.15mi | 2/2.0 | 1,728 (-3%) | 9mo | $230,000 | $133 | 80 |
| 24701 Raymond Way #34 | 0.00mi | 2/2.0 | 1,656 (-7%) | 10mo | $210,000 | $127 | 80 |
| 24701 Raymond Way #74 | 0.33mi | 3/2.0 (+1) | 1,776 (-0%) | 2mo | $319,000 | $180 | 78 |
| 24701 Raymond Ave #120 | 0.15mi | 3/2.0 (+1) | 1,608 (-10%) | 2mo | $375,000 | $233 | 70 |
| 24921 Muirlands Blvd #98 | 0.54mi | 2/2.0 | 1,776 (-0%) | 10mo | $200,000 | $113 | 65 |
| 24701 Raymond Way #98 | 0.33mi | 3/2.0 (+1) | 1,858 (+4%) | 11mo | $255,000 | $137 | 64 |
| 24701 Raymond Way #81 | 0.32mi | 3/2.0 (+1) | 1,660 (-7%) | 6mo | $333,000 | $201 | 63 |
| 24921 Muirlands blvd #78 | 0.50mi | 2/2.0 | 1,570 (-12%) | 3mo | $224,000 | $143 | 55 |
| 24921 Muirlands Blvd #188 | 0.45mi | 2/2.0 | 1,600 (-10%) | 13mo | $299,000 | $187 | 51 |
| 24921 Muirlands Blvd #240 | 0.61mi | 2/2.0 | 1,944 (+9%) | 10mo | $189,000 | $97 | 48 |
Match score weights: distance 35% · size 25% · config 20% · recency 20%. Top-matched comps best support the ARV.
Projected returns pro-forma
-3.0% appreciation · 2.51% rent growth · sell at horizon
- IRR
- 15.3%
- Equity multiple
- 1.61×
- Total profit
- $40,249
- Equity at exit
- $35,039
- IRR
- 23.6%
- Equity multiple
- 2.99×
- Total profit
- $131,095
- Equity at exit
- $20,319
Cash invested: $65,800 (down + closing). Projections, not guarantees.
Landlord ↔ Tenant lean methodology
- Overall (STATE)
- 18 Strongly Tenant-Friendly
- State California
- 18 Strongly Tenant-Friendly · D+13
- County
- — inherits STATE
- City
- — inherits STATE
ZIP-level market 92630
- Rents YoY
- 2.5%
- Active inventory
- 205
- Price-to-rent
- 5.4×
Monthly cashflow live
- Estimated rent
- $3,647 high interval (Pro) →
- Mortgage (P&I)
- −$1,232
- Tax est. 1.5%
- −$294 /mo · $3,525/yr
- Insurance
- −$98
- HOA
- −$0
- Vacancy / Maint / Mgmt
- −$766
- Net cashflow
- $1,257
Break-even live
UW: 25.0% down · 7.5% · 30yr · 1.5% tax · 5.0% vac · 8.0% maint · 8.0% mgmt
Financing live
Cash to close
- Down payment
- $58,750
- Closing costs
- $7,050
- Reserves months
- —
- Total cash needed
- —
Loan-product check · same deal, 3 products live
Conventional
25% down · 7.5% · 30yr
- Down + closing
- —
- Monthly P&I
- —
- Monthly cashflow
- —
- DSCR
- —
- Eligible?
- —
Personal DTI + credit; lowest rate.
DSCR
20% down · 8.5% · 30yr
- Down + closing
- —
- Monthly P&I
- —
- Monthly cashflow
- —
- DSCR
- —
- Eligible?
- —
No personal income docs; deal must DSCR.
Hard money
10% down · 12.0% · 12mo
- Down + closing
- —
- Monthly P&I
- —
- Monthly cashflow
- —
- DSCR
- —
- Eligible?
- —
Short-term bridge; refi at stabilization.
Rent comps 25 comps
| Address | Beds | Baths | Sqft | Rent | $/sqft | DOM | Units | Dist |
|---|---|---|---|---|---|---|---|---|
| 24391 Avenida de la Carlota Laguna Hills, CA | 1.0–2.0 | 1.0–2.0 | 957 | $3,965 | $4.14 | 1d | 18 | 0.57mi |
| 158 Avenida Majorca Unit D Laguna Woods, CA | 2.0 | 1.0 | 1300 | $3,200 | $2.46 | 44d | 1 | 0.84mi |
| 24299 Paseo De Valencia Laguna Woods, CA | 2.0 | 2.0 | 1347 | $3,770 | $2.80 | 22d | 7 | 0.89mi |
| 205 Avenida Majorca Unit A Laguna Woods, CA | 2.0 | 2.0 | 1278 | $3,600 | $2.82 | 44d | 1 | 0.91mi |
| 2022 Via Mariposa E Unit B Laguna Woods, CA | 2.0 | 2.0 | 1325 | $3,200 | $2.42 | 19d | 1 | 0.95mi |
| 221 Avenida Majorca Unit D Laguna Woods, CA | 2.0 | 2.0 | 1438 | $3,200 | $2.23 | 24d | 1 | 0.96mi |
| 2022 Via Mariposa E Unit D Laguna Woods, CA | 2.0 | 2.0 | 1305 | $4,000 | $3.07 | 44d | 1 | 0.99mi |
| 2037 Via Mariposa E Laguna Woods, CA | 2.0 | 2.0 | 1325 | $3,300 | $2.49 | 44d | 1 | 1.06mi |
| 2299 Via Puerta Unit F Laguna Woods, CA | 2.0 | 3.0 | 1530 | $3,500 | $2.29 | 19d | 1 | 1.07mi |
| 2369 Via Mariposa E Unit 3H Laguna Woods, CA | 3.0 | 3.0 | 1663 | $3,750 | $2.25 | 44d | 1 | 1.08mi |
| 2369 Via Mariposa E Unit 1B Laguna Woods, CA | 2.0 | 2.0 | 1340 | $2,950 | $2.20 | 44d | 1 | 1.08mi |
| 24621 Overlake Dr Lake Forest, CA | 3.0 | 2.0 | 1677 | $4,350 | $2.59 | 24d | 1 | 1.12mi |
| 22892 Plainview Cir Lake Forest, CA | 3.0 | 2.0 | 1836 | $5,400 | $2.94 | 44d | 1 | 1.13mi |
| 6 Quinn Way Mission Viejo, CA | 3.0 | 3.5 | 1716 | $4,100 | $2.39 | 21d | 1 | 1.13mi |
| 263 Calle Aragon Unit A Laguna Woods, CA | 2.0 | 2.0 | 1275 | $3,800 | $2.98 | 17d | 1 | 1.14mi |
| 62 Aliso Ridge Loop Mission Viejo, CA | 2.0 | 2.5 | 1560 | $3,795 | $2.43 | 24d | 1 | 1.15mi |
| 22835 Islamare Ln Lake Forest, CA | 3.0 | 2.5 | 1860 | $6,600 | $3.55 | 13d | 1 | 1.16mi |
| 2355 Via Mariposa W Unit 3H Laguna Woods, CA | 3.0 | 2.0 | 1662 | $3,500 | $2.11 | 19d | 1 | 1.20mi |
| 2370 Via Mariposa W Unit 3D Laguna Woods, CA | 3.0 | 3.0 | 1663 | $3,300 | $1.98 | 19d | 1 | 1.20mi |
| 480 Calle Cadiz Unit B Laguna Woods, CA | 2.0 | 2.0 | 1324 | $3,100 | $2.34 | 44d | 1 | 1.24mi |
| 23151 Los Alisos Blvd Mission Viejo, CA | 1.0–3.0 | 1.0–2.0 | 1091 | $2,654 | $2.43 | 2d | 1 | 1.31mi |
| 22602 Cottonwood Cir Lake Forest, CA | 3.0 | 2.0 | 1301 | $4,250 | $3.27 | 44d | 1 | 1.32mi |
| 22700 Lake Forest Dr Lake Forest, CA | 1.0–3.0 | 1.0–2.0 | 1008 | $3,248 | $3.22 | 4d | 1 | 1.34mi |
| 23491 Via San Miguel Aliso Viejo, CA | 3.0 | 2.0 | 1240 | $3,850 | $3.10 | 13d | 1 | 1.42mi |
| 23491 Los Adornos Aliso Viejo, CA | 3.0 | 2.0 | 1250 | $3,600 | $2.88 | 44d | 1 | 1.46mi |
Listing history 23 events
-
2026-06-18days on market $235,000 Active 35 DOM
-
2026-06-17days on market $235,000 Active 34 DOM
-
2026-06-16days on market $235,000 Active 33 DOM
-
2026-06-15days on market $235,000 Active 32 DOM
-
2026-06-13days on market $235,000 Active 30 DOM
-
2026-06-13days on market $235,000 Active 29 DOM
-
2026-06-09days on market $235,000 Active 26 DOM
-
2026-06-08days on market $235,000 Active 25 DOM
-
2026-06-07days on market $235,000 Active 24 DOM
-
2026-06-04days on market $235,000 Active 21 DOM
-
2026-06-03days on market $235,000 Active 20 DOM
-
2026-06-02days on market $235,000 Active 19 DOM
-
2026-06-01days on market $235,000 Active 18 DOM
-
2026-05-31days on market $235,000 Active 17 DOM
-
2026-05-14$235,000 Active 802-char remark
-
2005-03-02soldstatus $102,000 515-char remark
Show marketing remark (515 chars)
55+ Park. Triple Wide. .. On the Boardwalk! Nice open floor plan w/ custom features. Great 2 Bedroom, 2 Bath. Entertain in huge familyroom with wetbar & built-in bookcases. Sunkissed living room. Lovely dining room with built-in china cabinet! Circular eat-in kitcen w/ lots of storage. Private master suite w/ sunken tub + shower; large walk-in closet! Relax on lovely porch. Nice, easy to maintain landscaping. 2 storage sheds. Central A/C. This is one of the largest homes in the park. .. call now to see!!
-
2005-01-05$101,250 515-char remark
Show marketing remark (515 chars)
55+ Park. Triple Wide. .. On the Boardwalk! Nice open floor plan w/ custom features. Great 2 Bedroom, 2 Bath. Entertain in huge familyroom with wetbar & built-in bookcases. Sunkissed living room. Lovely dining room with built-in china cabinet! Circular eat-in kitcen w/ lots of storage. Private master suite w/ sunken tub + shower; large walk-in closet! Relax on lovely porch. Nice, easy to maintain landscaping. 2 storage sheds. Central A/C. This is one of the largest homes in the park. .. call now to see!!
-
2004-07-16historical
-
2004-04-23$103,900
-
2002-10-08historical
-
2002-09-11soldstatus $82,500
-
2002-07-17$84,900
-
2002-07-08$84,900
ⓘ Source: listings_history table (triggers on properties + properties_extension) + one-shot
backfill from property_details.listing_events for pre-trigger history.
Climate risk First Street
- Flood 1/10 Low FEMA zone X (unshaded) · 0% chance over 30 yrs
- Wildfire 1/10 Low
- Heat 5/10 Major 7 d/yr ≥91°F today · 23 d/yr by 30 yrs out
- Wind 1/10 Low
- Air quality 4/10 Moderate 4 unhealthy d/yr today · 5 by 30 yrs out
Nearby sold comps map
Loading sold comps map…
Walkable amenities ~0.75 mi
Loading nearby amenities…
Taxation est. · year 1
- Rental income
- $43,764
- − Mortgage interest
- −$13,164
- − Property taxes
- −$3,525
- − Insurance
- −$1,175
- − Repairs & maintenance
- −$3,501
- − Management
- −$3,501
- − Depreciation
- −$6,836
- Taxable income
- $12,061
- Est. tax owed @ 24.0%
- −$2,895
- After-tax cash flow
- $12,190/yr
For passive investors: Depreciation is non-cash, so a rental often shows a tax loss while cash-flowing — sheltering income. Rental losses are passive: they offset passive income freely, and up to $25,000/yr can offset ordinary (W-2) income if you actively participate and your MAGI is under $100k (phasing out to $0 by $150k); unused losses carry forward. On sale, claimed depreciation is recaptured at up to 25%, and gains may owe capital-gains tax (a 1031 exchange can defer both). Figures are a year-1 estimate at your 24.0% rate — not tax advice; consult a CPA.
Schools (NCES district)
- District
- Saddleback Valley Unified
- NCES district ID
- 0633860
- Math proficiency
- 51% ▼ -2.00%
- Reading proficiency
- 73% ▲ 9.00%
- Median HH income
- $85,577
- Composite
- 56.05/100
- National rank
- #1185
- State rank
- #67 of 517 in CA
Livability — Lake Forest
- Score
- 65/100
- State rank
- #387
- US rank
- #13130
Category grades
Schools grade is shown separately in the Schools card above.
Census & demographics
- Census place
- Lake Forest, CA
- County
- Orange County · 3,096,323 people
- City population
- 80,019
- Metro
- Los Angeles-Long Beach-Anaheim, CA
- Population (ZIP)
- 67,152
- Household income
- $125,853
- Rent vs Own
- Severe rent burden
- 2412.0
Population outlook (Orange County) Hauer SSP2
- Today (2025)
- 3,477,456 people
- By 2030
- 3,613,117 · +3.9%
- By 2040
- 3,835,945 · +10.3%
- By 2050
- 3,968,736 · +14.1%
- By 2075
- 4,097,053 · +17.8%
- By 2100
- 3,903,633 · +12.3%
Race, ethnicity, and origin ACS 2023
- Neighborhood character
- Diverse neighborhood (Simpson 0.67)
- Race & ethnicity
- White 47% Hispanic / Latino 27% Asian 19% Two or more races 16% Black 2% Native American 1%
- Hispanic origin (detail)
- Mexican 21%
- Common ancestry
- Slovak 2% Lithuanian 2% Romanian 2%
- Foreign-born
- 28% · Canada, China, Vietnam
- Languages at home
- 62% English-only · Spanish 18% Chinese 4% Other Indo-European 4%
Political lean MEDSL · Orange
- 2024 margin
- Toss-up / Even · D 49.7% · R 47.1% · Other 3.2%
- 2008→2024 swing
- +5.2pp toward D · 2008: -2.6pp · 2024: 2.6pp
- All cycles
- 2024: D+2.6 2020: D+9.0 2016: D+7.7 2012: R+8.3 2008: R+2.6
Not yet ingested
- Civics
- —
Market trends
- HPI YoY
- ▼ -866.99%
- Current HPI
- 436.6189
- Rent YoY
- ▲ 2.51%
- Metro
- Los Angeles-Long Beach-Anaheim, CA
- State GDP YoY
- ▲ 3.21%
- F500 in state
- 116
Industry mix (Fortune 500 HQ in CA)
| Industry | F500 HQs | Revenue |
|---|---|---|
| Technology | 27 | $1,492B |
|
||
| Financial Services | 3 | $174B |
|
||
| Retail | 3 | $44B |
|
||
| Insurance | 3 | $26B |
|
||
| Media / Entertainment | 2 | $115B |
|
||
| Pharmaceuticals / Biotech | 2 | $62B |
|
||
Price history
+176.8% since first listed9 events — show timeline
- 2026-05-14 Listed $235,000 CRMLS
- 2005-03-02 Sold (MLS) $102,000 CRMLS
- 2005-01-05 Listed $101,250 CRMLS
- 2004-07-16 Listing Removed — CRMLS
- 2004-04-23 Listed $103,900 CRMLS
- 2002-10-08 Listing Removed — CRMLS
- 2002-09-11 Sold (MLS) $82,500 CRMLS
- 2002-07-17 Listed $84,900 CRMLS
- 2002-07-08 Listed $84,900 CRMLS
Property tax history
-5.3%/yrLatest (2025): $40 · -0.2% YoY. Source: county tax records.
Cash-flow waterfall
monthlySold comps — $/sqft
last 12 mo · ≤1 miLoading sold comps…