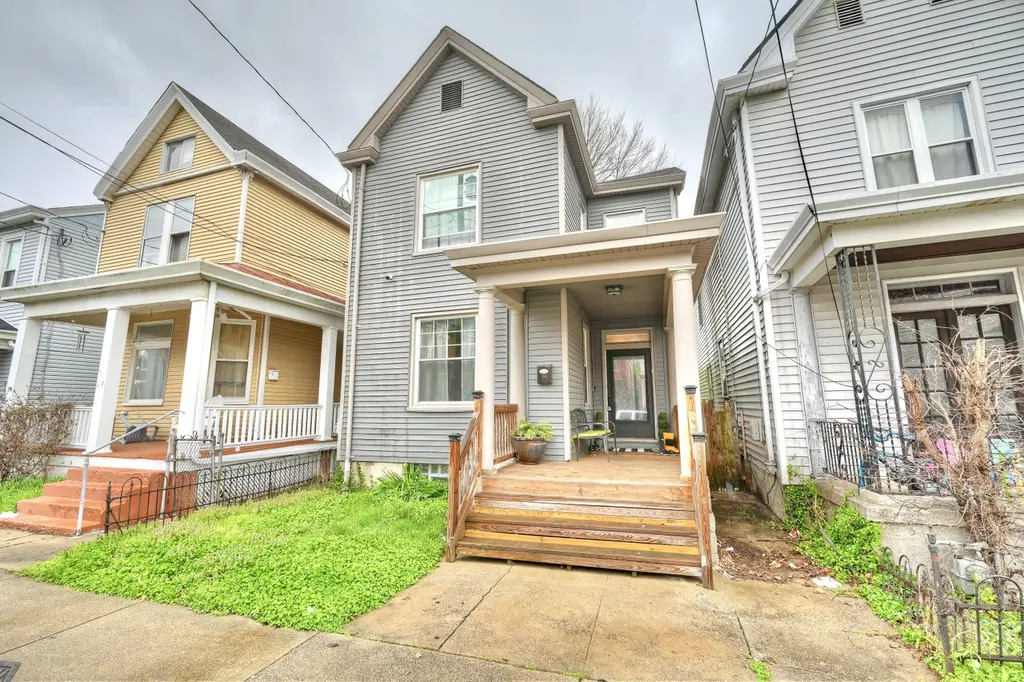
216 E 18th St · Covington, KY
Flood risk No data
- FEMA flood zone
- —
- Chance of flooding over 30 yrs
- —
- Est. flood insurance / yr
- —
Fire risk No data
- Est. fire insurance / yr
- —
Heat risk No data
- Hot days now (above threshold)
- —
- Hot days in 30 yrs
- —
Wind risk No data
- Chance of severe wind over 30 yrs
- —
Air-quality risk No data
- Unhealthy air days now
- —
- Unhealthy air days in 30 yrs
- —
Risk factors via First Street. Map © Google.
Why this score? — see what drove the C grade
The composite is a weighted blend of 9 inputs, each scored 0–100. Each bar is that input's sub-score; the figure is the points it added to the 100-point composite (weight × sub-score).
- Cash flow +19.2/30.0
- ARV discount +13.6/15.0
- DSCR +6.1/10.0
- 1% rule +4.6/10.0
- Livability +4.3/5.0
- Rent growth +3.8/5.0
- Condition / age +2.5/5.0
- Schools +1.5/10.0
- Appreciation +0.0/10.0
$220,000
🖨 Deal sheet 📄 Offer letter ✓ Due diligence
Listing remarks MLS
Sold when entered as For Sale By Owner. Nice 2 story house.
Key facts
- Large basement
- Nice backyard
- Inviting wood porch
Tags
Property features AI
Exterior
- Parking: On-street parking
- Security: Security system
- Utilities: Public water; Public sewer; Cable available; Water available; Sewer available
- Home design: Single family house; Two levels; Residential property; Has a view
- Construction: Vinyl siding exterior; Shingle roof; Block foundation; Built as existing structure
- Exterior features: Covered porch; Private yard; Wood fencing; Cleared lot
Interior
- Kitchen: Stainless steel appliances; Electric cooktop; Electric oven; Microwave; Refrigerator
- Bedrooms: Primary bedroom (14 x 13); Bedroom 2 (14 x 14); Bedroom 3 (13 x 13)
- Bathrooms: 2 full bathrooms
- Heating & cooling: Central air; Has heating
- Interior features: Pocket doors; Entrance foyer; Eat-in kitchen; Natural woodwork; Inoperable fireplace
- Laundry & utility: Washer hookup; Electric dryer hookup; Laundry area in basement / lower level
Neighborhood map
What this means for you Summary
Snapshot
- This is a 3-bed/1.0-bath single-family listed at $220k.
Deal economics
- At list price, monthly cash flow is $237 ($3k/yr) — positive.
- The deal already cash-flows at list — no discount required.
- To meet the 1% rule (rent ≥ 1% of price), the offer needs to be $212k (3.8% below list).
- Recommended offer: $212k (3.8% below list) — sets the bar for 1% rule.
- Cap rate 7.6% vs local median 5.3% in Covington — top-decile yield for the area; either an underpriced asset or a hidden risk that comps aren't pricing in. Stress-test before assuming the spread holds.
Location & tenants
- Location reads 86/100 on livability (#40 in KY, #376 nationally) — a professional / high-income tenant draw. Strengths: amenities A+, commute A+, cost of living A+; Watch: employment D+.
- Covington Independent (suburban): math 10% / reading 27% proficiency, ranked #162 of 165 in KY (top 98%) — low school quality limits family demand, transient renter base, plan for 1-2y turnover; 78% free/reduced lunch — lower-income household profile, screen leases tightly.
- Zoned schools: Sixth District Elementary School (math 8% / reading 17%, grade F, #630 of 676 statewide, top 95%, 446 students, 84% FRL); Holmes Middle School (math 8% / reading 26%, grade F, #211 of 217 statewide, top 97%, 656 students, 84% FRL); Holmes High School (math 12% / reading 17%, grade F, #227 of 254 statewide, top 89%, 878 students, 80% FRL) — zoned schools at 83% FRL track the district average.
- Market conditions: Rents rising fast (+5.1%/yr); 59 active listings in the ZIP; 9 comparable units currently listed for rent nearby; rentals leasing fast (median 13d on market — plan ~1-2 weeks tenant-placement turnaround); 699 units permitted in Kenton County in 2024 (287 in 5+ unit buildings).
- This rent runs 41% of the median local income ($61k/yr) — at the standard rent-burdened threshold; future hikes will face affordability resistance.
Forward outlook
- Local home prices are declining (-3.0%/yr); year-one equity from $2k of loan paydown is wiped out by about $7k of value loss. Plan a longer hold.
- Kenton County population projected at +5% by 2050 — modest demand growth; plan on rents tracking national, not racing it.
Negotiation context
- It's been on market 39 days — a 3% lower offer ($213k) is reasonable based on typical stale-listing flexibility.
- 4 sale attempts since 8y ago with the ask held roughly flat each time — persistent listings suggest the price (not the market) is what's stuck; bring a comps-based counter.
- Current owner paid $171k; 29% above their basis — modest negotiation headroom, anchor on the comps not their cost.
Questions for the listing agent
- It's been on market 39 days. Have you received any prior offers? Is the seller open to a 4% concession, seller financing, or rate buy-down credit?
- Is there a deadline driving the sale (1031 exchange, divorce, estate, relocation)? That informs how much negotiation room exists.
- What's the average days-on-market for RENTAL listings here right now (not sales)? A rising rental-DOM trend means longer vacancies and softer asking-rent achievability than the comps imply.
- What's the recent tenant-quality profile in this submarket — average credit score on applications, eviction rate, late-payment / NSF rate, and stable-employment percentage? A property-management company in the area should have these aggregated.
- How much new for-sale + rental construction is in the pipeline within 1–3 miles? Heavy new supply typically softens prices + rents 12–24 months out; constrained supply supports both.
Investment metrics
- 1% rule
- 0.96% ✗
- Cap rate
- 7.58%
- Cash-on-cash
- 4.61%
- DSCR
- 1.21
- GRM
- 8.7
CMA / ARV
- ARV (on-the-fly)
- $254,620
- Comps found
- 12
Show comp detail 12 sales within ~0.75 mi
| Address | Dist | Beds/Ba | Sqft | Sold | Price | $/sf | Match |
|---|---|---|---|---|---|---|---|
| 216 E 18th St | 0.00mi | 3/2.0 | 1,876 (+7%) | 1mo | $215,000 | $115 | 84 |
| 335 E 17th St | 0.14mi | 3/2.0 | 1,844 (+5%) | 0mo | $275,000 | $149 | 81 |
| 515 Delmar Pl | 0.28mi | 3/2.0 | 1,696 (-3%) | 2mo | $195,500 | $115 | 76 |
| 1904 Greenup St | 0.13mi | 4/3.0 (+1) | 1,830 (+4%) | 1mo | $314,000 | $172 | 73 |
| 1718 Greenup St | 0.05mi | 3/2.5 | 1,950 (+11%) | 0mo | $310,000 | $159 | 73 |
| 16 E 18th St | 0.17mi | 3/2.5 | 1,878 (+7%) | 1mo | $384,450 | $205 | 73 |
| 2038 Greenup St | 0.29mi | 4/2.5 (+1) | 1,698 (-3%) | 2mo | $340,000 | $200 | 69 |
| 1718 Woodburn Ave | 0.53mi | 3/2.5 | 1,680 (-4%) | 3mo | $244,000 | $145 | 59 |
| 507 Highland Pike | 0.66mi | 3/1.5 | 1,696 (-3%) | 4mo | $85,000 | $50 | 59 |
| 2009 Russell St | 0.47mi | 2/1.5 (-1) | 1,602 (-9%) | 3mo | $145,000 | $91 | 54 |
| 1712 Banklick St | 0.44mi | 2/2.0 (-1) | 1,936 (+10%) | 1mo | $230,900 | $119 | 52 |
| 1507 Morton Ave | 0.73mi | 3/1.5 | 1,856 (+6%) | 4mo | $201,700 | $109 | 51 |
Match score weights: distance 35% · size 25% · config 20% · recency 20%. Top-matched comps best support the ARV.
Projected returns pro-forma
-3.0% appreciation · 5.13% rent growth · sell at horizon
- IRR
- -6.9%
- Equity multiple
- 0.74×
- Total profit
- $-15,967
- Equity at exit
- $32,803
- IRR
- 5.1%
- Equity multiple
- 1.41×
- Total profit
- $25,284
- Equity at exit
- $19,022
Cash invested: $61,600 (down + closing). Projections, not guarantees.
Landlord ↔ Tenant lean methodology
- Overall (STATE)
- 83 Strongly Landlord-Friendly
- State Kentucky
- 83 Strongly Landlord-Friendly · R+16
- County
- — inherits STATE
- City
- — inherits STATE
ZIP-level market 41014
- Rents YoY
- 5.1%
- Active inventory
- 59
- Price-to-rent
- 8.7×
Monthly cashflow live
- Estimated rent
- $2,118 high interval (Pro) →
- Mortgage (P&I)
- −$1,154
- Tax from tax record
- −$191 /mo · $2,290/yr
- Insurance
- −$92
- HOA
- −$0
- Vacancy / Maint / Mgmt
- −$445
- Net cashflow
- $237
Break-even live
Sensitivity live
| Price | -10% $361 | -5% $299 | +0% $237 | +5% $174 | +10% $112 |
|---|---|---|---|---|---|
| Rent | -10% $69 | -5% $153 | +0% $237 | +5% $320 | +10% $404 |
| Rate | -1.0pp $347 | -0.5pp $293 | base $237 | +0.5pp $180 | +1.0pp $122 |
UW: 25.0% down · 7.5% · 30yr · 1.5% tax · 5.0% vac · 8.0% maint · 8.0% mgmt
Financing live
Cash to close
- Down payment
- $55,000
- Closing costs
- $6,600
- Reserves months
- —
- Total cash needed
- —
Loan-product check · same deal, 3 products live
Conventional
25% down · 7.5% · 30yr
- Down + closing
- —
- Monthly P&I
- —
- Monthly cashflow
- —
- DSCR
- —
- Eligible?
- —
Personal DTI + credit; lowest rate.
DSCR
20% down · 8.5% · 30yr
- Down + closing
- —
- Monthly P&I
- —
- Monthly cashflow
- —
- DSCR
- —
- Eligible?
- —
No personal income docs; deal must DSCR.
Hard money
10% down · 12.0% · 12mo
- Down + closing
- —
- Monthly P&I
- —
- Monthly cashflow
- —
- DSCR
- —
- Eligible?
- —
Short-term bridge; refi at stabilization.
Rent comps 9 comps
| Address | Beds | Baths | Sqft | Rent | $/sqft | DOM | Units | Dist |
|---|---|---|---|---|---|---|---|---|
| 1927 Scott St Apt 1 Covington, KY | 3.0 | 2.0 | 1865 | $2,100 | $1.13 | 20d | 1 | 0.20mi |
| 2030 Mackoy St Covington, KY | 3.0 | 1.5 | 1598 | $1,779 | $1.11 | 4d | 1 | 0.25mi |
| 1205 Lee St Unit 3 Covington, KY | 3.0 | 2.5 | 1850 | $3,000 | $1.62 | 24d | 1 | 0.80mi |
| 140 W 13th St Newport, KY | 3.0 | 3.5 | 2505 | $4,200 | $1.68 | 12d | 1 | 1.04mi |
| 1700 Aspen Pines Dr Wilder, KY | 1.0–3.0 | 1.0–2.5 | 1420 | $2,365 | $1.67 | 2d | 14 | 1.14mi |
| 809 Isabella St Newport, KY | 2.0 | 2.0 | 1519 | $2,200 | $1.45 | 44d | 1 | 1.17mi |
| 203 W 8th St Newport, KY | 2.0 | 1.5 | 1456 | $2,300 | $1.58 | 21d | 1 | 1.24mi |
| 103 E 3rd St Covington, KY | 2.0 | 2.5 | 1291 | $3,250 | $2.52 | 2d | 1 | 1.31mi |
| 50 W Rivercenter Blvd Covington, KY | 1.0–2.0 | 1.0–2.5 | 1273 | $3,640 | $2.86 | 2d | 9 | 1.46mi |
Listing history 13 events
-
2026-05-05status Pending
-
2026-04-24price $220,000
-
2026-03-27$229,900 Active
-
2022-10-21status Pending 60-char remark
Show marketing remark (60 chars)
Sold when entered as For Sale By Owner. Nice 2 story house.
-
2022-08-18soldstatus $171,000
-
2022-08-05soldstatus $171,000 Sold 60-char remark
Show marketing remark (60 chars)
Sold when entered as For Sale By Owner. Nice 2 story house.
-
2022-07-02$174,900 Active 60-char remark
Show marketing remark (60 chars)
Sold when entered as For Sale By Owner. Nice 2 story house.
-
2021-01-13soldstatus $40,000 Closed 28-char remark
Show marketing remark (28 chars)
Great Investment Opportunity
-
2020-11-14status Pending 28-char remark
Show marketing remark (28 chars)
Great Investment Opportunity
-
2020-11-14$65,000 Active 28-char remark
Show marketing remark (28 chars)
Great Investment Opportunity
-
2018-12-12historical
-
2018-06-28$66,000
-
1990-07-27soldstatus $25,000
ⓘ Source: listings_history table (triggers on properties + properties_extension) + one-shot
backfill from property_details.listing_events for pre-trigger history.
Tax reassessment forecast KY · Resets to sale price
- Current annual tax
- $2,290 · $191/mo
- Projected year-2 tax
- $2,290 · $191/mo
- Expected delta
- $0/yr ($0/mo · 0.0%)
ⓘ Screening estimate from a state-policy table — verify with the county assessor before closing.
Nearby sold comps map
Loading sold comps map…
Walkable amenities ~0.75 mi
Loading nearby amenities…
Taxation est. · year 1
- Rental income
- $25,410
- − Mortgage interest
- −$12,323
- − Property taxes
- −$2,290
- − Insurance
- −$1,100
- − Repairs & maintenance
- −$2,033
- − Management
- −$2,033
- − Depreciation
- −$6,400
- Taxable loss
- −$769
- Est. tax savings @ 24.0%
- +$185
- After-tax cash flow
- $3,024/yr
For passive investors: Depreciation is non-cash, so a rental often shows a tax loss while cash-flowing — sheltering income. Rental losses are passive: they offset passive income freely, and up to $25,000/yr can offset ordinary (W-2) income if you actively participate and your MAGI is under $100k (phasing out to $0 by $150k); unused losses carry forward. On sale, claimed depreciation is recaptured at up to 25%, and gains may owe capital-gains tax (a 1031 exchange can defer both). Figures are a year-1 estimate at your 24.0% rate — not tax advice; consult a CPA.
Schools (NCES district)
- District
- Covington Independent
- NCES district ID
- 2101350
- Math proficiency
- 10% ▼ -20.00%
- Reading proficiency
- 27% ▼ -14.00%
- Median HH income
- $33,681
- Composite
- 15.04/100
- National rank
- #9353
- State rank
- #162 of 165 in KY
Livability — Covington
- Score
- 86/100
- State rank
- #40
- US rank
- #376
Category grades
Schools grade is shown separately in the Schools card above.
Census & demographics
- Census place
- Covington, KY
- County
- Kenton County · 142,881 people
- City population
- 34,373
- Metro
- Cincinnati, OH-KY-IN
- Population (ZIP)
- 7,392
- Household income
- $61,382
- Rent vs Own
- Severe rent burden
- 511.0
Population outlook (Kenton County) Hauer SSP2
- Today (2025)
- 174,205 people
- By 2030
- 177,897 · +2.1%
- By 2040
- 182,671 · +4.9%
- By 2050
- 183,543 · +5.4%
- By 2075
- 178,977 · +2.7%
- By 2100
- 159,920 · -8.2%
Race, ethnicity, and origin ACS 2023
- Neighborhood character
- Predominantly White (71%)
- Race & ethnicity
- White 71% Two or more races 11% Hispanic / Latino 10% Black 8% Asian 2%
- Hispanic origin (detail)
- Mexican 1%
- Common ancestry
- Romanian 2% Lithuanian 1% Italian 1%
- Foreign-born
- 6% · Canada, China
- Languages at home
- 91% English-only · Spanish 8%
Political lean MEDSL · Kenton
- 2024 margin
- Strong R (+21.7) · D 38.2% · R 59.9% · Other 1.9%
- 2008→2024 swing
- -0.9pp no change · 2008: -20.9pp · 2024: -21.7pp
- All cycles
- 2024: R+21.7 2020: R+19.3 2016: R+26.1 2012: R+24.3 2008: R+20.9
Not yet ingested
- Civics
- —
Market trends
- HPI YoY
- ▼ -172.77%
- Current HPI
- 233.8216
- Rent YoY
- ▲ 5.13%
- Metro
- Cincinnati, OH-KY-IN
- State GDP YoY
- ▲ 1.81%
- F500 in state
- 4
Industry mix (Fortune 500 HQ in KY)
| Industry | F500 HQs | Revenue |
|---|---|---|
| Healthcare | 1 | $118B |
|
||
| Food / Beverage | 1 | $7B |
|
||
Price history
+780.0% since first listed13 events — show timeline
- 2026-05-05 Pending — NKMLS
- 2026-04-24 Price Changed $220,000 NKMLS
- 2026-03-27 Listed $229,900 NKMLS
- 2022-10-21 Pending — NKMLS
- 2022-08-18 Sold (Public Records) $171,000 Public Records
- 2022-08-05 Sold (MLS) $171,000 NKMLS
- 2022-07-02 Listed $174,900 NKMLS
- 2021-01-13 Sold (MLS) $40,000 NKMLS
- 2020-11-14 Pending — NKMLS
- 2020-11-14 Listed $65,000 NKMLS
- 2018-12-12 Listing Removed — NKMLS
- 2018-06-28 Listed $66,000 NKMLS
- 1990-07-27 Sold (Public Records) $25,000 Public Records
Property tax history
+6.4%/yrLatest (2025): $2,290 · +0.7% YoY. Source: county tax records.
Cash-flow waterfall
monthlySold comps — $/sqft
last 12 mo · ≤1 miLoading sold comps…