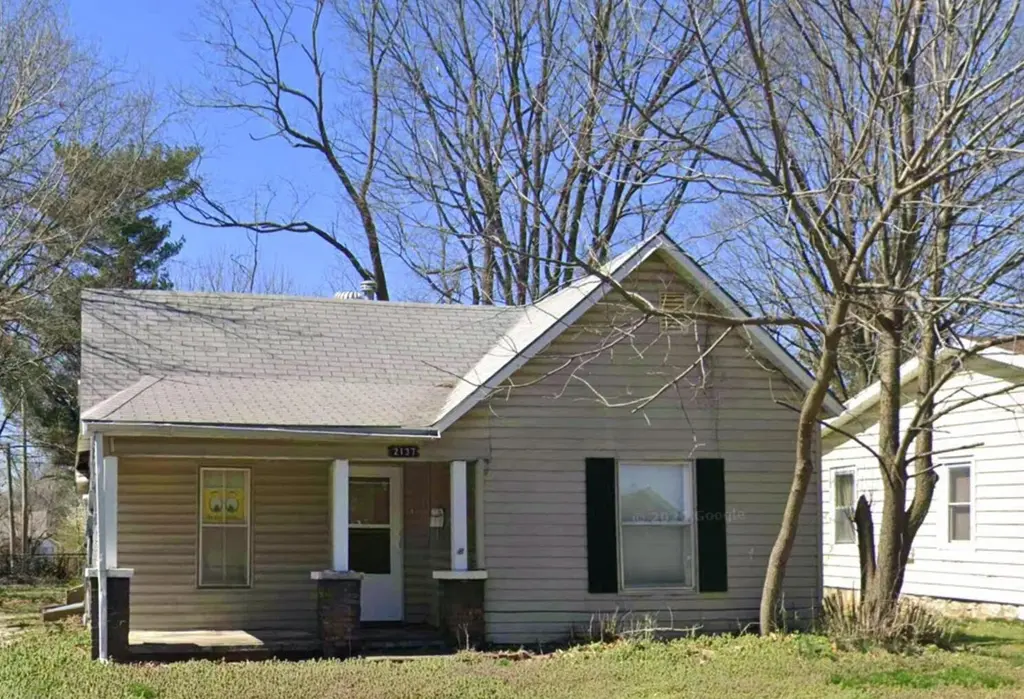
2137 N Weller Ave · Springfield, MO
Flood risk 1/10 · Minimal
- FEMA flood zone
- X (unshaded)
- Chance of flooding over 30 yrs
- 0.0%
- Est. flood insurance / yr
- $507 – $1,088
Fire risk 2/10 · Minimal
- Est. fire insurance / yr
- $1,054 – $1,958
Heat risk 5/10 · Moderate
- Hot days now (above 105°F)
- 7 days/yr
- Hot days in 30 yrs
- 19 days/yr
Wind risk 2/10 · Minimal
- Chance of severe wind over 30 yrs
- —
Air-quality risk 2/10 · Minimal
- Unhealthy air days now
- 1 days/yr
- Unhealthy air days in 30 yrs
- 2 days/yr
Risk factors via First Street. Map © Google.
Why this score? — see what drove the B grade
The composite is a weighted blend of 9 inputs, each scored 0–100. Each bar is that input's sub-score; the figure is the points it added to the 100-point composite (weight × sub-score).
- Cash flow +30.0/30.0
- 1% rule +10.0/10.0
- DSCR +10.0/10.0
- ARV discount +7.5/15.0
- Livability +3.8/5.0
- Rent growth +3.6/5.0
- Schools +3.2/10.0
- Condition / age +2.5/5.0
- Appreciation +0.0/10.0
$49,900
🖨 Deal sheet (PDF) 📄 Offer letter ✓ Due diligence
Listing remarks
Investor special! Welcome to 2137 N Weller Ave, an affordable opportunity with tremendous potential. Bring your tools, ideas, and vision to transform this property into something special. Ideal for investors, flippers, or those seeking a value-add project. Selling as-is. Don't miss your chance to purchase at an attractive price point.
Key facts
- 7,841 sq ft lot
- Built 1894
- Listed 2 days
Property features AI
Finance
- Other: Total finished living area reported as 756
- Financial info: Tax information provided but excluded from feature list
- HOA & community: HOA details not specified
Exterior
- Parking: Parking details not specified
- Security: Security details not specified
- Utilities: Public water; Public sewer
- Home design: Single-family residence; One story
- Construction: Construction details not specified
- Exterior features: Lot in Prospect Place subdivision; Lot approximately 0.18 acre
Interior
- Kitchen: Kitchen details not specified
- Bedrooms: Bedrooms not specified
- Flooring: Flooring details not specified
- Bathrooms: 1 full bathroom
- Heating & cooling: Central heating (natural gas); Central air conditioning
- Interior features: One level layout
- Laundry & utility: Laundry details not specified
Neighborhood map
What this means for you Summary
Snapshot
- This is a 2-bed/1.0-bath single-family listed at $50k.
Deal economics
- At list price, monthly cash flow is $489 ($6k/yr) — positive.
- The deal already cash-flows at list — no discount required.
- Meets the 1% rule at list price ($1k rent vs $50k).
- Cap rate 18.0% vs local median 4.6% in Springfield — top-decile yield for the area; either an underpriced asset or a hidden risk that comps aren't pricing in. Stress-test before assuming the spread holds.
Location & tenants
- Location reads 75/100 on livability (#57 in MO, #4,121 nationally) — a middle-class / working-renter tenant base. Strengths: commute A+, cost of living A+, housing A+; Watch: crime F, employment F.
- Springfield R-XII (urban): math 32% / reading 46% proficiency, ranked #174 of 324 in MO (top 54%) — families likely to look elsewhere, expect single-tenant / working-renter base with shorter leases.
- Zoned schools: Fremont Elem. (math 22% / reading 32%, grade F, #850 of 1,115 statewide, top 78%, 382 students, 80% FRL); Hillcrest High (math 9% / reading 35%, grade F, #462 of 521 statewide, top 90%, 1,017 students, 64% FRL) — zoned schools average 72% FRL vs 46% district-wide (25 pts higher); higher-poverty schools than district average — tighter screening recommended.
- Zoned-school proficiency averages 24% at this address vs 39% district-wide (-14 pts) — the specific schools serving this property underperform the Springfield R-XII average; the district grade overstates school quality for this exact location.
- Market conditions: Rents rising fast (+4.2%/yr); 394 active listings in the ZIP; 30 comparable units currently listed for rent nearby; rentals at typical pace (median 25d on market — plan ~3-4 weeks tenant-placement turnaround); 47% of comp listings sitting > 30 days — soft ceiling on asking rent; 1,302 units permitted in Greene County in 2024 (250 in 5+ unit buildings).
Forward outlook
- Local home prices are declining (-3.0%/yr); year-one equity from $345 of loan paydown is wiped out by about $1k of value loss. Plan a longer hold.
- Greene County population projected at +25% by 2050 — long-run rental-demand tailwind backs the buy-and-hold thesis.
- At projected returns (-3.0% appreciation + 4.2% rent growth), your $14k cash investment doubles in ~3 years — after that, you're playing with house money.
Negotiation context
- Only 2 days on market — expect competitive offers; lowballing is unlikely to land.
Risks & watch-outs
- Watch-outs: built in 1894 — expect roof / HVAC / electrical / plumbing capex.
- Climate carrying-cost: extreme-heat days projected 7→19/yr by 2055 (HVAC capex compounding) — expect insurance premiums to compound above CPI over the hold.
Questions for the listing agent
- Built in 1894 — when were the roof, HVAC, electrical panel, plumbing, and water heater last replaced?
- Is there a deadline driving the sale (1031 exchange, divorce, estate, relocation)? That informs how much negotiation room exists.
- Crime grade is F in this area — have there been break-ins, vandalism, or insurance claims at this property in the last 3 years? What carrier currently insures it and at what premium?
- What's the average days-on-market for RENTAL listings here right now (not sales)? A rising rental-DOM trend means longer vacancies and softer asking-rent achievability than the comps imply.
- What's the recent tenant-quality profile in this submarket — average credit score on applications, eviction rate, late-payment / NSF rate, and stable-employment percentage? A property-management company in the area should have these aggregated.
- How much new for-sale + rental construction is in the pipeline within 1–3 miles? Heavy new supply typically softens prices + rents 12–24 months out; constrained supply supports both.
Investment metrics
- 1% rule
- 2.03% ✓
- Cap rate
- 18.04%
- Cash-on-cash
- 41.96%
- DSCR
- 2.87
- GRM
- 4.1
CMA / ARV
- ARV (on-the-fly)
- $117,180
- Comps found
- 12
Show comp detail 12 sales within ~0.75 mi
| Address | Dist | Beds/Ba | Sqft | Sold | Price | $/sf | Match |
|---|---|---|---|---|---|---|---|
| 2135 N Fremont Ave | 0.14mi | 2/1.0 | 804 (+6%) | 8mo | $119,900 | $149 | 76 |
| 1719 N Weller | 0.51mi | 2/1.0 | 768 (+2%) | 3mo | $129,000 | $168 | 71 |
| 2031 N Fremont Ave | 0.19mi | 2/1.0 | 866 (+15%) | 6mo | $99,900 | $115 | 62 |
| 1420 E Livingston St | 0.67mi | 2/1.0 | 780 (+3%) | 4mo | $59,900 | $77 | 60 |
| 1847 E Dale St | 0.48mi | 2/1.0 | 848 (+12%) | 9mo | $149,900 | $177 | 50 |
| 2212 N Kellett Ave | 0.71mi | 2/2.0 | 720 (-5%) | 6mo | $124,900 | $173 | 50 |
| 1601 N Rogers Ave | 0.66mi | 2/1.0 | 840 (+11%) | 3mo | $129,900 | $155 | 48 |
| 1433 E Division St | 0.70mi | 2/1.0 | 844 (+12%) | 0mo | $115,000 | $136 | 47 |
| 1078 E Blaine St | 0.68mi | 2/1.0 | 841 (+11%) | 3mo | $109,900 | $131 | 47 |
| 2214 N Kellett Ave | 0.72mi | 2/1.0 | 840 (+11%) | 3mo | $149,900 | $178 | 46 |
| 1406 E Nora St | 0.74mi | 2/1.0 | 676 (-11%) | 2mo | $140,000 | $207 | 46 |
| 902 E Garfield St | 0.74mi | 2/1.0 | 658 (-13%) | 3mo | $92,000 | $140 | 42 |
Match score weights: distance 35% · size 25% · config 20% · recency 20%. Top-matched comps best support the ARV.
Projected returns pro-forma
-3.0% appreciation · 4.24% rent growth · sell at horizon
- IRR
- 40.0%
- Equity multiple
- 2.74×
- Total profit
- $24,304
- Equity at exit
- $7,440
- IRR
- 46.9%
- Equity multiple
- 5.77×
- Total profit
- $66,586
- Equity at exit
- $4,314
Cash invested: $13,972 (down + closing). Projections, not guarantees.
Landlord ↔ Tenant lean methodology
- Overall (STATE)
- 81 Strongly Landlord-Friendly
- State Missouri
- 81 Strongly Landlord-Friendly · R+10
- County
- — inherits STATE
- City
- — inherits STATE
ZIP-level market 65803
- Home prices YoY
- -29.8%
- Rents YoY
- 4.2%
- Active inventory
- 394
- Price-to-rent
- 4.1×
Monthly cashflow live
- Estimated rent
- $1,012 high interval (Pro) →
- Mortgage (P&I)
- −$262
- Tax from tax record
- −$28 /mo · $336/yr
- Insurance
- −$21
- HOA
- −$0
- Vacancy / Maint / Mgmt
- −$212
- Net cashflow
- $489
Break-even live
Sensitivity live
| Price | -10% $517 | -5% $503 | +0% $489 | +5% $474 | +10% $460 |
|---|---|---|---|---|---|
| Rent | -10% $409 | -5% $449 | +0% $489 | +5% $529 | +10% $568 |
| Rate | -1.0pp $514 | -0.5pp $501 | base $489 | +0.5pp $476 | +1.0pp $463 |
UW: 25.0% down · 7.5% · 30yr · 1.5% tax · 5.0% vac · 8.0% maint · 8.0% mgmt
Financing live
Cash to close
- Down payment
- $12,475
- Closing costs
- $1,497
- Reserves months
- —
- Total cash needed
- —
Loan-product check · same deal, 3 products live
Conventional
25% down · 7.5% · 30yr
- Down + closing
- —
- Monthly P&I
- —
- Monthly cashflow
- —
- DSCR
- —
- Eligible?
- —
Personal DTI + credit; lowest rate.
DSCR
20% down · 8.5% · 30yr
- Down + closing
- —
- Monthly P&I
- —
- Monthly cashflow
- —
- DSCR
- —
- Eligible?
- —
No personal income docs; deal must DSCR.
Hard money
10% down · 12.0% · 12mo
- Down + closing
- —
- Monthly P&I
- —
- Monthly cashflow
- —
- DSCR
- —
- Eligible?
- —
Short-term bridge; refi at stabilization.
Rent comps 30 comps
| Address | Beds | Baths | Sqft | Rent | $/sqft | DOM | Units | Dist |
|---|---|---|---|---|---|---|---|---|
| 1447 E Oakwood Ln Springfield, MO | 2.0 | 2.0 | 982 | $1,395 | $1.42 | 45d | 1 | 0.18mi |
| 2054 N Rogers Ave Springfield, MO | 2.0 | 1.0 | 888 | $925 | $1.04 | 15d | 1 | 0.19mi |
| 2337 N Delaware Ave Springfield, MO | 2.0 | 1.0 | 876 | $1,195 | $1.36 | 45d | 1 | 0.23mi |
| 2313 N Rogers Ave Unit 1 Springfield, MO | 2.0 | 2.0 | 882 | $950 | $1.08 | 15d | 1 | 0.29mi |
| 2345 N Prospect Ave Springfield, MO | 2.0 | 1.0 | 792 | $850 | $1.07 | 15d | 1 | 0.37mi |
| 2337 N Ramsey Ave Springfield, MO | 2.0 | 1.0 | 882 | $875 | $0.99 | 15d | 1 | 0.42mi |
| 1501 E Blaine St Springfield, MO | 2.0 | 1.0 | 958 | $695 | $0.73 | 24d | 1 | 0.45mi |
| 1710 E Commercial St Unit B Springfield, MO | 2.0 | 1.0 | 950 | $775 | $0.82 | 45d | 1 | 0.51mi |
| 2234 N Travis Ave Springfield, MO | 1.0 | 1.0 | 890 | $750 | $0.84 | 45d | 1 | 0.57mi |
| 1636 N National Ave Springfield, MO | 3.0 | 1.5 | 1000 | $995 | $0.99 | 45d | 1 | 0.65mi |
| 1529 N Weller Ave Springfield, MO | 2.0 | 1.0 | 870 | $995 | $1.14 | 24d | 1 | 0.65mi |
| 2346 N Kellett Ave Apt B Springfield, MO | 1.0 | 1.0 | 550 | $825 | $1.50 | 45d | 1 | 0.76mi |
| 1112 E Locust St Springfield, MO | 2.0 | 1.0 | 840 | $945 | $1.12 | 24d | 1 | 0.77mi |
| 805 E Garfield St Springfield, MO | 2.0 | 1.0 | 950 | $950 | $1.00 | 15d | 1 | 0.81mi |
| 2034 N Washington Ave Springfield, MO | 2.0 | 1.0 | 800 | $875 | $1.09 | 45d | 1 | 0.95mi |
| 716 E Locust St Unit A Springfield, MO | 2.0 | 1.0 | 915 | $850 | $0.93 | 24d | 1 | 1.03mi |
| 3000 N Kentwood Ave Springfield, MO | 1.0 | 1.0 | 650 | $650 | $1.00 | 15d | 1 | 1.04mi |
| 2650 N Barnes Ave Apt C22 Springfield, MO | 2.0 | 2.0 | 1100 | $1,000 | $0.91 | 45d | 1 | 1.07mi |
| 1246 E Norton Rd Springfield, MO | 1.0 | 1.0 | 650 | $595 | $0.92 | 45d | 1 | 1.07mi |
| 1306 N Frisco Ave Apt A Springfield, MO | 2.0 | 1.5–2.0 | 970 | $995 | $1.03 | 15d | 19 | 1.09mi |
| 407 E Dale St Apt B Springfield, MO | 2.0 | 1.0 | 720 | $795 | $1.10 | 15d | 1 | 1.14mi |
| 2940 N East Ave Springfield, MO | 2.0 | 2.0 | 915 | $700 | $0.77 | 15d | 1 | 1.17mi |
| 317 E Chase St Springfield, MO | 2.0 | 2.0 | 915 | $1,100 | $1.20 | 45d | 1 | 1.24mi |
| 1409 N Washington Ave Springfield, MO | 2.0 | 1.0 | 839 | $1,405 | $1.67 | 15d | 2 | 1.28mi |
| 1623 N Jefferson Ave Unit B Springfield, MO | 1.0 | 1.0 | 750 | $950 | $1.27 | 45d | 1 | 1.30mi |
| 1034 E McCanse St Springfield, MO | 3.0 | 1.0 | 910 | $1,150 | $1.26 | 24d | 1 | 1.30mi |
| 1825 N Oak Grove Ave Springfield, MO | 3.0 | 1.0 | 852 | $995 | $1.17 | 45d | 1 | 1.36mi |
| 1530 N Robberson Ave Springfield, MO | 3.0 | 2.0 | 1122 | $1,425 | $1.27 | 45d | 1 | 1.38mi |
| 2230 N Campbell Ave Springfield, MO | 2.0 | 1.0 | 1084 | $1,095 | $1.01 | 45d | 1 | 1.38mi |
| 203 W Commercial St Unit 2F Springfield, MO | 2.0 | 1.0 | 1000 | $1,150 | $1.15 | 22d | 1 | 1.41mi |
Listing history 4 events
-
2026-06-14status $49,900 Pending 2 DOM
-
2026-06-10days on market $49,900 Active 2 DOM
-
2026-06-09remarks 336-char remark
-
2026-06-09$49,900 Active 1 DOM
ⓘ Source: listings_history table (triggers on properties + properties_extension) + one-shot
backfill from property_details.listing_events for pre-trigger history.
Tax reassessment forecast MO · Resets to sale price
- Current annual tax
- $336 · $28/mo
- Projected year-2 tax
- $484 · $40/mo
- Expected delta
- +$148/yr (+$12/mo · 43.9%)
ⓘ Screening estimate from a state-policy table — verify with the county assessor before closing.
Climate risk First Street
- Flood 1/10 Low FEMA zone X (unshaded) · 0% chance over 30 yrs
- Wildfire 2/10 Low
- Heat 5/10 Major 7 d/yr ≥105°F today · 19 d/yr by 30 yrs out
- Wind 2/10 Low
- Air quality 2/10 Low 1 unhealthy d/yr today · 2 by 30 yrs out
Nearby sold comps map
Loading sold comps map…
Walkable amenities ~0.75 mi
Loading nearby amenities…
Taxation est. · year 1
- Rental income
- $12,138
- − Mortgage interest
- −$2,795
- − Property taxes
- −$336
- − Insurance
- −$250
- − Repairs & maintenance
- −$971
- − Management
- −$971
- − Depreciation
- −$1,452
- Taxable income
- $5,363
- Est. tax owed @ 24.0%
- −$1,287
- After-tax cash flow
- $4,576/yr
For passive investors: Depreciation is non-cash, so a rental often shows a tax loss while cash-flowing — sheltering income. Rental losses are passive: they offset passive income freely, and up to $25,000/yr can offset ordinary (W-2) income if you actively participate and your MAGI is under $100k (phasing out to $0 by $150k); unused losses carry forward. On sale, claimed depreciation is recaptured at up to 25%, and gains may owe capital-gains tax (a 1031 exchange can defer both). Figures are a year-1 estimate at your 24.0% rate — not tax advice; consult a CPA.
Schools (NCES district)
- District
- Springfield R-XII
- NCES district ID
- 2928860
- Math proficiency
- 32% ▼ -2.00%
- Reading proficiency
- 46% ▼ -3.00%
- Median HH income
- $37,886
- Composite
- 32.45/100
- National rank
- #5717
- State rank
- #174 of 324 in MO
Livability — Springfield
- Score
- 75/100
- State rank
- #57
- US rank
- #4121
Category grades
Schools grade is shown separately in the Schools card above.
Census & demographics
- Census place
- Springfield, MO
- County
- Greene County · 244,327 people
- City population
- 223,044
- Metro
- Springfield, MO
- Population (ZIP)
- 42,882
- Household income
- $50,572
- Rent vs Own
- Severe rent burden
- 1305.0
Population outlook (Greene County) Hauer SSP2
- Today (2025)
- 319,054 people
- By 2030
- 335,135 · +5.0%
- By 2040
- 366,186 · +14.8%
- By 2050
- 397,431 · +24.6%
- By 2075
- 477,035 · +49.5%
- By 2100
- 520,828 · +63.2%
Race, ethnicity, and origin ACS 2023
- Neighborhood character
- Predominantly White (82%)
- Race & ethnicity
- White 82% Two or more races 9% Hispanic / Latino 6% Black 4%
- Hispanic origin (detail)
- Mexican 2% Puerto Rican 2%
- Common ancestry
- Lithuanian 2% Italian 2% Iranian 2%
- Foreign-born
- 3% · Canada
- Languages at home
- 95% English-only · Spanish 3%
Political lean MEDSL · Greene
- 2024 margin
- Strong R (+20.8) · D 38.9% · R 59.7% · Other 1.4%
- 2008→2024 swing
- -5.0pp toward R · 2008: -15.8pp · 2024: -20.8pp
- All cycles
- 2024: R+20.8 2020: R+20.1 2016: R+27.4 2012: R+24.4 2008: R+15.8
Not yet ingested
- Civics
- —
Market trends
- HPI YoY
- ▼ -87.08%
- Current HPI
- 205.0439
- Rent YoY
- ▲ 4.24%
- Metro
- Springfield, MO
- State GDP YoY
- ▲ 1.84%
- F500 in state
- 20
Industry mix (Fortune 500 HQ in MO)
| Industry | F500 HQs | Revenue |
|---|---|---|
| Healthcare | 1 | $163B |
|
||
| Insurance | 1 | $21B |
|
||
| Industrial Technology | 1 | $17B |
|
||
| Retail | 1 | $16B |
|
||
| Industrial Distribution | 1 | $10B |
|
||
| Utilities | 1 | $9B |
|
||
Price history
-63.0% since first listed3 events — show timeline
- 2026-06-08 Listed $49,900 SOMO
- 2014-03-03 Sold (Public Records) $135,000 Public Records
- 2004-06-11 Sold (Public Records) — Public Records
Property tax history
+2.5%/yrLatest (2025): $336 · +18.9% YoY. Source: county tax records.
Cash-flow waterfall
monthlySold comps — $/sqft
last 12 mo · ≤1 miLoading sold comps…