 🏷️ Likely Rental
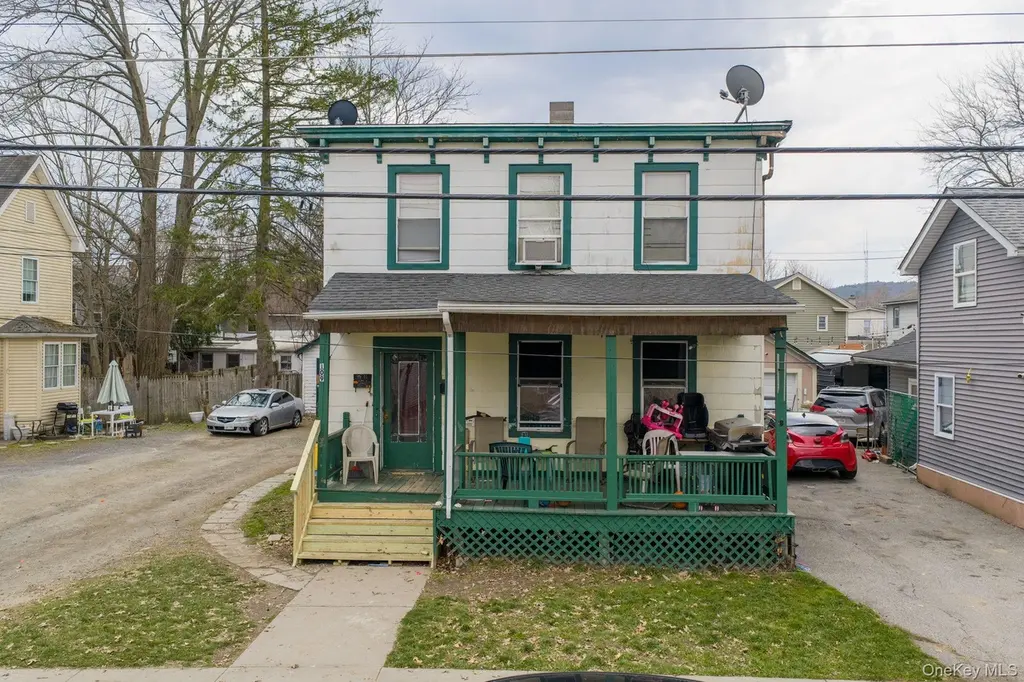
109 Ball St · Port Jervis, NY
Flood risk 10/10 · Severe
- FEMA flood zone
- X (unshaded)
- Chance of flooding over 30 yrs
- 0.99%
- Est. flood insurance / yr
- $473 – $860
Fire risk 3/10 · Minor
- Est. fire insurance / yr
- $691 – $1,283
Heat risk 5/10 · Moderate
- Hot days now (above 97°F)
- 8 days/yr
- Hot days in 30 yrs
- 18 days/yr
Wind risk 3/10 · Minor
- Chance of severe wind over 30 yrs
- 8.0%
Air-quality risk 2/10 · Minimal
- Unhealthy air days now
- 1 days/yr
- Unhealthy air days in 30 yrs
- 2 days/yr
Risk factors via First Street. Map © Google.
Why this score? — see what drove the B+ grade
The composite is a weighted blend of 9 inputs, each scored 0–100. Each bar is that input's sub-score; the figure is the points it added to the 100-point composite (weight × sub-score).
- Cash flow +30.0/30.0
- ARV discount +15.0/15.0
- 1% rule +10.0/10.0
- DSCR +10.0/10.0
- Schools +3.9/10.0
- Livability +3.5/5.0
- Rent growth +2.5/5.0
- Condition / age +2.5/5.0
- Appreciation +0.0/10.0
$199,000
🖨 Deal sheet (PDF) 📄 Offer letter ✓ Due diligence
Multi-family units
County records classify this as Multi-Family (2-4 Unit). Listing-text estimate: 2 units. confirmed
Listing remarks MLS
Possitive cash flow is what you will receive when you close on this house. Long term tenant in apt. 2 The rent must be raised to fit market price of $700 dollars. SEPERATE UTILITIES, pay only taxes and water. The garage can be rented for $50 a month. 2 furnaces 3yrs old 2 hotwtr htr 2002, roof 3yrs old. Front porch will be rebuilt. Don't lose make ofer
Key facts
- Covered front porch
- Large driveway
- Two family colonial
Tags
Property features AI
Exterior
- Parking: Detached parking; Total parking for 8 vehicles; 2-car garage
- Utilities: Public sewer; Electric service by Orange & Rockland; Trash collection (public)
- Home design: Duplex; Actual property condition
- Construction: Frame construction; Unfinished basement; Attic access via scuttle
- Exterior features: Level lot; Fenced yard; Covered porch
Interior
- Kitchen: Walk-through kitchen (features not specified)
- Bedrooms: Two 2-bedroom units (duplex configuration)
- Flooring: Hardwood floors; Linoleum flooring
- Bathrooms: Two full bathrooms
- Heating & cooling: Natural gas heating; Radiant heating; No central cooling
- Interior features: First-floor bedroom; First-floor full bathroom; Entrance foyer; Formal dining room; Original details; Walk-through kitchen; Washer/dryer hookup
- Laundry & utility: In-unit laundry possible (washer hookup provided)
Neighborhood map
What this means for you Summary
Snapshot
- This is a 2 × 2-bed/1.0-bath units multifamily listed at $199k.
Deal economics
- At list price, monthly cash flow is $2k ($18k/yr) — positive. Per door: $756/mo.
- The deal already cash-flows at list — no discount required.
- Meets the 1% rule at list price ($4k rent vs $199k).
- Cap rate 15.7% vs local median 4.6% in Port Jervis — top-decile yield for the area; either an underpriced asset or a hidden risk that comps aren't pricing in. Stress-test before assuming the spread holds.
Location & tenants
- Location reads 69/100 on livability (#475 in NY) — a middle-class / working-renter tenant base. Strengths: health & safety A+, amenities B+, cost of living B+; Watch: housing C-, crime D+, employment F.
- Port Jervis City School District (rural): math 43% / reading 50% proficiency, ranked #451 of 590 in NY (top 76%) — families likely to look elsewhere, expect single-tenant / working-renter base with shorter leases.
- Zoned schools: Anna S Kuhl Elementary School (math 35% / reading 49%, grade F, #1,361 of 2,108 statewide, top 67%, 755 students, 63% FRL); Port Jervis Middle School (math 22% / reading 35%, grade F, #569 of 729 statewide, top 78%, 379 students, 59% FRL); Port Jervis Senior High School (math 87% / reading 95%, grade A+, #203 of 1,100 statewide, top 20%, 750 students, 55% FRL).
- Market conditions: 109 active listings in the ZIP; 4 comparable units currently listed for rent nearby; rentals at typical pace (median 15d on market — plan ~3-4 weeks tenant-placement turnaround); 1,746 units permitted in Orange County in 2024 (1,265 in 5+ unit buildings).
- At $3,782/mo this rent would consume 67% of the median local household income ($68k/yr) (locally 792% of renters already pay >50% of income on rent) — very limited rent-growth headroom before tenants either downsize or default.
Forward outlook
- Local home prices are declining (-3.0%/yr); year-one equity from $1k of loan paydown is wiped out by about $6k of value loss. Plan a longer hold.
- At projected returns (-3.0% appreciation + 3.0% rent growth), your $56k cash investment doubles in ~4 years — after that, you're playing with house money.
Negotiation context
- Only 8 days on market — expect competitive offers; lowballing is unlikely to land.
- 3 sale attempts since 24y ago with the ask held roughly flat each time — persistent listings suggest the price (not the market) is what's stuck; bring a comps-based counter.
- Current owner paid $97k; list at $199k implies a 105% gain — meaningful room to come down on a strong offer.
Risks & watch-outs
- Watch-outs: flood insurance adds $56/mo; built in 1870 — expect roof / HVAC / electrical / plumbing capex.
- Climate carrying-cost: severe flood risk; extreme-heat days projected 8→18/yr by 2055 (HVAC capex compounding) — expect insurance premiums to compound above CPI over the hold.
Questions for the listing agent
- Can we see the unit-by-unit rent roll, current vacancy, and any below-market leases? What's the average tenancy length?
- What capital expenditures (roof, boiler, parking lot, exteriors) have been made in the last 5 years, and what's planned in the next 2?
- Built in 1870 — when were the roof, HVAC, electrical panel, plumbing, and water heater last replaced?
- What's the actual annual flood-insurance premium (NFIP or private), and is the property in a SFHA with mandatory coverage?
- Is there a deadline driving the sale (1031 exchange, divorce, estate, relocation)? That informs how much negotiation room exists.
- Crime grade is D in this area — have there been break-ins, vandalism, or insurance claims at this property in the last 3 years? What carrier currently insures it and at what premium?
- What's the average days-on-market for RENTAL listings here right now (not sales)? A rising rental-DOM trend means longer vacancies and softer asking-rent achievability than the comps imply.
- What's the recent tenant-quality profile in this submarket — average credit score on applications, eviction rate, late-payment / NSF rate, and stable-employment percentage? A property-management company in the area should have these aggregated.
- How much new apartment / multifamily construction is in the pipeline within 1–3 miles? Heavy new supply (>2% of stock underway) typically softens rents 12–24 months out; light construction supports rent growth.
Investment metrics
- 1% rule
- 1.90% ✓
- Cap rate
- 15.74%
- Cash-on-cash
- 33.75%
- DSCR
- 2.50
- GRM
- 4.4
CMA / ARV
- ARV (on-the-fly)
- $300,560
- Comps found
- 3
Show comp detail 3 sales within ~0.75 mi
| Address | Dist | Beds/Ba | Sqft | Sold | Price | $/sf | Match |
|---|---|---|---|---|---|---|---|
| 20 W Broome St | 0.54mi | 5/2.5 (+1) | 2,316 (+0%) | 16mo | $185,000 | $80 | 54 |
| 201 Avenue K | 0.68mi | 4/4.0 | 2,385 (+3%) | 1mo | $310,000 | $130 | 54 |
| 10-12 Lyman St | 0.58mi | 5/3.0 (+1) | 2,496 (+8%) | 12mo | $482,000 | $193 | 41 |
Match score weights: distance 35% · size 25% · config 20% · recency 20%. Top-matched comps best support the ARV.
Projected returns pro-forma
-3.0% appreciation · 3.0% rent growth · sell at horizon
- IRR
- 27.7%
- Equity multiple
- 2.15×
- Total profit
- $64,154
- Equity at exit
- $29,672
- IRR
- 35.2%
- Equity multiple
- 4.24×
- Total profit
- $180,326
- Equity at exit
- $17,206
Cash invested: $55,720 (down + closing). Projections, not guarantees.
Landlord ↔ Tenant lean methodology
- Overall (STATE)
- 15 Strongly Tenant-Friendly
- State New York
- 15 Strongly Tenant-Friendly · D+10
- County
- — inherits STATE
- City
- — inherits STATE
ZIP-level market 12771
- Home prices YoY
- -20.1%
- Active inventory
- 109
- Price-to-rent
- 8.8×
Monthly cashflow live
- Estimated rent
- $3,782 high interval (Pro) →
- Mortgage (P&I)
- −$1,044
- Tax from tax record
- −$294 /mo · $3,528/yr
- Insurance
- −$83
- Flood insurance flood zone
- −$56 /mo · $666/yr
- HOA
- −$0
- Vacancy / Maint / Mgmt
- −$794
- Net cashflow
- $1,512
Break-even live
Sensitivity live
| Price | -10% $1,624 | -5% $1,568 | +0% $1,512 | +5% $1,455 | +10% $1,399 |
|---|---|---|---|---|---|
| Rent | -10% $1,213 | -5% $1,362 | +0% $1,512 | +5% $1,661 | +10% $1,810 |
| Rate | -1.0pp $1,612 | -0.5pp $1,562 | base $1,512 | +0.5pp $1,460 | +1.0pp $1,408 |
2-unit breakdown (identical units grouped — click to expand)
| Units | Beds | Baths | Est. rent |
|---|---|---|---|
| 2× units | 2 | 1 | $3,782 |
| #1 | 2 | 1 | $1,891 |
| #2 | 2 | 1 | $1,891 |
| Total (2 units) | $3,782 | ||
UW: 25.0% down · 7.5% · 30yr · 1.5% tax · 5.0% vac · 8.0% maint · 8.0% mgmt
Financing live
Cash to close
- Down payment
- $49,750
- Closing costs
- $5,970
- Reserves months
- —
- Total cash needed
- —
Loan-product check · same deal, 3 products live
Conventional
25% down · 7.5% · 30yr
- Down + closing
- —
- Monthly P&I
- —
- Monthly cashflow
- —
- DSCR
- —
- Eligible?
- —
Personal DTI + credit; lowest rate.
DSCR
20% down · 8.5% · 30yr
- Down + closing
- —
- Monthly P&I
- —
- Monthly cashflow
- —
- DSCR
- —
- Eligible?
- —
No personal income docs; deal must DSCR.
Hard money
10% down · 12.0% · 12mo
- Down + closing
- —
- Monthly P&I
- —
- Monthly cashflow
- —
- DSCR
- —
- Eligible?
- —
Short-term bridge; refi at stabilization.
Rent comps 4 comps
| Address | Beds | Baths | Sqft | Rent | $/sqft | DOM | Units | Dist |
|---|---|---|---|---|---|---|---|---|
| 104 Ball St Unit 1 Port Jervis, NY | 3.0 | 1.0 | 1700 | $1,850 | $1.09 | 11d | 1 | 0.07mi |
| 200 Avenue H Matamoras, PA | 3.0 | 2.0 | 2000 | $2,700 | $1.35 | 0d | 1 | 0.76mi |
| 49 Orange St Port Jervis, NY | 4.0 | 1.0 | 1688 | $2,200 | $1.30 | 45d | 1 | 0.76mi |
| 11 Grandview Ave Port Jervis, NY | 4.0 | 2.5 | 1800 | $2,850 | $1.58 | 14d | 1 | 0.88mi |
Listing history 2 events
-
2026-06-01remarks 699-char remark
-
2026-06-01$199,000 Pending 8 DOM
ⓘ Source: listings_history table (triggers on properties + properties_extension) + one-shot
backfill from property_details.listing_events for pre-trigger history.
Tax reassessment forecast NY · Partial reset (capped growth)
- Current annual tax
- $3,528 · $294/mo
- Projected year-2 tax
- $3,528 · $294/mo
- Expected delta
- $0/yr ($0/mo · 0.0%)
ⓘ Screening estimate from a state-policy table — verify with the county assessor before closing.
Climate risk First Street
- Flood 10/10 Extreme FEMA zone X (unshaded) · 99% chance over 30 yrs
- Wildfire 3/10 Moderate
- Heat 5/10 Major 8 d/yr ≥97°F today · 18 d/yr by 30 yrs out
- Wind 3/10 Moderate 8% chance of damaging wind over 30 yrs
- Air quality 2/10 Low 1 unhealthy d/yr today · 2 by 30 yrs out
Nearby sold comps map
Loading sold comps map…
Walkable amenities ~0.75 mi
Loading nearby amenities…
Taxation est. · year 1
- Rental income
- $45,384
- − Mortgage interest
- −$11,147
- − Property taxes
- −$3,528
- − Insurance
- −$1,662
- − Repairs & maintenance
- −$3,631
- − Management
- −$3,631
- − Depreciation
- −$5,789
- Taxable income
- $15,996
- Est. tax owed @ 24.0%
- −$3,839
- After-tax cash flow
- $14,301/yr
For passive investors: Depreciation is non-cash, so a rental often shows a tax loss while cash-flowing — sheltering income. Rental losses are passive: they offset passive income freely, and up to $25,000/yr can offset ordinary (W-2) income if you actively participate and your MAGI is under $100k (phasing out to $0 by $150k); unused losses carry forward. On sale, claimed depreciation is recaptured at up to 25%, and gains may owe capital-gains tax (a 1031 exchange can defer both). Figures are a year-1 estimate at your 24.0% rate — not tax advice; consult a CPA.
Schools (NCES district)
- District
- Port Jervis City School District
- NCES district ID
- 3623520
- Math proficiency
- 43% ▼ -7.00%
- Reading proficiency
- 50% ▲ 5.00%
- Median HH income
- $44,506
- Composite
- 39.33/100
- National rank
- #3984
- State rank
- #451 of 590 in NY
Livability — Port Jervis
- Score
- 69/100
- State rank
- #475
- US rank
- #8376
Category grades
Schools grade is shown separately in the Schools card above.
Census & demographics
- Census place
- Port Jervis, NY
- County
- Orange County · 267,004 people
- City population
- 14,049
- Metro
- Poughkeepsie-Newburgh-Middletown, NY
- Population (ZIP)
- 14,049
- Household income
- $68,136
- Rent vs Own
- Severe rent burden
- 792.0
Population outlook (Orange County) Hauer SSP2
- Today (2025)
- 379,830 people
- By 2030
- 378,955 · -0.2%
- By 2040
- 375,444 · -1.2%
- By 2050
- 369,311 · -2.8%
- By 2075
- 354,233 · -6.7%
- By 2100
- 318,150 · -16.2%
Race, ethnicity, and origin ACS 2023
- Neighborhood character
- Predominantly White (67%)
- Race & ethnicity
- White 67% Hispanic / Latino 18% Two or more races 11% Black 6% Asian 3% Native American 3%
- Hispanic origin (detail)
- Mexican 3% Puerto Rican 8% Dominican 2%
- Common ancestry
- Romanian 5% Iranian 4% Lithuanian 3%
- Foreign-born
- 10% · Canada, China, Jamaica
- Languages at home
- 84% English-only · Spanish 10% Other Indo-European 3% Chinese 2%
Political lean MEDSL · Orange
- 2024 margin
- Lean R (+8.4) · D 45.8% · R 54.2%
- 2008→2024 swing
- -12.5pp toward R · 2008: 4.1pp · 2024: -8.4pp
- All cycles
- 2024: R+8.4 2020: R+0.2 2016: R+6.5 2012: D+5.2 2008: D+4.1
Not yet ingested
- Civics
- —
Market trends
- HPI YoY
- ▼ -75.78%
- Current HPI
- 301.5132
- Rent YoY
- —
- Metro
- Poughkeepsie-Newburgh-Middletown, NY
- State GDP YoY
- ▲ 2.60%
- F500 in state
- 92
Industry mix (Fortune 500 HQ in NY)
| Industry | F500 HQs | Revenue |
|---|---|---|
| Financial Services | 10 | $950B |
|
||
| Consumer Goods | 9 | $162B |
|
||
| Insurance | 4 | $225B |
|
||
| Telecommunications | 2 | $144B |
|
||
| Pharmaceuticals | 2 | $112B |
|
||
| Media / Entertainment | 2 | $69B |
|
||
Price history
+457.4% since first listed13 events — show timeline
- 2026-06-01 Pending — OneKey® MLS as Distributed by MLS Grid
- 2026-04-06 Listed $199,000 OneKey® MLS as Distributed by MLS Grid
- 2017-07-20 Listing Removed — OneKey® MLS as Distributed by MLS Grid
- 2017-04-14 Price Changed $119,900 OneKey® MLS as Distributed by MLS Grid
- 2016-12-07 Price Changed $129,900 OneKey® MLS as Distributed by MLS Grid
- 2016-10-19 Listed $134,900 OneKey® MLS as Distributed by MLS Grid
- 2013-12-18 Price Changed $82,500 HGMLS
- 2004-01-15 Sold (Public Records) $97,000 Public Records
- 2004-01-14 Sold (MLS) $97,000 HGMLS
- 2002-11-19 Delisted — HGMLS
- 2002-09-13 Listed $97,000 HGMLS
- 2002-03-19 Sold (Public Records) $44,000 Public Records
- 1984-07-24 Sold (Public Records) $35,700 Public Records
Property tax history
+0.2%/yrLatest (2025): $3,528 · +6.3% YoY. Source: county tax records.
Cash-flow waterfall
monthlySold comps — $/sqft
last 12 mo · ≤1 miLoading sold comps…