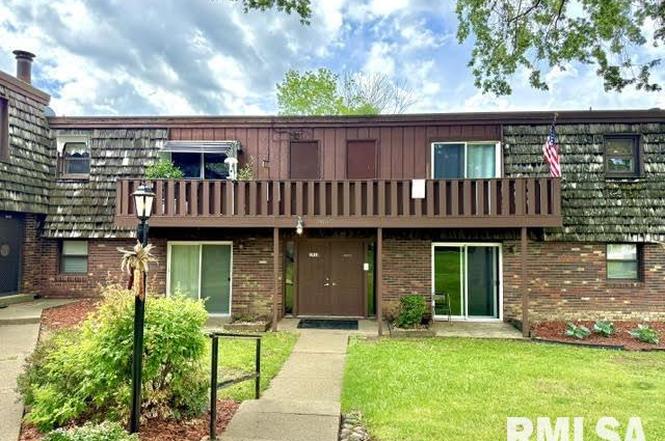
1910 Jeanette Ln #8 · Springfield, IL
Flood risk 1/10 · Minimal
- FEMA flood zone
- X (unshaded)
- Chance of flooding over 30 yrs
- 0.0%
- Est. flood insurance / yr
- $473 – $860
Fire risk 1/10 · Minimal
- Est. fire insurance / yr
- $804 – $1,492
Heat risk 4/10 · Minor
- Hot days now (above 105°F)
- 7 days/yr
- Hot days in 30 yrs
- 20 days/yr
Wind risk 2/10 · Minimal
- Chance of severe wind over 30 yrs
- 1.0%
Air-quality risk 2/10 · Minimal
- Unhealthy air days now
- 1 days/yr
- Unhealthy air days in 30 yrs
- 2 days/yr
Risk factors via First Street. Map © Google.
Why this score? — see what drove the C grade
The composite is a weighted blend of 9 inputs, each scored 0–100. Each bar is that input's sub-score; the figure is the points it added to the 100-point composite (weight × sub-score).
- Cash flow +22.6/30.0
- 1% rule +10.0/10.0
- ARV discount +7.5/15.0
- DSCR +7.2/10.0
- Livability +4.0/5.0
- Rent growth +3.7/5.0
- Condition / age +2.5/5.0
- Schools +1.7/10.0
- Appreciation +0.0/10.0
$69,900
🖨 Deal sheet 📄 Offer letter ✓ Due diligence
Listing remarks MLS
2 Bed, 2 bath with master en suite. Great location near shopping and restaurants. Spacious living room overlooking private balcony. Laundry on site. One parking spot in garage. Extra parking outside.
Key facts
- Underground parking
- New furnace
- New water heater
Tags
Property features AI
Finance
- HOA & community: Association fee of 224
Exterior
- Parking: Attached 1-car garage
- Utilities: Public water; Public sewer
- Home design: Single family residence; Entry level 2; Built in 1972; Property is attached
- Construction: Built in 1972
- Exterior features: Shingle roof; Irregular lot shape; Other lot features
Interior
- Kitchen: Kitchen includes refrigerator and dishwasher
- Bedrooms: 2 bedrooms; Primary bedroom has an egress window; Second bedroom has an egress window
- Flooring: Main living areas with laminate, carpet and vinyl flooring
- Bathrooms: 2 full bathrooms
- Heating & cooling: Central air conditioning; Forced air heating
- Interior features: Dishwasher; Refrigerator; Washer; Dryer; No basement
- Laundry & utility: Washer and dryer included
Neighborhood map
What this means for you Summary
Snapshot
- This is a 2-bed/2.0-bath other listed at $70k.
Deal economics
- At list price, monthly cash flow is $119 ($1k/yr) — positive.
- The deal already cash-flows at list — no discount required.
- Meets the 1% rule at list price ($1k rent vs $70k).
- Cap rate 8.3% vs local median 4.9% in Springfield — top-decile yield for the area; either an underpriced asset or a hidden risk that comps aren't pricing in. Stress-test before assuming the spread holds.
Location & tenants
- Location reads 79/100 on livability (#122 in IL, #2,138 nationally) — a middle-class / working-renter tenant base. Strengths: amenities A+, commute A+, cost of living A+; Watch: schools D+, crime F.
- Springfield SD 186 (urban): math 17% / reading 22% proficiency, ranked #438 of 620 in IL (top 71%) — low school quality limits family demand, transient renter base, plan for 1-2y turnover; 64% free/reduced lunch — lower-income household profile, screen leases tightly.
- Market conditions: Rents rising fast (+5.0%/yr); 131 active listings in the ZIP; 9 comparable units currently listed for rent nearby; rentals at typical pace (median 21d on market — plan ~3-4 weeks tenant-placement turnaround); 44% of comp listings sitting > 30 days — soft ceiling on asking rent; 225 units permitted in Sangamon County in 2024 (48 in 5+ unit buildings).
Forward outlook
- Local home prices are declining (-3.0%/yr); year-one equity from $483 of loan paydown is wiped out by about $2k of value loss. Plan a longer hold.
- Sangamon County population projected to shrink 9% by 2050 — rents likely to lag national; underwrite the cash flow, not the appreciation.
- At projected returns (-3.0% appreciation + 5.0% rent growth), your $20k cash investment doubles in ~10 years — after that, you're playing with house money.
Negotiation context
- Only 1 days on market — expect competitive offers; lowballing is unlikely to land.
- 2 sale attempts since 17y ago; this cycle's ask is 56% above the opening price — seller raised mid-cycle; expect resistance to lowballs.
- Current owner paid $42k; list at $70k implies a 64% gain — meaningful room to come down on a strong offer.
Risks & watch-outs
- Watch-outs: HOA is 21% of rent.
Questions for the listing agent
- Built in 1972 — when were the roof, HVAC, electrical panel, plumbing, and water heater last replaced?
- What does the HOA fee cover, when was the last increase, and are there any pending special assessments or reserve-fund shortfalls?
- Is there a deadline driving the sale (1031 exchange, divorce, estate, relocation)? That informs how much negotiation room exists.
- Schools are D-rated, which usually means shorter tenancies and higher turnover. Who's the typical renter profile here, and what's been the actual vacancy rate?
- Crime grade is F in this area — have there been break-ins, vandalism, or insurance claims at this property in the last 3 years? What carrier currently insures it and at what premium?
- What's the average days-on-market for RENTAL listings here right now (not sales)? A rising rental-DOM trend means longer vacancies and softer asking-rent achievability than the comps imply.
- What's the recent tenant-quality profile in this submarket — average credit score on applications, eviction rate, late-payment / NSF rate, and stable-employment percentage? A property-management company in the area should have these aggregated.
- How much new for-sale + rental construction is in the pipeline within 1–3 miles? Heavy new supply typically softens prices + rents 12–24 months out; constrained supply supports both.
Investment metrics
- 1% rule
- 1.56% ✓
- Cap rate
- 8.33%
- Cash-on-cash
- 7.29%
- DSCR
- 1.32
- GRM
- 5.3
CMA / ARV
No comps found within radius.
Projected returns pro-forma
-3.0% appreciation · 4.95% rent growth · sell at horizon
- IRR
- -1.8%
- Equity multiple
- 0.93×
- Total profit
- $-1,393
- Equity at exit
- $10,422
- IRR
- 10.8%
- Equity multiple
- 1.95×
- Total profit
- $18,584
- Equity at exit
- $6,044
Cash invested: $19,572 (down + closing). Projections, not guarantees.
Landlord ↔ Tenant lean methodology
- Overall (STATE)
- 43 Moderately Tenant-Leaning
- State Illinois
- 43 Moderately Tenant-Leaning · D+7
- County
- — inherits STATE
- City
- — inherits STATE
ZIP-level market 62702
- Home prices YoY
- -34.9%
- Rents YoY
- 5.0%
- Active inventory
- 131
- Price-to-rent
- 5.3×
Monthly cashflow live
- Estimated rent
- $1,092 high interval (Pro) →
- Mortgage (P&I)
- −$367
- Tax from tax record
- −$124 /mo · $1,489/yr
- Insurance
- −$29
- HOA
- −$224
- Vacancy / Maint / Mgmt
- −$229
- Net cashflow
- $119
Break-even live
UW: 25.0% down · 7.5% · 30yr · 1.5% tax · 5.0% vac · 8.0% maint · 8.0% mgmt
Financing live
Cash to close
- Down payment
- $17,475
- Closing costs
- $2,097
- Reserves months
- —
- Total cash needed
- —
Loan-product check · same deal, 3 products live
Conventional
25% down · 7.5% · 30yr
- Down + closing
- —
- Monthly P&I
- —
- Monthly cashflow
- —
- DSCR
- —
- Eligible?
- —
Personal DTI + credit; lowest rate.
DSCR
20% down · 8.5% · 30yr
- Down + closing
- —
- Monthly P&I
- —
- Monthly cashflow
- —
- DSCR
- —
- Eligible?
- —
No personal income docs; deal must DSCR.
Hard money
10% down · 12.0% · 12mo
- Down + closing
- —
- Monthly P&I
- —
- Monthly cashflow
- —
- DSCR
- —
- Eligible?
- —
Short-term bridge; refi at stabilization.
Rent comps 9 comps
| Address | Beds | Baths | Sqft | Rent | $/sqft | DOM | Units | Dist |
|---|---|---|---|---|---|---|---|---|
| 1644 W Adams St Unit 1 Springfield, IL | 2.0 | 1.0 | 950 | $1,200 | $1.26 | 43d | 1 | 0.41mi |
| 1539 W Monroe St Springfield, IL | 2.0 | 1.0 | 820 | $2,000 | $2.44 | 21d | 1 | 0.54mi |
| 300 N Park Ave Springfield, IL | 1.0–2.0 | 1.0 | 694 | $1,035 | $1.49 | 21d | 1 | 0.70mi |
| 216 N Lincoln Ave Springfield, IL | 2.0 | 1.0 | 800 | $1,200 | $1.50 | 43d | 1 | 0.82mi |
| 424 S Durkin Dr Springfield, IL | 2.0 | 1.0 | 885 | $925 | $1.05 | 21d | 1 | 0.98mi |
| 203 N Glenwood Ave Springfield, IL | 2.0 | 1.0 | 850 | $1,000 | $1.18 | 21d | 1 | 1.21mi |
| 924 Clocktower Dr Unit 4 Springfield, IL | 1.0 | 1.0 | 1000 | $800 | $0.80 | 43d | 1 | 1.22mi |
| 1030 N MacArthur Blvd Springfield, IL | 2.0 | 1.0 | 1400 | $1,350 | $0.96 | 21d | 1 | 1.25mi |
| 629 W Washington St Unit 4 Springfield, IL | 2.0 | 1.0 | 700 | $800 | $1.14 | 43d | 1 | 1.37mi |
HOA detail
- Monthly dues
- $224 · $2,688/yr
Listing history 5 events
-
2026-06-19status $69,900 Pending 1 DOM
-
2026-06-18statusdays on market $69,900 Active 1 DOM
-
2026-06-18days on market $69,900 Coming Soon 2 DOM
-
2026-06-17remarks 687-char remark
-
2026-06-17$69,900 Coming Soon 1 DOM
ⓘ Source: listings_history table (triggers on properties + properties_extension) + one-shot
backfill from property_details.listing_events for pre-trigger history.
Tax reassessment forecast IL · Partial reset (capped growth)
- Current annual tax
- $1,489 · $124/mo
- Projected year-2 tax
- $1,538 · $128/mo
- Expected delta
- +$49/yr (+$4/mo · 3.3%)
ⓘ Screening estimate from a state-policy table — verify with the county assessor before closing.
Climate risk First Street
- Flood 1/10 Low FEMA zone X (unshaded) · 0% chance over 30 yrs
- Wildfire 1/10 Low
- Heat 4/10 Moderate 7 d/yr ≥105°F today · 20 d/yr by 30 yrs out
- Wind 2/10 Low 100% chance of damaging wind over 30 yrs
- Air quality 2/10 Low 1 unhealthy d/yr today · 2 by 30 yrs out
Nearby sold comps map
Loading sold comps map…
Walkable amenities ~0.75 mi
Loading nearby amenities…
Taxation est. · year 1
- Rental income
- $13,104
- − Mortgage interest
- −$3,915
- − Property taxes
- −$1,489
- − Insurance
- −$350
- − Repairs & maintenance
- −$1,048
- − Management
- −$1,048
- − HOA
- −$2,688
- − Depreciation
- −$2,033
- Taxable income
- $532
- Est. tax owed @ 24.0%
- −$128
- After-tax cash flow
- $1,299/yr
For passive investors: Depreciation is non-cash, so a rental often shows a tax loss while cash-flowing — sheltering income. Rental losses are passive: they offset passive income freely, and up to $25,000/yr can offset ordinary (W-2) income if you actively participate and your MAGI is under $100k (phasing out to $0 by $150k); unused losses carry forward. On sale, claimed depreciation is recaptured at up to 25%, and gains may owe capital-gains tax (a 1031 exchange can defer both). Figures are a year-1 estimate at your 24.0% rate — not tax advice; consult a CPA.
Schools (NCES district)
- District
- Springfield SD 186
- NCES district ID
- 1737080
- Math proficiency
- 17% ▼ -7.00%
- Reading proficiency
- 22% ▼ -5.00%
- Median HH income
- $43,744
- Composite
- 16.89/100
- National rank
- #9142
- State rank
- #438 of 620 in IL
Livability — Springfield
- Score
- 79/100
- State rank
- #122
- US rank
- #2138
Category grades
Schools grade is shown separately in the Schools card above.
Census & demographics
- Census place
- Springfield, IL
- County
- Sangamon County · 115,414 people
- City population
- 59,955
- Metro
- Springfield, IL
- Population (ZIP)
- 31,033
- Household income
- $51,136
- Rent vs Own
- Severe rent burden
- 1230.0
Population outlook (Sangamon County) Hauer SSP2
- Today (2025)
- 198,317 people
- By 2030
- 196,127 · -1.1%
- By 2040
- 188,664 · -4.9%
- By 2050
- 179,624 · -9.4%
- By 2075
- 155,027 · -21.8%
- By 2100
- 122,588 · -38.2%
Race, ethnicity, and origin ACS 2023
- Neighborhood character
- Predominantly White (72%)
- Race & ethnicity
- White 72% Black 17% Two or more races 8% Hispanic / Latino 3%
- Common ancestry
- Romanian 2% Slovak 2% Serbian 1%
- Foreign-born
- 2% · Canada
- Languages at home
- 96% English-only · Spanish 1% French/Haitian/Cajun 1% Other Indo-European 1%
Political lean MEDSL · Sangamon
- 2024 margin
- Toss-up / Even · D 46.6% · R 51.6% · Other 1.8%
- 2008→2024 swing
- -9.3pp toward R · 2008: 4.4pp · 2024: -5.0pp
- All cycles
- 2024: R+5.0 2020: R+4.4 2016: R+9.4 2012: R+8.7 2008: D+4.4
Not yet ingested
- Civics
- —
Market trends
- HPI YoY
- ▼ -79.98%
- Current HPI
- 149.1926
- Rent YoY
- ▲ 4.95%
- Metro
- Springfield, IL
- State GDP YoY
- ▲ 1.59%
- F500 in state
- 60
Industry mix (Fortune 500 HQ in IL)
| Industry | F500 HQs | Revenue |
|---|---|---|
| Insurance | 4 | $201B |
|
||
| Consumer Goods | 4 | $87B |
|
||
| Industrial Machinery | 3 | $64B |
|
||
| Healthcare | 2 | $55B |
|
||
| Retail / Pharmacy | 1 | $148B |
|
||
| Agriculture / Food | 1 | $86B |
|
||
Price history
+44.1% since first listed9 events — show timeline
- 2026-06-16 Coming Soon $69,900 RMLSA as Distributed by MLS Grid
- 2021-12-17 Sold (MLS) $42,500 RMLSA as Distributed by MLS Grid
- 2021-11-05 Listed $44,900 RMLSA as Distributed by MLS Grid
- 2019-08-07 Sold (Public Records) $40,500 Public Records
- 2009-08-10 Sold (Public Records) $54,500 Public Records
- 2009-08-03 Sold (MLS) $54,500 RMLSA as Distributed by MLS Grid
- 2009-02-02 Listed $58,500 RMLSA as Distributed by MLS Grid
- 2001-05-07 Sold (Public Records) $46,100 Public Records
- 1998-08-04 Sold (Public Records) $48,500 Public Records
Property tax history
+3.2%/yrLatest (2025): $1,489 · +3.3% YoY. Source: county tax records.
Cash-flow waterfall
monthlySold comps — $/sqft
last 12 mo · ≤1 miLoading sold comps…