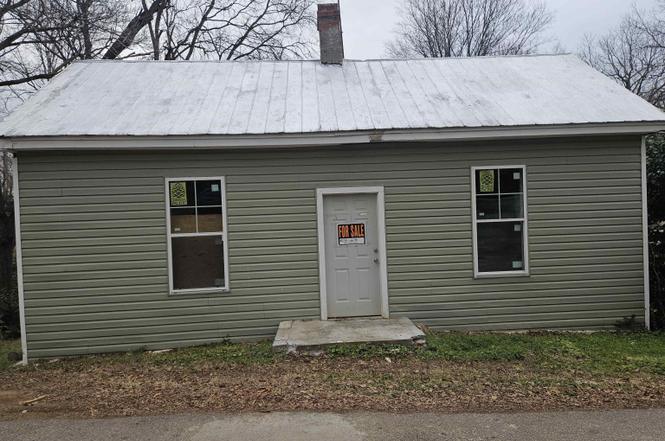
102 Pine St · Laurens, SC
Flood risk 7/10 · Major
- FEMA flood zone
- X (unshaded)
- Chance of flooding over 30 yrs
- 0.78%
- Est. flood insurance / yr
- $507 – $1,088
Fire risk 3/10 · Minor
- Est. fire insurance / yr
- $783 – $1,453
Heat risk 6/10 · Moderate
- Hot days now (above 106°F)
- 7 days/yr
- Hot days in 30 yrs
- 16 days/yr
Wind risk 4/10 · Minor
- Chance of severe wind over 30 yrs
- 10.0%
Air-quality risk 3/10 · Minor
- Unhealthy air days now
- 3 days/yr
- Unhealthy air days in 30 yrs
- 3 days/yr
Risk factors via First Street. Map © Google.
Why this score? — see what drove the B- grade
The composite is a weighted blend of 9 inputs, each scored 0–100. Each bar is that input's sub-score; the figure is the points it added to the 100-point composite (weight × sub-score).
- Cash flow +30.0/30.0
- 1% rule +10.0/10.0
- DSCR +10.0/10.0
- ARV discount +7.5/15.0
- Livability +3.4/5.0
- Rent growth +2.5/5.0
- Condition / age +2.5/5.0
- Schools +2.1/10.0
- Appreciation +0.0/10.0
$66,000
🖨 Deal sheet (PDF) 📄 Offer letter ✓ Due diligence
Listing remarks
Property is AS-IS * * * Price drop! * * *
Key facts
- 0.24 acre lot
- Listed 121 days
Property features AI
Finance
- HOA & community: No HOA amenities or fees listed
Exterior
- Parking: No garage
- Utilities: Public water; Public sewer; Water heater: Other (see remarks); No garbage pickup listed
- Home design: Single-story home; Approximately 21–30 years old; Wood foundation
- Construction: Wood construction
- Exterior features: Metal roof; Wood exterior finish; Creek on lot; Lot slopes gently
Interior
- Kitchen: Kitchen approx. size 5 x 8; No appliances listed
- Bedrooms: One bedroom on the main level; Primary bedroom features: Other/See remarks; Primary bedroom approx. size 19 x 25
- Flooring: Hardwood floors
- Heating & cooling: No heat; No cooling
- Interior features: Cable available; One fireplace
- Laundry & utility: No laundry inside
Neighborhood map
What this means for you Summary
Snapshot
- This is a 1-bed/?-bath other listed at $66k.
Deal economics
- At list price, monthly cash flow is $479 ($6k/yr) — positive.
- The deal already cash-flows at list — no discount required.
- Meets the 1% rule at list price ($1k rent vs $66k).
- Recommended offer: $58k (12.0% below list) — sets the bar for market timing.
- Cap rate 16.2% vs local median 3.5% in Laurens — top-decile yield for the area; either an underpriced asset or a hidden risk that comps aren't pricing in. Stress-test before assuming the spread holds.
Location & tenants
- Location reads 68/100 on livability (#79 in SC) — a middle-class / working-renter tenant base. Strengths: cost of living A+, housing A+, health & safety A+; Watch: amenities D+, employment D, crime F.
- Laurens 55 (rural): math 20% / reading 29% proficiency, ranked #63 of 80 in SC (top 79%) — low school quality limits family demand, transient renter base, plan for 1-2y turnover; 62% free/reduced lunch — lower-income household profile, screen leases tightly.
- Zoned schools: Ford Elementary (math 12% / reading 17%, grade F, #553 of 597 statewide, top 95%, 416 students, 100% FRL) — zoned schools average 100% FRL vs 62% district-wide (38 pts higher); higher-poverty schools than district average — tighter screening recommended.
- Market conditions: 153 active listings in the ZIP; 621 units permitted in Laurens County in 2024 (0 in 5+ unit buildings).
Forward outlook
- Local home prices are declining (-3.0%/yr); year-one equity from $456 of loan paydown is wiped out by about $2k of value loss. Plan a longer hold.
- Laurens County population projected to shrink 7% by 2050 — rents likely to lag national; underwrite the cash flow, not the appreciation.
- At projected returns (-3.0% appreciation + 3.0% rent growth), your $18k cash investment doubles in ~4 years — after that, you're playing with house money.
Negotiation context
- It's been on market 122 days — a 12% lower offer ($58k) is reasonable based on typical stale-listing flexibility.
- Current owner paid $25k; list at $66k implies a 164% gain — meaningful room to come down on a strong offer.
Risks & watch-outs
- Watch-outs: flood insurance adds $66/mo.
- Climate carrying-cost: major flood risk; extreme-heat days projected 7→16/yr by 2055 (HVAC capex compounding) — expect insurance premiums to compound above CPI over the hold.
Questions for the listing agent
- It's been on market 122 days. Have you received any prior offers? Is the seller open to a 12% concession, seller financing, or rate buy-down credit?
- What's the actual annual flood-insurance premium (NFIP or private), and is the property in a SFHA with mandatory coverage?
- Why hasn't it sold? Are there any deal-killer items the seller is aware of (foundation, flood, title, zoning, code violations)?
- Is there a deadline driving the sale (1031 exchange, divorce, estate, relocation)? That informs how much negotiation room exists.
- Schools are F-rated, which usually means shorter tenancies and higher turnover. Who's the typical renter profile here, and what's been the actual vacancy rate?
- Crime grade is F in this area — have there been break-ins, vandalism, or insurance claims at this property in the last 3 years? What carrier currently insures it and at what premium?
- What's the average days-on-market for RENTAL listings here right now (not sales)? A rising rental-DOM trend means longer vacancies and softer asking-rent achievability than the comps imply.
- What's the recent tenant-quality profile in this submarket — average credit score on applications, eviction rate, late-payment / NSF rate, and stable-employment percentage? A property-management company in the area should have these aggregated.
- How much new for-sale + rental construction is in the pipeline within 1–3 miles? Heavy new supply typically softens prices + rents 12–24 months out; constrained supply supports both.
Investment metrics
- 1% rule
- 1.84% ✓
- Cap rate
- 16.22%
- Cash-on-cash
- 35.45%
- DSCR
- 2.58
- GRM
- 4.5
CMA / ARV
No comps found within radius.
Projected returns pro-forma
-3.0% appreciation · 3.0% rent growth · sell at horizon
- IRR
- 26.0%
- Equity multiple
- 2.08×
- Total profit
- $19,870
- Equity at exit
- $9,841
- IRR
- 33.6%
- Equity multiple
- 4.07×
- Total profit
- $56,746
- Equity at exit
- $5,706
Cash invested: $18,480 (down + closing). Projections, not guarantees.
Landlord ↔ Tenant lean methodology
- Overall (STATE)
- 90 Strongly Landlord-Friendly
- State South Carolina
- 90 Strongly Landlord-Friendly · R+6
- County
- — inherits STATE
- City
- — inherits STATE
ZIP-level market 29360
- Home prices YoY
- -23.7%
- Active inventory
- 153
- Price-to-rent
- 4.5×
Monthly cashflow live
- Estimated rent
- $1,211 medium interval (Pro) →
- Mortgage (P&I)
- −$346
- Tax from tax record
- −$38 /mo · $451/yr
- Insurance
- −$28
- Flood insurance flood zone
- −$66 /mo · $798/yr
- HOA
- −$0
- Vacancy / Maint / Mgmt
- −$254
- Net cashflow
- $479
Break-even live
Sensitivity live
| Price | -10% $517 | -5% $498 | +0% $479 | +5% $461 | +10% $442 |
|---|---|---|---|---|---|
| Rent | -10% $384 | -5% $432 | +0% $479 | +5% $527 | +10% $575 |
| Rate | -1.0pp $513 | -0.5pp $496 | base $479 | +0.5pp $462 | +1.0pp $445 |
UW: 25.0% down · 7.5% · 30yr · 1.5% tax · 5.0% vac · 8.0% maint · 8.0% mgmt
Financing live
Cash to close
- Down payment
- $16,500
- Closing costs
- $1,980
- Reserves months
- —
- Total cash needed
- —
Loan-product check · same deal, 3 products live
Conventional
25% down · 7.5% · 30yr
- Down + closing
- —
- Monthly P&I
- —
- Monthly cashflow
- —
- DSCR
- —
- Eligible?
- —
Personal DTI + credit; lowest rate.
DSCR
20% down · 8.5% · 30yr
- Down + closing
- —
- Monthly P&I
- —
- Monthly cashflow
- —
- DSCR
- —
- Eligible?
- —
No personal income docs; deal must DSCR.
Hard money
10% down · 12.0% · 12mo
- Down + closing
- —
- Monthly P&I
- —
- Monthly cashflow
- —
- DSCR
- —
- Eligible?
- —
Short-term bridge; refi at stabilization.
Listing history 19 events
-
2026-06-19days on market $66,000 Active 122 DOM
-
2026-06-18days on market $66,000 Active 121 DOM
-
2026-06-17days on market $66,000 Active 120 DOM
-
2026-06-16days on market $66,000 Active 119 DOM
-
2026-06-15days on market $66,000 Active 118 DOM
-
2026-06-14days on market $66,000 Active 116 DOM
-
2026-06-12days on market $66,000 Active 115 DOM
-
2026-06-09days on market $66,000 Active 112 DOM
-
2026-06-08days on market $66,000 Active 111 DOM
-
2026-06-07days on market $66,000 Active 110 DOM
-
2026-06-07days on market $66,000 Active 109 DOM
-
2026-06-03days on market $66,000 Active 106 DOM
-
2026-06-02remarks 46-char remark
-
2026-06-02pricedays on market $66,000 Active 105 DOM
-
2026-06-01days on market $69,600 Active 104 DOM
-
2026-05-31days on market $69,600 Active 103 DOM
-
2026-05-30days on market $69,600 Active 102 DOM
-
2026-02-16$69,600 Active
-
2010-11-19soldstatus $25,000
ⓘ Source: listings_history table (triggers on properties + properties_extension) + one-shot
backfill from property_details.listing_events for pre-trigger history.
Tax reassessment forecast SC · Resets to sale price
- Current annual tax
- $451 · $38/mo
- Projected year-2 tax
- $451 · $38/mo
- Expected delta
- $0/yr ($0/mo · 0.0%)
ⓘ Screening estimate from a state-policy table — verify with the county assessor before closing.
Climate risk First Street
- Flood 7/10 Severe FEMA zone X (unshaded) · 78% chance over 30 yrs
- Wildfire 3/10 Moderate
- Heat 6/10 Major 7 d/yr ≥106°F today · 16 d/yr by 30 yrs out
- Wind 4/10 Moderate 10% chance of damaging wind over 30 yrs
- Air quality 3/10 Moderate 3 unhealthy d/yr today · 3 by 30 yrs out
Nearby sold comps map
Loading sold comps map…
Walkable amenities ~0.75 mi
Loading nearby amenities…
Taxation est. · year 1
- Rental income
- $14,537
- − Mortgage interest
- −$3,697
- − Property taxes
- −$451
- − Insurance
- −$1,128
- − Repairs & maintenance
- −$1,163
- − Management
- −$1,163
- − Depreciation
- −$1,920
- Taxable income
- $5,016
- Est. tax owed @ 24.0%
- −$1,204
- After-tax cash flow
- $4,549/yr
For passive investors: Depreciation is non-cash, so a rental often shows a tax loss while cash-flowing — sheltering income. Rental losses are passive: they offset passive income freely, and up to $25,000/yr can offset ordinary (W-2) income if you actively participate and your MAGI is under $100k (phasing out to $0 by $150k); unused losses carry forward. On sale, claimed depreciation is recaptured at up to 25%, and gains may owe capital-gains tax (a 1031 exchange can defer both). Figures are a year-1 estimate at your 24.0% rate — not tax advice; consult a CPA.
Schools (NCES district)
- District
- Laurens 55
- NCES district ID
- 4502610
- Math proficiency
- 20% ▼ -11.00%
- Reading proficiency
- 29% ▼ -7.00%
- Median HH income
- $39,174
- Composite
- 20.58/100
- National rank
- #8555
- State rank
- #63 of 80 in SC
Livability — Laurens
- Score
- 68/100
- State rank
- #79
- US rank
- #9104
Category grades
Schools grade is shown separately in the Schools card above.
Census & demographics
- Census place
- Laurens, SC
- City population
- 22,066
- Population (ZIP)
- 22,066
Population outlook (Laurens County) Hauer SSP2
- Today (2025)
- 66,741 people
- By 2030
- 66,454 · -0.4%
- By 2040
- 64,881 · -2.8%
- By 2050
- 61,941 · -7.2%
- By 2075
- 53,266 · -20.2%
- By 2100
- 41,495 · -37.8%
Race, ethnicity, and origin ACS 2023
- Neighborhood character
- Diverse neighborhood (Simpson 0.55)
- Race & ethnicity
- White 61% Black 26% Hispanic / Latino 7% Two or more races 5% Native American 2%
- Hispanic origin (detail)
- Mexican 3%
- Common ancestry
- Slovak 2% Danish 1% Serbian 1%
- Foreign-born
- 6% · Canada
- Languages at home
- 94% English-only · Spanish 4%
Political lean MEDSL · Laurens
- 2024 margin
- Solid R (+40.9) · D 29.0% · R 69.9% · Other 1.1%
- 2008→2024 swing
- -22.8pp toward R · 2008: -18.1pp · 2024: -40.9pp
- All cycles
- 2024: R+40.9 2020: R+32.3 2016: R+29.9 2012: R+17.5 2008: R+18.1
Not yet ingested
- Civics
- —
Market trends
- HPI YoY
- ▼ -60.09%
- Current HPI
- 193.5371
- Rent YoY
- —
- Metro
- —
- State GDP YoY
- ▲ 4.51%
- F500 in state
- 2
Industry mix (Fortune 500 HQ in SC)
| Industry | F500 HQs | Revenue |
|---|---|---|
| Packaging | 1 | $7B |
|
||
Price history
+178.4% since first listed2 events — show timeline
- 2026-02-16 Listed $69,600 Greater Greenville MLS
- 2010-11-19 Sold (Public Records) $25,000 Public Records
Property tax history
+9.6%/yrLatest (2025): $451 · +19.2% YoY. Source: county tax records.
Cash-flow waterfall
monthlySold comps — $/sqft
last 12 mo · ≤1 miLoading sold comps…