 Triplex
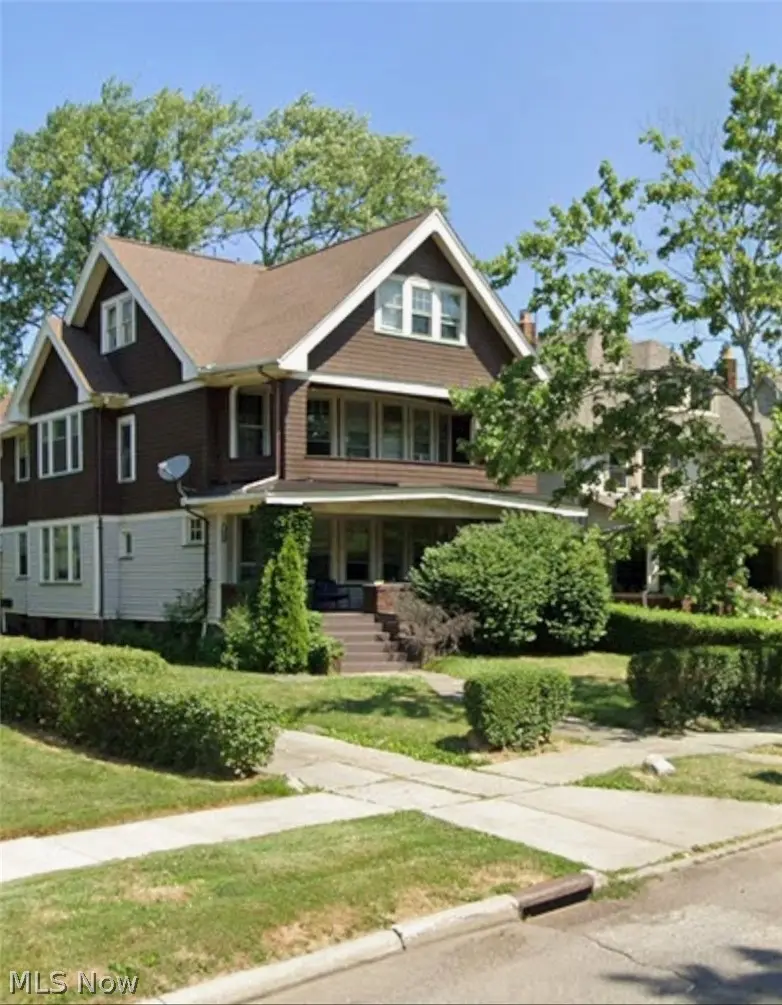
2609 Hampshire Rd · Cleveland Heights, OH
Flood risk 1/10 · Minimal
- FEMA flood zone
- X (unshaded)
- Chance of flooding over 30 yrs
- 0.0%
- Est. flood insurance / yr
- $507 – $1,088
Fire risk 1/10 · Minimal
- Est. fire insurance / yr
- $713 – $1,323
Heat risk 3/10 · Minor
- Hot days now (above 95°F)
- 7 days/yr
- Hot days in 30 yrs
- 16 days/yr
Wind risk 1/10 · Minimal
- Chance of severe wind over 30 yrs
- —
Air-quality risk 3/10 · Minor
- Unhealthy air days now
- 3 days/yr
- Unhealthy air days in 30 yrs
- 5 days/yr
Risk factors via First Street. Map © Google.
Why this score? — see what drove the C grade
The composite is a weighted blend of 9 inputs, each scored 0–100. Each bar is that input's sub-score; the figure is the points it added to the 100-point composite (weight × sub-score).
- Cash flow +25.9/30.0
- DSCR +8.7/10.0
- 1% rule +7.2/10.0
- Livability +4.5/5.0
- Rent growth +3.6/5.0
- Schools +2.8/10.0
- Condition / age +2.5/5.0
- ARV discount +0.0/15.0
- Appreciation +0.0/10.0
$389,900
🖨 Deal sheet (PDF) 📄 Offer letter ✓ Due diligence
Multi-family units
County records classify this as Multi-Family (2-4 Unit). Listing-text estimate: 3 units. confirmed
Listing remarks
Turn-key legal 3-family property on one of Cleveland Heights’ most desirable streets just minutes from Cleveland Clinic, University Circle, Case Western Reserve, and downtown Cleveland. Excellent opportunity for investors or owner-occupants looking for strong income potential and long-term appreciation. Major improvements within the last 5 years include new furnaces, new hot water tanks, fresh interior paint, and kitchen and bath updates. The third floor has been recently renovated to match the condition of the other units, creating a cohesive and well-maintained property throughout. Flexible income setup with one unit currently leased and two units operating as short-term rentals.
Key facts
- 8,960 sq ft lot
- 3 garage spots
- Built 1920
Property features AI
Finance
- Other: Annual tax information available
- Financial info: One building; Actual rent listed for one 3-bedroom unit: $1,300
Exterior
- Parking: Detached garage (3 garage spaces); Detached paved parking
- Utilities: Public water; Public sewer
- Home design: 3-story building
- Construction: Built as reported in public records; Brick, vinyl siding, and wood siding exterior; Shingle roof
- Exterior features: Paved parking; Lot about 0.21 acres; Above-grade finished area approximately 3,519
Interior
- Bedrooms: One 2-bedroom unit; Two 3-bedroom units
- Bathrooms: Three full bathrooms (total across property)
- Heating & cooling: Forced-air heating
- Interior features: Full unfinished basement
Neighborhood map
What this means for you Summary
Snapshot
- This is a 3 × 3-bed/1.0-bath units multifamily listed at $390k.
Deal economics
- At list price, monthly cash flow is $957 ($11k/yr) — positive. Per door: $319/mo.
- The deal already cash-flows at list — no discount required.
- Meets the 1% rule at list price ($5k rent vs $390k).
- Recommended offer: $367k (6.0% below list) — sets the bar for market timing.
- Cap rate 9.2% vs local median 4.3% in Cleveland Heights — top-decile yield for the area; either an underpriced asset or a hidden risk that comps aren't pricing in. Stress-test before assuming the spread holds.
Location & tenants
- Location reads 89/100 on livability (#12 in OH, #124 nationally) — a professional / high-income tenant draw. Strengths: amenities A+, commute A+, cost of living A+.
- Cleveland Heights-University Heights City (suburban): math 23% / reading 41% proficiency, ranked #568 of 656 in OH (top 87%) — families likely to look elsewhere, expect single-tenant / working-renter base with shorter leases; 64% free/reduced lunch — lower-income household profile, screen leases tightly.
- Zoned schools: Cleveland Heights High School (math 12% / reading 46%, grade F, #627 of 781 statewide, top 81%, 1,664 students, 0% FRL) — zoned schools average 0% FRL vs 64% district-wide (64 pts lower); this property's tenant base skews higher-income than the district average.
- Market conditions: Rents rising fast (+4.2%/yr); 34 active listings in the ZIP; 1 comparable units currently listed for rent nearby; lower-income renter base — watch delinquency; 1,441 units permitted in Cuyahoga County in 2024 (700 in 5+ unit buildings).
- At $4,768/mo this rent would consume 133% of the median local household income ($43k/yr) (locally 2268% of renters already pay >50% of income on rent) — very limited rent-growth headroom before tenants either downsize or default.
Forward outlook
- Local home prices are declining (-3.0%/yr); year-one equity from $3k of loan paydown is wiped out by about $12k of value loss. Plan a longer hold.
- Cuyahoga County population projected to shrink 8% by 2050 — rents likely to lag national; underwrite the cash flow, not the appreciation.
- At projected returns (-3.0% appreciation + 4.2% rent growth), your $109k cash investment doubles in ~9 years — after that, you're playing with house money.
Negotiation context
- It's been on market 72 days — a 6% lower offer ($367k) is reasonable based on typical stale-listing flexibility.
- 4 sale attempts since 6y ago with the ask held roughly flat each time — persistent listings suggest the price (not the market) is what's stuck; bring a comps-based counter.
- Current owner paid $148k; list at $390k implies a 163% gain — meaningful room to come down on a strong offer.
Risks & watch-outs
- Watch-outs: built in 1920 — expect roof / HVAC / electrical / plumbing capex.
Questions for the listing agent
- It's been on market 72 days. Have you received any prior offers? Is the seller open to a 6% concession, seller financing, or rate buy-down credit?
- Can we see the unit-by-unit rent roll, current vacancy, and any below-market leases? What's the average tenancy length?
- What capital expenditures (roof, boiler, parking lot, exteriors) have been made in the last 5 years, and what's planned in the next 2?
- Built in 1920 — when were the roof, HVAC, electrical panel, plumbing, and water heater last replaced?
- Why hasn't it sold? Are there any deal-killer items the seller is aware of (foundation, flood, title, zoning, code violations)?
- Is there a deadline driving the sale (1031 exchange, divorce, estate, relocation)? That informs how much negotiation room exists.
- Schools are A-rated — typically a magnet for longer-tenancy family renters. What's the average tenant stay here, and is there a school-zone premium baked into asking?
- What's the average days-on-market for RENTAL listings here right now (not sales)? A rising rental-DOM trend means longer vacancies and softer asking-rent achievability than the comps imply.
- What's the recent tenant-quality profile in this submarket — average credit score on applications, eviction rate, late-payment / NSF rate, and stable-employment percentage? A property-management company in the area should have these aggregated.
- How much new apartment / multifamily construction is in the pipeline within 1–3 miles? Heavy new supply (>2% of stock underway) typically softens rents 12–24 months out; light construction supports rent growth.
Investment metrics
- 1% rule
- 1.22% ✓
- Cap rate
- 9.24%
- Cash-on-cash
- 10.52%
- DSCR
- 1.47
- GRM
- 6.8
CMA / ARV
- ARV (on-the-fly)
- $309,672
- Comps found
- 4
Show comp detail 4 sales within ~0.75 mi
| Address | Dist | Beds/Ba | Sqft | Sold | Price | $/sf | Match |
|---|---|---|---|---|---|---|---|
| 2620 Mayfield Rd | 0.08mi | 7/3.0 | 3,313 (-6%) | 11mo | $330,000 | $100 | 78 |
| 1616 Eddington Rd | 0.71mi | 8/3.0 (+1) | 3,612 (+3%) | 16mo | $250,000 | $69 | 44 |
| 12783-85 Cedar Rd | 0.57mi | 8/5.0 (+1) | 3,170 (-10%) | 8mo | $215,000 | $68 | 38 |
| 2873 Hampshire Rd | 0.56mi | 8/5.0 (+1) | 3,840 (+9%) | 21mo | $339,100 | $88 | 28 |
Match score weights: distance 35% · size 25% · config 20% · recency 20%. Top-matched comps best support the ARV.
Projected returns pro-forma
-3.0% appreciation · 4.22% rent growth · sell at horizon
- IRR
- 0.9%
- Equity multiple
- 1.04×
- Total profit
- $3,832
- Equity at exit
- $58,135
- IRR
- 11.8%
- Equity multiple
- 1.98×
- Total profit
- $107,314
- Equity at exit
- $33,711
Cash invested: $109,172 (down + closing). Projections, not guarantees.
Landlord ↔ Tenant lean methodology
- Overall (STATE)
- 73 Landlord-Friendly
- State Ohio
- 73 Landlord-Friendly · R+6
- County
- — inherits STATE
- City
- — inherits STATE
ZIP-level market 44106
- Rents YoY
- 4.2%
- Active inventory
- 34
- Price-to-rent
- 20.4×
Monthly cashflow live
- Estimated rent
- $4,768 high interval (Pro) →
- Mortgage (P&I)
- −$2,045
- Tax from tax record
- −$603 /mo · $7,232/yr
- Insurance
- −$162
- HOA
- −$0
- Vacancy / Maint / Mgmt
- −$1,001
- Net cashflow
- $957
Break-even live
Sensitivity live
| Price | -10% $1,178 | -5% $1,067 | +0% $957 | +5% $847 | +10% $736 |
|---|---|---|---|---|---|
| Rent | -10% $580 | -5% $769 | +0% $957 | +5% $1,145 | +10% $1,334 |
| Rate | -1.0pp $1,153 | -0.5pp $1,056 | base $957 | +0.5pp $856 | +1.0pp $753 |
3-unit breakdown (identical units grouped — click to expand)
| Units | Beds | Baths | Est. rent |
|---|---|---|---|
| 3× units | 3 | 1 | $4,767 |
| #1 | 3 | 1 | $1,589 |
| #2 | 3 | 1 | $1,589 |
| #3 | 3 | 1 | $1,589 |
| Total (3 units) | $4,768 | ||
UW: 25.0% down · 7.5% · 30yr · 1.5% tax · 5.0% vac · 8.0% maint · 8.0% mgmt
Financing live
Cash to close
- Down payment
- $97,475
- Closing costs
- $11,697
- Reserves months
- —
- Total cash needed
- —
Loan-product check · same deal, 3 products live
Conventional
25% down · 7.5% · 30yr
- Down + closing
- —
- Monthly P&I
- —
- Monthly cashflow
- —
- DSCR
- —
- Eligible?
- —
Personal DTI + credit; lowest rate.
DSCR
20% down · 8.5% · 30yr
- Down + closing
- —
- Monthly P&I
- —
- Monthly cashflow
- —
- DSCR
- —
- Eligible?
- —
No personal income docs; deal must DSCR.
Hard money
10% down · 12.0% · 12mo
- Down + closing
- —
- Monthly P&I
- —
- Monthly cashflow
- —
- DSCR
- —
- Eligible?
- —
Short-term bridge; refi at stabilization.
Rent comps 1 comps
| Address | Beds | Baths | Sqft | Rent | $/sqft | DOM | Units | Dist |
|---|---|---|---|---|---|---|---|---|
| 2501 Euclid Heights Blvd Cleveland, OH | 6.0 | 5.0 | 3000 | $3,600 | $1.20 | 18d | 1 | 0.31mi |
Listing history 24 events
-
2026-06-21days on market $389,900 Active 72 DOM
-
2026-06-18days on market $389,900 Active 69 DOM
-
2026-06-17days on market $389,900 Active 68 DOM
-
2026-06-16days on market $389,900 Active 67 DOM
-
2026-06-15days on market $389,900 Active 66 DOM
-
2026-06-13days on market $389,900 Active 64 DOM
-
2026-06-09days on market $389,900 Active 60 DOM
-
2026-06-08days on market $389,900 Active 59 DOM
-
2026-06-07days on market $389,900 Active 58 DOM
-
2026-06-05days on market $389,900 Active 55 DOM
-
2026-06-03days on market $389,900 Active 54 DOM
-
2026-06-02days on market $389,900 Active 53 DOM
-
2026-06-01days on market $389,900 Active 52 DOM
-
2026-05-31days on market $389,900 Active 51 DOM
-
2026-04-10$389,900 Active
-
2026-04-01historical
-
2026-04-01$389,900 Active
-
2025-12-31historical
-
2025-10-19price $399,900
-
2025-08-10$420,000 Active
-
2020-04-06soldstatus $148,500
-
2020-04-03soldstatus $148,500 Closed
-
2020-03-06status Pending
-
2020-03-03$135,000 Active
ⓘ Source: listings_history table (triggers on properties + properties_extension) + one-shot
backfill from property_details.listing_events for pre-trigger history.
Tax reassessment forecast OH · Partial reset (capped growth)
- Current annual tax
- $7,232 · $603/mo
- Projected year-2 tax
- $7,232 · $603/mo
- Expected delta
- $0/yr ($0/mo · 0.0%)
ⓘ Screening estimate from a state-policy table — verify with the county assessor before closing.
Climate risk First Street
- Flood 1/10 Low FEMA zone X (unshaded) · 0% chance over 30 yrs
- Wildfire 1/10 Low
- Heat 3/10 Moderate 7 d/yr ≥95°F today · 16 d/yr by 30 yrs out
- Wind 1/10 Low
- Air quality 3/10 Moderate 3 unhealthy d/yr today · 5 by 30 yrs out
Nearby sold comps map
Loading sold comps map…
Walkable amenities ~0.75 mi
Loading nearby amenities…
Taxation est. · year 1
- Rental income
- $57,216
- − Mortgage interest
- −$21,840
- − Property taxes
- −$7,232
- − Insurance
- −$1,950
- − Repairs & maintenance
- −$4,577
- − Management
- −$4,577
- − Depreciation
- −$11,343
- Taxable income
- $5,697
- Est. tax owed @ 24.0%
- −$1,367
- After-tax cash flow
- $10,116/yr
For passive investors: Depreciation is non-cash, so a rental often shows a tax loss while cash-flowing — sheltering income. Rental losses are passive: they offset passive income freely, and up to $25,000/yr can offset ordinary (W-2) income if you actively participate and your MAGI is under $100k (phasing out to $0 by $150k); unused losses carry forward. On sale, claimed depreciation is recaptured at up to 25%, and gains may owe capital-gains tax (a 1031 exchange can defer both). Figures are a year-1 estimate at your 24.0% rate — not tax advice; consult a CPA.
Schools (NCES district)
- District
- Cleveland Heights-University Heights City
- NCES district ID
- 3904379
- Math proficiency
- 23% ▼ -22.00%
- Reading proficiency
- 41% ▼ -12.00%
- Median HH income
- $53,451
- Composite
- 28.12/100
- National rank
- #6822
- State rank
- #568 of 656 in OH
Livability — Cleveland Heights
- Score
- 89/100
- State rank
- #12
- US rank
- #124
Category grades
Schools grade is shown separately in the Schools card above.
Census & demographics
- Census place
- Cleveland Heights, OH
- County
- Cuyahoga County · 1,090,369 people
- City population
- 32,312
- Metro
- Cleveland-Elyria, OH
- Population (ZIP)
- 25,120
- Household income
- $43,170
- Rent vs Own
- Severe rent burden
- 2268.0
Population outlook (Cuyahoga County) Hauer SSP2
- Today (2025)
- 1,244,621 people
- By 2030
- 1,230,093 · -1.2%
- By 2040
- 1,189,108 · -4.5%
- By 2050
- 1,145,706 · -7.9%
- By 2075
- 1,076,557 · -13.5%
- By 2100
- 978,987 · -21.3%
Race, ethnicity, and origin ACS 2023
- Neighborhood character
- Diverse neighborhood (Simpson 0.67)
- Race & ethnicity
- Black 41% White 39% Asian 11% Two or more races 5% Hispanic / Latino 4%
- Common ancestry
- Romanian 3% Lithuanian 1% Italian 1%
- Foreign-born
- 13% · China, Canada, South Korea
- Languages at home
- 82% English-only · Spanish 3% Other Indo-European 3% Chinese 3%
Political lean MEDSL · Cuyahoga
- 2024 margin
- Solid D (+31.5) · D 65.4% · R 33.9%
- 2008→2024 swing
- -7.4pp toward R · 2008: 38.9pp · 2024: 31.5pp
- All cycles
- 2024: D+31.5 2020: D+34.1 2016: D+35.0 2012: D+38.7 2008: D+38.9
Not yet ingested
- Civics
- —
Market trends
- HPI YoY
- ▼ -133.63%
- Current HPI
- 117.6949
- Rent YoY
- ▲ 4.22%
- Metro
- Cleveland-Elyria, OH
- State GDP YoY
- ▲ 1.98%
- F500 in state
- 48
Industry mix (Fortune 500 HQ in OH)
| Industry | F500 HQs | Revenue |
|---|---|---|
| Insurance | 3 | $145B |
|
||
| Industrial Machinery | 3 | $49B |
|
||
| Financial Services | 3 | $24B |
|
||
| Consumer Goods | 2 | $93B |
|
||
| Aerospace / Defense | 2 | $47B |
|
||
| Utilities | 2 | $33B |
|
||
Price history
+188.8% since first listed10 events — show timeline
- 2026-04-10 Listed $389,900 MLSNOW
- 2026-04-01 Listed $389,900 MLSNOW
- 2026-04-01 Listing Removed — MLSNOW
- 2025-12-31 Listing Removed — MLSNOW
- 2025-10-19 Price Changed $399,900 MLSNOW
- 2025-08-10 Listed $420,000 MLSNOW
- 2020-04-06 Sold (Public Records) $148,500 Public Records
- 2020-04-03 Sold (MLS) $148,500 MLSNOW
- 2020-03-06 Pending — MLSNOW
- 2020-03-03 Listed $135,000 MLSNOW
Property tax history
+1.2%/yrLatest (2025): $7,232 · +7.2% YoY. Source: county tax records.
Cash-flow waterfall
monthlySold comps — $/sqft
last 12 mo · ≤1 miLoading sold comps…