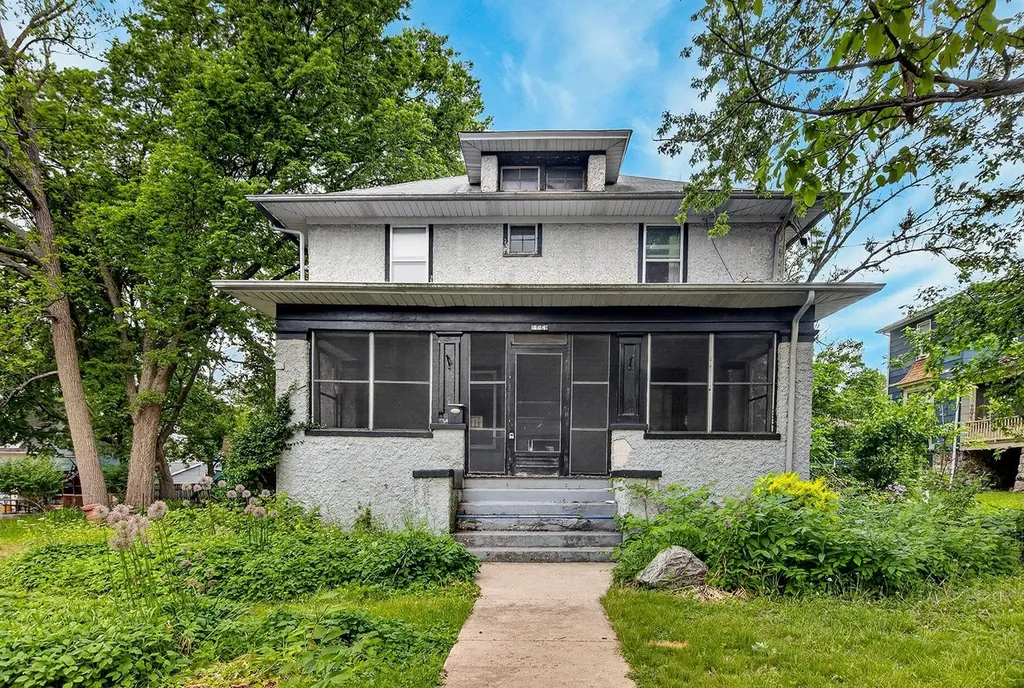
804 N Division St · Harvard, IL
Flood risk 1/10 · Minimal
- FEMA flood zone
- X (unshaded)
- Chance of flooding over 30 yrs
- 0.0%
- Est. flood insurance / yr
- $473 – $860
Fire risk 1/10 · Minimal
- Est. fire insurance / yr
- $804 – $1,492
Heat risk 2/10 · Minimal
- Hot days now (above 102°F)
- 7 days/yr
- Hot days in 30 yrs
- 14 days/yr
Wind risk 2/10 · Minimal
- Chance of severe wind over 30 yrs
- —
Air-quality risk 2/10 · Minimal
- Unhealthy air days now
- 0 days/yr
- Unhealthy air days in 30 yrs
- 1 days/yr
Risk factors via First Street. Map © Google.
Why this score? — see what drove the B- grade
The composite is a weighted blend of 9 inputs, each scored 0–100. Each bar is that input's sub-score; the figure is the points it added to the 100-point composite (weight × sub-score).
- Cash flow +30.0/30.0
- 1% rule +10.0/10.0
- DSCR +10.0/10.0
- ARV discount +7.5/15.0
- Livability +3.3/5.0
- Rent growth +2.5/5.0
- Condition / age +2.5/5.0
- Schools +0.9/10.0
- Appreciation +0.0/10.0
$150,000
🖨 Deal sheet (PDF) 📄 Offer letter ✓ Due diligence
Listing remarks MLS
Welcome to your new home! As you step inside this beautiful two story home, you are greeted by an original wooden banister, and stained glass window that boasts character and charm! The first floor has a large living area that goes right into a formal dining area. The kitchen is large as well, and offers a breakfast nook right in front of the patio doors that lead out to the deck that overlooks the backyard. All 3 bedrooms are upstairs, along with a convenient second floor laundry room! The bedrooms and closets are generously sized, and the home has much storage overall. Come take a look today!
Key facts
- Breakfast nook
- Stained glass window
- Large living area
Tags
Property features AI
Finance
- Other: Directions: Take IL 173 to Division and make a left. The home will be on the left.
- HOA & community: No master association fee required
Exterior
- Parking: Detached garage with 2 garage spaces; Total parking for up to 8 vehicles
- Home design: Detached single-family home; 2-story design; Fee simple ownership
- Construction: Stucco exterior; Built before 1978
- Exterior features: Lot dimensions approximately 66 x 137; Less than 0.25 acre lot
Interior
- Kitchen: Kitchen on main level (16 x 14)
- Bedrooms: 3 bedrooms (master and two additional bedrooms on second floor)
- Bathrooms: One full bathroom; One half bathroom
- Heating & cooling: Steam heating
- Interior features: Unfinished full basement; 6 total rooms
- Laundry & utility: Second-floor laundry (6 x 6)
Neighborhood map
What this means for you Summary
Snapshot
- This is a 3-bed/1.5-bath single-family listed at $150k.
Deal economics
- At list price, monthly cash flow is $775 ($9k/yr) — positive.
- The deal already cash-flows at list — no discount required.
- Meets the 1% rule at list price ($2k rent vs $150k).
- Cap rate 12.5% vs local median 4.7% in Harvard — top-decile yield for the area; either an underpriced asset or a hidden risk that comps aren't pricing in. Stress-test before assuming the spread holds.
Location & tenants
- Location reads 66/100 on livability (#560 in IL) — a middle-class / working-renter tenant base. Strengths: crime A+, cost of living A+, housing A+; Watch: amenities F, employment D-, health & safety F.
- Harvard CUSD 50 (town): math 5% / reading 12% proficiency, ranked #580 of 620 in IL (top 94%) — low school quality limits family demand, transient renter base, plan for 1-2y turnover; 63% free/reduced lunch — lower-income household profile, screen leases tightly.
- Zoned schools: Crosby Elem Sch (math 2% / reading 8%, grade F, #1,741 of 2,056 statewide, top 93%, 628 students, 0% FRL); Harvard Jr High School (math 2% / reading 13%, grade F, #612 of 665 statewide, top 93%, 540 students, 0% FRL); Harvard High School (math 12% / reading 17%, grade F, #479 of 693 statewide, top 71%, 816 students, 0% FRL) — zoned schools average 0% FRL vs 63% district-wide (63 pts lower); this property's tenant base skews higher-income than the district average.
- Market conditions: 78 active listings in the ZIP; 5 comparable units currently listed for rent nearby; rentals at typical pace (median 17d on market — plan ~3-4 weeks tenant-placement turnaround); 40% of comp listings sitting > 30 days — soft ceiling on asking rent; 1,595 units permitted in McHenry County in 2024 (485 in 5+ unit buildings).
Forward outlook
- Local home prices are declining (-3.0%/yr); year-one equity from $1k of loan paydown is wiped out by about $4k of value loss. Plan a longer hold.
- McHenry County population projected at -12% by 2050 — secular population decline; favor cash flow + early exit over multi-decade hold.
- At projected returns (-3.0% appreciation + 3.0% rent growth), your $42k cash investment doubles in ~6 years — after that, you're playing with house money.
Negotiation context
- Only 5 days on market — expect competitive offers; lowballing is unlikely to land.
- 2 sale attempts with the ask held roughly flat each time — persistent listings suggest the price (not the market) is what's stuck; bring a comps-based counter.
- Current owner paid $102k; 46% above their basis — modest negotiation headroom, anchor on the comps not their cost.
Risks & watch-outs
- Watch-outs: built in 1900 — expect roof / HVAC / electrical / plumbing capex.
Questions for the listing agent
- Built in 1900 — when were the roof, HVAC, electrical panel, plumbing, and water heater last replaced?
- Is there a deadline driving the sale (1031 exchange, divorce, estate, relocation)? That informs how much negotiation room exists.
- Schools are F-rated, which usually means shorter tenancies and higher turnover. Who's the typical renter profile here, and what's been the actual vacancy rate?
- What's the average days-on-market for RENTAL listings here right now (not sales)? A rising rental-DOM trend means longer vacancies and softer asking-rent achievability than the comps imply.
- What's the recent tenant-quality profile in this submarket — average credit score on applications, eviction rate, late-payment / NSF rate, and stable-employment percentage? A property-management company in the area should have these aggregated.
- How much new for-sale + rental construction is in the pipeline within 1–3 miles? Heavy new supply typically softens prices + rents 12–24 months out; constrained supply supports both.
Investment metrics
- 1% rule
- 1.61% ✓
- Cap rate
- 12.49%
- Cash-on-cash
- 22.14%
- DSCR
- 1.99
- GRM
- 5.2
CMA / ARV
- ARV (on-the-fly)
- $320,547
- Comps found
- 12
Show comp detail 12 sales within ~0.75 mi
| Address | Dist | Beds/Ba | Sqft | Sold | Price | $/sf | Match |
|---|---|---|---|---|---|---|---|
| 702 N Division St | 0.07mi | 3/2.0 | 1,687 (-7%) | 7mo | $220,000 | $130 | 78 |
| 1317 Sage Ln | 0.42mi | 3/3.0 | 1,800 (-1%) | 4mo | $319,000 | $177 | 70 |
| 607 W Burbank St | 0.36mi | 4/2.0 (+1) | 1,764 (-3%) | 3mo | $237,000 | $134 | 70 |
| 1416 Sage Ln | 0.47mi | 3/3.0 | 1,800 (-1%) | 3mo | $319,000 | $177 | 68 |
| 1412 Sage Ln | 0.47mi | 3/3.0 | 1,800 (-1%) | 5mo | $319,000 | $177 | 67 |
| 403 W Washington St | 0.54mi | 4/2.0 (+1) | 1,800 (-1%) | 3mo | $249,900 | $139 | 64 |
| 503 W Blackman St | 0.31mi | 4/2.0 (+1) | 1,700 (-6%) | 8mo | $250,000 | $147 | 62 |
| 715 Apple Valley Rd | 0.63mi | 3/2.0 | 1,636 (-10%) | 2mo | $325,500 | $199 | 51 |
| 1413 6th St | 0.51mi | 3/2.5 | 1,621 (-10%) | 8mo | $299,900 | $185 | 48 |
| 603 Apple Valley Rd | 0.62mi | 3/2.0 | 1,636 (-10%) | 6mo | $315,500 | $193 | 48 |
| 611 Apple Valley Rd | 0.62mi | 3/2.5 | 1,621 (-10%) | 4mo | $302,500 | $187 | 46 |
| 106 W Thompson St | 0.64mi | 3/2.5 | 1,569 (-13%) | 0mo | $328,000 | $209 | 43 |
Match score weights: distance 35% · size 25% · config 20% · recency 20%. Top-matched comps best support the ARV.
Projected returns pro-forma
-3.0% appreciation · 3.0% rent growth · sell at horizon
- IRR
- 14.9%
- Equity multiple
- 1.60×
- Total profit
- $25,141
- Equity at exit
- $22,365
- IRR
- 23.7%
- Equity multiple
- 3.04×
- Total profit
- $85,832
- Equity at exit
- $12,969
Cash invested: $42,000 (down + closing). Projections, not guarantees.
Landlord ↔ Tenant lean methodology
- Overall (STATE)
- 43 Moderately Tenant-Leaning
- State Illinois
- 43 Moderately Tenant-Leaning · D+7
- County
- — inherits STATE
- City
- — inherits STATE
ZIP-level market 60033
- Home prices YoY
- -32.1%
- Active inventory
- 78
- Price-to-rent
- 5.2×
Monthly cashflow live
- Estimated rent
- $2,417 high interval (Pro) →
- Mortgage (P&I)
- −$787
- Tax from tax record
- −$286 /mo · $3,429/yr
- Insurance
- −$62
- HOA
- −$0
- Vacancy / Maint / Mgmt
- −$508
- Net cashflow
- $775
Break-even live
Sensitivity live
| Price | -10% $860 | -5% $817 | +0% $775 | +5% $732 | +10% $690 |
|---|---|---|---|---|---|
| Rent | -10% $584 | -5% $679 | +0% $775 | +5% $870 | +10% $966 |
| Rate | -1.0pp $850 | -0.5pp $813 | base $775 | +0.5pp $736 | +1.0pp $696 |
UW: 25.0% down · 7.5% · 30yr · 1.5% tax · 5.0% vac · 8.0% maint · 8.0% mgmt
Financing live
Cash to close
- Down payment
- $37,500
- Closing costs
- $4,500
- Reserves months
- —
- Total cash needed
- —
Loan-product check · same deal, 3 products live
Conventional
25% down · 7.5% · 30yr
- Down + closing
- —
- Monthly P&I
- —
- Monthly cashflow
- —
- DSCR
- —
- Eligible?
- —
Personal DTI + credit; lowest rate.
DSCR
20% down · 8.5% · 30yr
- Down + closing
- —
- Monthly P&I
- —
- Monthly cashflow
- —
- DSCR
- —
- Eligible?
- —
No personal income docs; deal must DSCR.
Hard money
10% down · 12.0% · 12mo
- Down + closing
- —
- Monthly P&I
- —
- Monthly cashflow
- —
- DSCR
- —
- Eligible?
- —
Short-term bridge; refi at stabilization.
Rent comps 5 comps
| Address | Beds | Baths | Sqft | Rent | $/sqft | DOM | Units | Dist |
|---|---|---|---|---|---|---|---|---|
| 600 Dewey St Harvard, IL | 4.0 | 2.0 | 2400 | $2,500 | $1.04 | 0d | 1 | 0.56mi |
| 1320 8th St Harvard, IL | 3.0 | 2.5 | 1900 | $2,500 | $1.32 | 45d | 1 | 0.56mi |
| 1308 8th St Harvard, IL | 3.0 | 2.5 | 1900 | $2,300 | $1.21 | 8d | 1 | 0.59mi |
| 1312 8th St Harvard, IL | 3.0 | 2.5 | 1900 | $2,300 | $1.21 | 16d | 1 | 0.59mi |
| 1400 8th St Harvard, IL | 3.0 | 2.5 | 1900 | $2,500 | $1.32 | 45d | 1 | 0.63mi |
Listing history 6 events
-
2026-06-15remarks 692-char remark
-
2026-06-15$150,000 Pending 5 DOM
-
2026-05-22$150,000 Active
Show marketing remark (604 chars)
Welcome to your new home! As you step inside this beautiful two story home, you are greeted by an original wooden banister, and stained glass window that boasts character and charm! The first floor has a large living area that goes right into a formal dining area. The kitchen is large as well, and offers a breakfast nook right in front of the patio doors that lead out to the deck that overlooks the backyard. All 3 bedrooms are upstairs, along with a convenient second floor laundry room! The bedrooms and closets are generously sized, and the home has much storage overall. Come take a look today!
-
2026-05-22$150,000 Active 604-char remark
Show marketing remark (604 chars)
Welcome to your new home! As you step inside this beautiful two story home, you are greeted by an original wooden banister, and stained glass window that boasts character and charm! The first floor has a large living area that goes right into a formal dining area. The kitchen is large as well, and offers a breakfast nook right in front of the patio doors that lead out to the deck that overlooks the backyard. All 3 bedrooms are upstairs, along with a convenient second floor laundry room! The bedrooms and closets are generously sized, and the home has much storage overall. Come take a look today!
-
1999-06-16soldstatus $102,500
-
1985-10-01soldstatus $57,000
ⓘ Source: listings_history table (triggers on properties + properties_extension) + one-shot
backfill from property_details.listing_events for pre-trigger history.
Tax reassessment forecast IL · Partial reset (capped growth)
- Current annual tax
- $3,429 · $286/mo
- Projected year-2 tax
- $3,429 · $286/mo
- Expected delta
- $0/yr ($0/mo · 0.0%)
ⓘ Screening estimate from a state-policy table — verify with the county assessor before closing.
Climate risk First Street
- Flood 1/10 Low FEMA zone X (unshaded) · 0% chance over 30 yrs
- Wildfire 1/10 Low
- Heat 2/10 Low 7 d/yr ≥102°F today · 14 d/yr by 30 yrs out
- Wind 2/10 Low
- Air quality 2/10 Low 0 unhealthy d/yr today · 1 by 30 yrs out
Nearby sold comps map
Loading sold comps map…
Walkable amenities ~0.75 mi
Loading nearby amenities…
Taxation est. · year 1
- Rental income
- $29,009
- − Mortgage interest
- −$8,402
- − Property taxes
- −$3,429
- − Insurance
- −$750
- − Repairs & maintenance
- −$2,321
- − Management
- −$2,321
- − Depreciation
- −$4,364
- Taxable income
- $7,422
- Est. tax owed @ 24.0%
- −$1,781
- After-tax cash flow
- $7,517/yr
For passive investors: Depreciation is non-cash, so a rental often shows a tax loss while cash-flowing — sheltering income. Rental losses are passive: they offset passive income freely, and up to $25,000/yr can offset ordinary (W-2) income if you actively participate and your MAGI is under $100k (phasing out to $0 by $150k); unused losses carry forward. On sale, claimed depreciation is recaptured at up to 25%, and gains may owe capital-gains tax (a 1031 exchange can defer both). Figures are a year-1 estimate at your 24.0% rate — not tax advice; consult a CPA.
Schools (NCES district)
- District
- Harvard CUSD 50
- NCES district ID
- 1718420
- Math proficiency
- 5% ▼ -8.00%
- Reading proficiency
- 12% ▼ -6.00%
- Median HH income
- $52,213
- Composite
- 8.57/100
- National rank
- #9901
- State rank
- #580 of 620 in IL
Livability — Harvard
- Score
- 66/100
- State rank
- #560
- US rank
- #11763
Category grades
Schools grade is shown separately in the Schools card above.
Census & demographics
- Census place
- Harvard, IL
- City population
- 13,333
- Population (ZIP)
- 13,333
Population outlook (McHenry County) Hauer SSP2
- Today (2025)
- 305,342 people
- By 2030
- 301,491 · -1.3%
- By 2040
- 288,211 · -5.6%
- By 2050
- 268,430 · -12.1%
- By 2075
- 226,209 · -25.9%
- By 2100
- 181,247 · -40.6%
Race, ethnicity, and origin ACS 2023
- Neighborhood character
- Majority White (57%)
- Race & ethnicity
- White 57% Hispanic / Latino 41% Two or more races 18%
- Hispanic origin (detail)
- Mexican 36% Puerto Rican 2%
- Common ancestry
- Romanian 4% Iranian 2% Portuguese 2%
- Foreign-born
- 12% · Canada
- Languages at home
- 69% English-only · Spanish 30%
Political lean MEDSL · McHenry
- 2024 margin
- Lean R (+5.3) · D 46.6% · R 51.9% · Other 1.5%
- 2008→2024 swing
- -10.6pp toward R · 2008: 5.3pp · 2024: -5.3pp
- All cycles
- 2024: R+5.3 2020: R+2.5 2016: R+8.1 2012: R+8.8 2008: D+5.3
Not yet ingested
- Civics
- —
Market trends
- HPI YoY
- ▼ -91.32%
- Current HPI
- 192.8433
- Rent YoY
- —
- Metro
- —
- State GDP YoY
- ▲ 1.59%
- F500 in state
- 60
Industry mix (Fortune 500 HQ in IL)
| Industry | F500 HQs | Revenue |
|---|---|---|
| Insurance | 4 | $201B |
|
||
| Consumer Goods | 4 | $87B |
|
||
| Industrial Machinery | 3 | $64B |
|
||
| Healthcare | 2 | $55B |
|
||
| Retail / Pharmacy | 1 | $148B |
|
||
| Agriculture / Food | 1 | $86B |
|
||
Price history
+163.2% since first listed4 events — show timeline
- 2026-05-22 Listed $150,000 NWIAR
- 2026-05-22 Listed $150,000 MRED as Distributed by MLS Grid
- 1999-06-16 Sold (Public Records) $102,500 Public Records
- 1985-10-01 Sold (Public Records) $57,000 Public Records
Property tax history
+0.2%/yrLatest (2024): $3,429 · -21.5% YoY. Source: county tax records.
Cash-flow waterfall
monthlySold comps — $/sqft
last 12 mo · ≤1 miLoading sold comps…