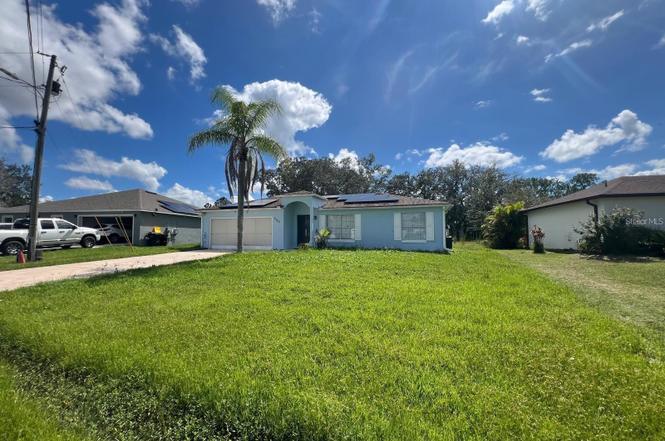
733 Robin Ct · Poinciana, FL
Flood risk 1/10 · Minimal
- FEMA flood zone
- A
- Chance of flooding over 30 yrs
- 0.0%
- Est. flood insurance / yr
- $1,009 – $1,996
Fire risk 6/10 · Moderate
- Est. fire insurance / yr
- $947 – $1,759
Heat risk 8/10 · Major
- Hot days now (above 108°F)
- 7 days/yr
- Hot days in 30 yrs
- 24 days/yr
Wind risk 9/10 · Severe
- Chance of severe wind over 30 yrs
- 99.0%
Air-quality risk 1/10 · Minimal
- Unhealthy air days now
- 0 days/yr
- Unhealthy air days in 30 yrs
- 0 days/yr
Risk factors via First Street. Map © Google.
Why this score? — see what drove the D+ grade
The composite is a weighted blend of 9 inputs, each scored 0–100. Each bar is that input's sub-score; the figure is the points it added to the 100-point composite (weight × sub-score).
- Cash flow +15.1/30.0
- ARV discount +7.5/15.0
- 1% rule +4.7/10.0
- DSCR +4.6/10.0
- Appreciation +4.3/10.0
- Schools +3.5/10.0
- Livability +2.9/5.0
- Rent growth +2.8/5.0
- Condition / age +2.5/5.0
$185,000
🖨 Deal sheet (PDF) 📄 Offer letter ✓ Due diligence
Listing remarks
Under contract-accepting backup offers. Short Sale. SHORT SALE!!!!Opportunity knocks in Kissimmee! This short sale features 3 bedrooms, 2 baths, a 2-car garage, and a spacious backyard—plus a solar system for energy efficiency. Comfortable flow and strong bones; This home features a New Air Conditioner Unit recently installed in 2022 light TLC will make it shine and build equity from day one. Tucked on a cul-de-sac close to everyday conveniences and commuter routes. Sale requires lender approval; timelines may be extended.
Key facts
- Spacious backyard
- Solar system
- Cul-de-sac
Tags
Neighborhood map
What this means for you Summary
Snapshot
- This is a 3-bed/2.0-bath single-family listed at $185k.
Deal economics
- At list price, monthly cash flow is $-64 ($-772/yr) — negative.
- To cash-flow at today's rent, offer at most $174k (6.1% below list).
- To meet the 1% rule (rent ≥ 1% of price), the offer needs to be $180k (2.7% below list).
- Recommended offer: $174k (6.1% below list) — sets the bar for cash-flow.
- Cap rate 6.7% vs local median 4.2% in Poinciana — top-decile yield for the area; either an underpriced asset or a hidden risk that comps aren't pricing in. Stress-test before assuming the spread holds.
Location & tenants
- Location reads 57/100 on livability (#859 in FL) — a working-class tenant base; expect higher turnover. Strengths: cost of living A+, housing A+; Watch: employment D+, amenities F, commute F.
- Polk (suburban): math 39% / reading 43% proficiency, ranked #62 of 73 in FL (top 85%) — families likely to look elsewhere, expect single-tenant / working-renter base with shorter leases.
- Zoned schools: Palmetto Elementary School (math 23% / reading 32%, grade F, #1,962 of 2,144 statewide, top 92%, 513 students, 52% FRL); Lake Marion Creek Middle School (math 22% / reading 27%, grade F, #522 of 571 statewide, top 93%, 1,044 students, 58% FRL); New Beginnings High School (math 5% / reading 8%, grade F, #655 of 667 statewide, top 98%, 753 students, 66% FRL, charter) — zoned schools at 59% FRL track the district average.
- Zoned-school proficiency averages 19% at this address vs 41% district-wide (-22 pts) — the specific schools serving this property underperform the Polk average; the district grade overstates school quality for this exact location.
- Market conditions: Rents rising (+1.1%/yr); 1155 active listings in the ZIP; 40 comparable units currently listed for rent nearby; rentals at typical pace (median 25d on market — plan ~3-4 weeks tenant-placement turnaround); 10,384 units permitted in Polk County in 2024 (1,716 in 5+ unit buildings).
- This rent runs 31% of the median local income ($69k/yr) — at the standard rent-burdened threshold; future hikes will face affordability resistance.
Forward outlook
- Local home prices are declining (-1.5%/yr); year-one equity from $1k of loan paydown is wiped out by about $3k of value loss. Plan a longer hold.
- Polk County population projected at +33% by 2050 — long-run rental-demand tailwind backs the buy-and-hold thesis.
Negotiation context
- It's been on market 74 days — a 6% lower offer ($174k) is reasonable based on typical stale-listing flexibility.
- 10 sale attempts since 8y ago; this cycle's ask has dropped $20k (10%) from the opening price — seller is motivated, your offer sets the floor, not the list.
Risks & watch-outs
- Watch-outs: flood insurance adds $125/mo.
- Climate carrying-cost: in FEMA flood zone A (mandatory federal flood insurance); severe wind risk, 99% chance of damaging wind over 30y; major wildfire risk; extreme-heat days projected 7→24/yr by 2055 (HVAC capex compounding) — expect insurance premiums to compound above CPI over the hold.
Questions for the listing agent
- What do current leases actually rent for vs. the listed asking? Can we see a recent rent roll and the last 12 months of T-12 income?
- It's been on market 74 days. Have you received any prior offers? Is the seller open to a 6% concession, seller financing, or rate buy-down credit?
- What's the actual annual flood-insurance premium (NFIP or private), and is the property in a SFHA with mandatory coverage?
- What does the HOA fee cover, when was the last increase, and are there any pending special assessments or reserve-fund shortfalls?
- Why hasn't it sold? Are there any deal-killer items the seller is aware of (foundation, flood, title, zoning, code violations)?
- Is there a deadline driving the sale (1031 exchange, divorce, estate, relocation)? That informs how much negotiation room exists.
- Schools are F-rated, which usually means shorter tenancies and higher turnover. Who's the typical renter profile here, and what's been the actual vacancy rate?
- The area grade is low — what's the realistic commute time and amenity access for the typical tenant pool here? Any planned neighborhood developments (good or bad) we should know about?
- What's the average days-on-market for RENTAL listings here right now (not sales)? A rising rental-DOM trend means longer vacancies and softer asking-rent achievability than the comps imply.
- What's the recent tenant-quality profile in this submarket — average credit score on applications, eviction rate, late-payment / NSF rate, and stable-employment percentage? A property-management company in the area should have these aggregated.
- How much new for-sale + rental construction is in the pipeline within 1–3 miles? Heavy new supply typically softens prices + rents 12–24 months out; constrained supply supports both.
Investment metrics
- 1% rule
- 0.97% ✗
- Cap rate
- 6.69%
- Cash-on-cash
- 1.41%
- DSCR
- 1.06
- GRM
- 8.6
CMA / ARV
No comps found within radius.
Projected returns pro-forma
-1.48% appreciation · 1.14% rent growth · sell at horizon
- IRR
- -11.9%
- Equity multiple
- 0.51×
- Total profit
- $-25,142
- Equity at exit
- $40,445
- IRR
- -7.0%
- Equity multiple
- 0.45×
- Total profit
- $-28,546
- Equity at exit
- $38,978
Cash invested: $51,800 (down + closing). Projections, not guarantees.
Landlord ↔ Tenant lean methodology
- Overall (STATE)
- 87 Strongly Landlord-Friendly
- State Florida
- 87 Strongly Landlord-Friendly · R+3
- County
- — inherits STATE
- City
- — inherits STATE
ZIP-level market 34759
- Home prices YoY
- -0.5%
- Rents YoY
- 1.1%
- Active inventory
- 1155
- Price-to-rent
- 8.6×
Monthly cashflow live
- Estimated rent
- $1,801 high interval (Pro) →
- Mortgage (P&I)
- −$970
- Tax from tax record
- −$240 /mo · $2,875/yr
- Insurance
- −$77
- Flood insurance flood zone
- −$125 /mo · $1,502/yr
- HOA
- −$75
- Vacancy / Maint / Mgmt
- −$378
- Net cashflow
- $-64
Break-even live
Sensitivity live
| Price | -10% $40 | -5% $-12 | +0% $-64 | +5% $-117 | +10% $-169 |
|---|---|---|---|---|---|
| Rent | -10% $-207 | -5% $-136 | +0% $-64 | +5% $7 | +10% $78 |
| Rate | -1.0pp $29 | -0.5pp $-17 | base $-64 | +0.5pp $-112 | +1.0pp $-161 |
UW: 25.0% down · 7.5% · 30yr · 1.5% tax · 5.0% vac · 8.0% maint · 8.0% mgmt
Financing live
Cash to close
- Down payment
- $46,250
- Closing costs
- $5,550
- Reserves months
- —
- Total cash needed
- —
Loan-product check · same deal, 3 products live
Conventional
25% down · 7.5% · 30yr
- Down + closing
- —
- Monthly P&I
- —
- Monthly cashflow
- —
- DSCR
- —
- Eligible?
- —
Personal DTI + credit; lowest rate.
DSCR
20% down · 8.5% · 30yr
- Down + closing
- —
- Monthly P&I
- —
- Monthly cashflow
- —
- DSCR
- —
- Eligible?
- —
No personal income docs; deal must DSCR.
Hard money
10% down · 12.0% · 12mo
- Down + closing
- —
- Monthly P&I
- —
- Monthly cashflow
- —
- DSCR
- —
- Eligible?
- —
Short-term bridge; refi at stabilization.
Rent comps 40 comps
| Address | Beds | Baths | Sqft | Rent | $/sqft | DOM | Units | Dist |
|---|---|---|---|---|---|---|---|---|
| 754 Pelican Ct Kissimmee, FL | 3.0 | 2.0 | 1306 | $1,695 | $1.30 | 5d | 1 | 0.25mi |
| 327 Poinciana, FL | 2.0 | 2.0 | 1107 | $1,500 | $1.36 | 25d | 1 | 0.45mi |
| 702 Bluebill Pl Unit A Poinciana, FL | 3.0 | 2.0 | 1240 | $1,650 | $1.33 | 25d | 1 | 0.65mi |
| 612 Bluebill Ct Unit A Kissimmee, FL | 3.0 | 2.0 | 1162 | $1,650 | $1.42 | 5d | 1 | 0.67mi |
| 568 Kingfisher Dr Kissimmee, FL | 3.0 | 2.0 | 1278 | $1,750 | $1.37 | 25d | 1 | 0.69mi |
| 721 Bittern Ln Unit A Kissimmee, FL | 3.0 | 2.0 | 1350 | $1,750 | $1.30 | 25d | 1 | 0.70mi |
| 736 Bittern Ln Kissimmee, FL | 3.0 | 2.0 | 1200 | $1,775 | $1.48 | 25d | 1 | 0.71mi |
| 575 Eagle Ct Unit 116 Kissimmee, FL | 3.0 | 2.0 | 1183 | $1,000 | $0.85 | 5d | 1 | 0.75mi |
| 510 Eagle Ct Kissimmee, FL | 3.0 | 2.0 | 1332 | $1,650 | $1.24 | 25d | 1 | 0.77mi |
| 627 Bittern Ct Unit B Kissimmee, FL | 2.0 | 2.0 | 1113 | $1,400 | $1.26 | 5d | 1 | 0.78mi |
| 627B Bittern Ct Kissimmee, FL | 2.0 | 2.0 | 1113 | $1,400 | $1.26 | 13d | 1 | 0.78mi |
| 627 Bluebill Ct Kissimmee, FL | 3.0 | 2.0 | 1430 | $1,760 | $1.23 | 25d | 1 | 0.80mi |
| 641 Yak Ct Unit B Kissimmee, FL | 3.0 | 2.0 | 1162 | $1,650 | $1.42 | 25d | 1 | 0.87mi |
| 543 Cardinal Dr Kissimmee, FL | 3.0 | 2.0 | 1007 | $1,860 | $1.85 | 25d | 1 | 0.87mi |
| 519 Blackbird Ln Kissimmee, FL | 3.0 | 2.0 | 1200 | $1,700 | $1.42 | 25d | 1 | 0.87mi |
| 517 Blackbird Ln Kissimmee, FL | 3.0 | 2.0 | 1304 | $1,530 | $1.17 | 25d | 1 | 0.89mi |
| 514 Blackbird Ln Unit B Kissimmee, FL | 3.0 | 2.0 | 1394 | $1,600 | $1.15 | 23d | 1 | 0.89mi |
| 510 Blackbird Ln Kissimmee, FL | 3.0 | 2.0 | 1207 | $1,650 | $1.37 | 12d | 1 | 0.91mi |
| 510 Blackbird Ln Kissimmee, FL | 3.0 | 2.0 | 1207 | $1,599 | $1.32 | 25d | 1 | 0.91mi |
| 539 Albatross Dr Unit B Kissimmee, FL | 3.0 | 2.0 | 1220 | $1,500 | $1.23 | 25d | 1 | 0.92mi |
| 442 Flamingo Ct Kissimmee, FL | 3.0 | 2.0 | 1456 | $1,695 | $1.16 | 25d | 1 | 0.94mi |
| 827 Massy Ct Kissimmee, FL | 3.0 | 2.0 | 1480 | $1,639 | $1.11 | 23d | 1 | 0.94mi |
| 435 Magpie Ct Kissimmee, FL | 4.0 | 2.0 | 1413 | $1,725 | $1.22 | 25d | 1 | 0.94mi |
| 504 Blackbird Ln Kissimmee, FL | 2.0 | 1.5 | 908 | $1,550 | $1.71 | 16d | 1 | 0.94mi |
| 504 Blackbird Ln Unit A Kissimmee, FL | 2.0 | 1.5 | 908 | $1,580 | $1.74 | 20d | 1 | 0.95mi |
| 774 Squirrel Ct Kissimmee, FL | 3.0 | 2.0 | 1000 | $1,750 | $1.75 | 25d | 1 | 0.95mi |
| 783 Squirrel Ct Unit B Kissimmee, FL | 2.0 | 2.0 | 1100 | $1,300 | $1.18 | 25d | 1 | 0.99mi |
| 870 Jarnac Dr Kissimmee, FL | 3.0 | 2.0 | 1356 | $1,695 | $1.25 | 0d | 1 | 0.99mi |
| 767 Platypus Ct Unit 767 Kissimmee, FL | 3.0 | 2.0 | 1162 | $1,650 | $1.42 | 25d | 1 | 1.00mi |
| 504 Albatross Dr Kissimmee, FL | 3.0 | 2.0 | 1250 | $1,700 | $1.36 | 25d | 1 | 1.01mi |
| 504 Albatross Dr Kissimmee, FL | 3.0 | 2.0 | 1250 | $1,700 | $1.36 | 5d | 1 | 1.01mi |
| 653 Koala Ct Kissimmee, FL | 3.0 | 2.0 | 1246 | $2,000 | $1.61 | 15d | 1 | 1.02mi |
| 780 Platypus Ct Kissimmee, FL | 3.0 | 2.0 | 1350 | $1,695 | $1.26 | 25d | 1 | 1.03mi |
| 657 Koala Ct Kissimmee, FL | 3.0 | 2.0 | 1246 | $1,870 | $1.50 | 5d | 1 | 1.04mi |
| 657 Koala Ct Kissimmee, FL | 3.0 | 2.0 | 1246 | $2,020 | $1.62 | 4d | 1 | 1.04mi |
| 439 Albatross Ct Unit B Kissimmee, FL | 3.0 | 2.0 | 1344 | $1,700 | $1.26 | 25d | 1 | 1.05mi |
| 401 Albatross Ct Unit B Kissimmee, FL | 3.0 | 2.0 | 1200 | $1,650 | $1.38 | 25d | 1 | 1.05mi |
| 411 Blackbird Way Kissimmee, FL | 3.0 | 2.0 | 1440 | $1,550 | $1.08 | 25d | 1 | 1.06mi |
| 609 Tamarin Ln Kissimmee, FL | 3.0 | 2.0 | 1250 | $1,725 | $1.38 | 16d | 1 | 1.09mi |
| 603 Muskrat Dr Kissimmee, FL | 4.0 | 2.0 | 1496 | $2,050 | $1.37 | 5d | 1 | 1.17mi |
HOA detail
- Monthly dues
- $75 · $900/yr
Listing history 40 events
-
2026-02-02status Pending
-
2026-01-29status Active
-
2026-01-29status Pending
-
2026-01-23price $185,000
-
2026-01-07price $195,000
-
2025-11-20$205,000 Active
-
2025-08-09status Active
-
2025-05-12status Pending
-
2025-04-29price $175,000
-
2025-03-26price $195,999
-
2025-03-13price $199,900
-
2025-01-22status Active
-
2024-11-19status Pending
-
2024-10-28price $205,000
-
2024-10-21price $230,000
-
2024-10-15price $260,000
-
2024-10-04$275,000 Active
-
2024-09-27historical
-
2024-09-06price $275,000
-
2024-08-23$280,000 Active
-
2024-08-19historical
-
2024-07-03price $289,900
-
2024-06-20price $289,950
-
2024-04-22price $299,900
-
2024-04-09price $299,925
-
2024-03-19$299,950 Active
-
2022-05-25soldstatus $281,000
-
2022-05-04soldstatus $281,000 Closed
-
2022-03-22status Pending
-
2022-03-17$269,900 Active
-
2019-10-31soldstatus $174,000 Sold
-
2019-09-20status Pending
-
2019-09-16price $183,900
-
2019-08-15$189,900 Active
-
2018-06-06soldstatus $175,000 Sold
-
2018-05-27status Pending
-
2018-05-08price $184,500
-
2018-04-07price $189,000
-
2018-03-20$195,000 Active
-
2003-05-01soldstatus $92,000
ⓘ Source: listings_history table (triggers on properties + properties_extension) + one-shot
backfill from property_details.listing_events for pre-trigger history.
Tax reassessment forecast FL · Resets to sale price
- Current annual tax
- $2,875 · $240/mo
- Projected year-2 tax
- $2,875 · $240/mo
- Expected delta
- $0/yr ($0/mo · 0.0%)
ⓘ Screening estimate from a state-policy table — verify with the county assessor before closing.
Climate risk First Street
- Flood 1/10 Low FEMA zone A · 0% chance over 30 yrs
- Wildfire 6/10 Major
- Heat 8/10 Severe 7 d/yr ≥108°F today · 24 d/yr by 30 yrs out
- Wind 9/10 Extreme 99% chance of damaging wind over 30 yrs
- Air quality 1/10 Low 0 unhealthy d/yr today · 0 by 30 yrs out
Nearby sold comps map
Loading sold comps map…
Walkable amenities ~0.75 mi
Loading nearby amenities…
Taxation est. · year 1
- Rental income
- $21,611
- − Mortgage interest
- −$10,363
- − Property taxes
- −$2,875
- − Insurance
- −$2,428
- − Repairs & maintenance
- −$1,729
- − Management
- −$1,729
- − HOA
- −$900
- − Depreciation
- −$5,382
- Taxable loss
- −$3,795
- Est. tax savings @ 24.0%
- +$911
- After-tax cash flow
- $138/yr
For passive investors: Depreciation is non-cash, so a rental often shows a tax loss while cash-flowing — sheltering income. Rental losses are passive: they offset passive income freely, and up to $25,000/yr can offset ordinary (W-2) income if you actively participate and your MAGI is under $100k (phasing out to $0 by $150k); unused losses carry forward. On sale, claimed depreciation is recaptured at up to 25%, and gains may owe capital-gains tax (a 1031 exchange can defer both). Figures are a year-1 estimate at your 24.0% rate — not tax advice; consult a CPA.
Schools (NCES district)
- District
- Polk
- NCES district ID
- 1201590
- Math proficiency
- 39% ▼ -11.00%
- Reading proficiency
- 43% ▼ -4.00%
- Median HH income
- $43,979
- Composite
- 34.74/100
- National rank
- #5132
- State rank
- #62 of 73 in FL
Livability — Poinciana
- Score
- 57/100
- State rank
- #859
- US rank
- #21760
Category grades
Schools grade is shown separately in the Schools card above.
Census & demographics
- Census place
- Poinciana, FL
- County
- Polk County · 740,051 people
- City population
- 91,336
- Metro
- Lakeland-Winter Haven, FL
- Population (ZIP)
- 44,568
- Household income
- $69,373
- Rent vs Own
- Severe rent burden
- 1186.0
Population outlook (Polk County) Hauer SSP2
- Today (2025)
- 752,975 people
- By 2030
- 804,621 · +6.9%
- By 2040
- 906,117 · +20.3%
- By 2050
- 1,000,476 · +32.9%
- By 2075
- 1,197,520 · +59.0%
- By 2100
- 1,271,518 · +68.9%
Race, ethnicity, and origin ACS 2023
- Neighborhood character
- Diverse neighborhood (Simpson 0.62)
- Race & ethnicity
- Hispanic / Latino 55% White 21% Two or more races 20% Black 19%
- Hispanic origin (detail)
- Mexican 2% Puerto Rican 38% Cuban 6% Dominican 3%
- Common ancestry
- Hispanic 3% Romanian 2% Scotch-Irish 1%
- Foreign-born
- 17% · Canada, Jamaica
- Languages at home
- 49% English-only · Spanish 48% French/Haitian/Cajun 2%
Political lean MEDSL · Polk
- 2024 margin
- Strong R (+20.7) · D 39.2% · R 59.9%
- 2008→2024 swing
- -14.6pp toward R · 2008: -6.1pp · 2024: -20.7pp
- All cycles
- 2024: R+20.7 2020: R+14.4 2016: R+14.1 2012: R+6.8 2008: R+6.1
Not yet ingested
- Civics
- —
Market trends
- HPI YoY
- ▼ -1.48%
- Current HPI
- 276.6861
- Rent YoY
- ▲ 1.14%
- Metro
- Lakeland-Winter Haven, FL
- State GDP YoY
- ▲ 3.28%
- F500 in state
- 36
Industry mix (Fortune 500 HQ in FL)
| Industry | F500 HQs | Revenue |
|---|---|---|
| Industrial Technology | 2 | $29B |
|
||
| Insurance | 2 | $17B |
|
||
| Retail | 1 | $60B |
|
||
| Technology Distribution | 1 | $58B |
|
||
| Homebuilding | 1 | $35B |
|
||
| Technology Manufacturing | 1 | $35B |
|
||
Price history
+101.1% since first listed40 events — show timeline
- 2026-02-02 Pending — Stellar MLS as Distributed by MLS Grid
- 2026-01-29 Relisted — Stellar MLS as Distributed by MLS Grid
- 2026-01-29 Pending — Stellar MLS as Distributed by MLS Grid
- 2026-01-23 Price Changed $185,000 Stellar MLS as Distributed by MLS Grid
- 2026-01-07 Price Changed $195,000 Stellar MLS as Distributed by MLS Grid
- 2025-11-20 Listed $205,000 Stellar MLS as Distributed by MLS Grid
- 2025-08-09 Relisted — Stellar MLS as Distributed by MLS Grid
- 2025-05-12 Pending — Stellar MLS as Distributed by MLS Grid
- 2025-04-29 Price Changed $175,000 Stellar MLS as Distributed by MLS Grid
- 2025-03-26 Price Changed $195,999 Stellar MLS as Distributed by MLS Grid
- 2025-03-13 Price Changed $199,900 Stellar MLS as Distributed by MLS Grid
- 2025-01-22 Relisted — Stellar MLS as Distributed by MLS Grid
- 2024-11-19 Pending — Stellar MLS as Distributed by MLS Grid
- 2024-10-28 Price Changed $205,000 Stellar MLS as Distributed by MLS Grid
- 2024-10-21 Price Changed $230,000 Stellar MLS as Distributed by MLS Grid
- 2024-10-15 Price Changed $260,000 Stellar MLS as Distributed by MLS Grid
- 2024-10-04 Listed $275,000 Stellar MLS as Distributed by MLS Grid
- 2024-09-27 Listing Removed — Stellar MLS as Distributed by MLS Grid
- 2024-09-06 Price Changed $275,000 Stellar MLS as Distributed by MLS Grid
- 2024-08-23 Listed $280,000 Stellar MLS as Distributed by MLS Grid
- 2024-08-19 Listing Removed — Stellar MLS as Distributed by MLS Grid
- 2024-07-03 Price Changed $289,900 Stellar MLS as Distributed by MLS Grid
- 2024-06-20 Price Changed $289,950 Stellar MLS as Distributed by MLS Grid
- 2024-04-22 Price Changed $299,900 Stellar MLS as Distributed by MLS Grid
- 2024-04-09 Price Changed $299,925 Stellar MLS as Distributed by MLS Grid
- 2024-03-19 Listed $299,950 Stellar MLS as Distributed by MLS Grid
- 2022-05-25 Sold (Public Records) $281,000 Public Records
- 2022-05-04 Sold (MLS) $281,000 Stellar MLS as Distributed by MLS Grid
- 2022-03-22 Pending — Stellar MLS as Distributed by MLS Grid
- 2022-03-17 Listed $269,900 Stellar MLS as Distributed by MLS Grid
- 2019-10-31 Sold (MLS) $174,000 Stellar MLS as Distributed by MLS Grid
- 2019-09-20 Pending — Stellar MLS as Distributed by MLS Grid
- 2019-09-16 Price Changed $183,900 Stellar MLS as Distributed by MLS Grid
- 2019-08-15 Listed $189,900 Stellar MLS as Distributed by MLS Grid
- 2018-06-06 Sold (MLS) $175,000 Stellar MLS as Distributed by MLS Grid
- 2018-05-27 Pending — Stellar MLS as Distributed by MLS Grid
- 2018-05-08 Price Changed $184,500 Stellar MLS as Distributed by MLS Grid
- 2018-04-07 Price Changed $189,000 Stellar MLS as Distributed by MLS Grid
- 2018-03-20 Listed $195,000 Stellar MLS as Distributed by MLS Grid
- 2003-05-01 Sold (Public Records) $92,000 Public Records
Property tax history
+20.5%/yrLatest (2025): $2,875 · +6.5% YoY. Source: county tax records.
Cash-flow waterfall
monthlySold comps — $/sqft
last 12 mo · ≤1 miLoading sold comps…