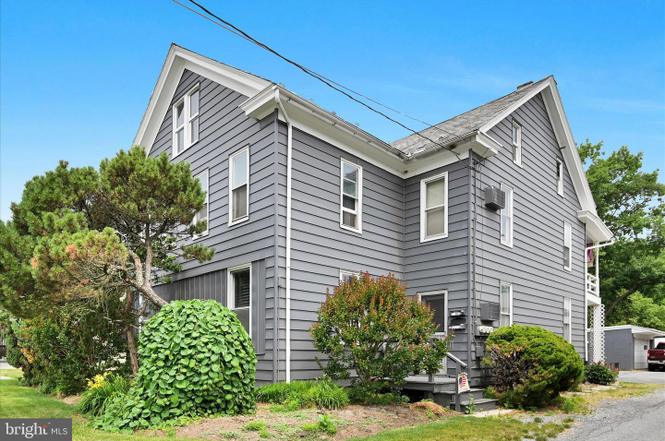
 Fourplex
815-817 S Spruce St · Elizabethtown, PA
Flood risk 1/10 · Minimal
- FEMA flood zone
- X (unshaded)
- Chance of flooding over 30 yrs
- 0.0%
- Est. flood insurance / yr
- $473 – $860
Fire risk 1/10 · Minimal
- Est. fire insurance / yr
- $511 – $949
Heat risk 5/10 · Moderate
- Hot days now (above 101°F)
- 7 days/yr
- Hot days in 30 yrs
- 15 days/yr
Wind risk 4/10 · Minor
- Chance of severe wind over 30 yrs
- 10.0%
Air-quality risk 4/10 · Minor
- Unhealthy air days now
- 4 days/yr
- Unhealthy air days in 30 yrs
- 5 days/yr
Risk factors via First Street. Map © Google.
Why this score? — see what drove the B grade
The composite is a weighted blend of 9 inputs, each scored 0–100. Each bar is that input's sub-score; the figure is the points it added to the 100-point composite (weight × sub-score).
- Cash flow +29.2/30.0
- DSCR +10.0/10.0
- 1% rule +8.2/10.0
- ARV discount +7.5/15.0
- Schools +4.7/10.0
- Rent growth +4.1/5.0
- Livability +4.0/5.0
- Condition / age +3.8/5.0
- Appreciation +0.0/10.0
$400,000
🖨 Deal sheet 📄 Offer letter ✓ Due diligence
Multi-family units
County records classify this as Multi-Family (2-4 Unit). Listing-text estimate: 4 units. confirmed
Listing remarks
Elizabethtown Multi-Unit – Four individual units, each offering 1 bedroom, kitchen, living room, and full bath. Convenient location on a sidewalk-lined street with a yard and four easily accessible off-street parking spaces. Coin-operated laundry and a two-car garage provide additional income potential. Opportunity for investors seeking to add value and maximize returns.
Key facts
- Yard
- Convenient location
- Off-street parking
Tags
Property features AI
Finance
- Other: Unfinished basement
- Financial info: Fee simple ownership; Property has 4 total units (all one-bedroom); All 4 units leased month-to-month; Income includes apartment rentals and laundry
Exterior
- Parking: Detached 2-car garage (rear entry) with additional storage and oversized space; 4 off-street parking spaces; On-street parking; Total of 6 garage/parking spaces
- Utilities: Public water; Public sewer; Electric service
- Home design: Detached structure; Slate roof
- Construction: Frame construction with metal siding; Brick/mortar foundation; Built (year per assessor)
- Exterior features: Sidewalks; Porches; Multiple balconies; Level lot
Interior
- Kitchen: Eat-in kitchen
- Bedrooms: Entry-level bedroom(s)
- Flooring: Carpet
- Heating & cooling: Electric baseboard heating; Electric hot water
- Interior features: Attic; Tub with shower; Ceiling fans; Combination kitchen and dining; Dining area; Traditional floor plan
- Laundry & utility: On-site laundry income (laundry included in income)
Neighborhood map
What this means for you Summary
Snapshot
- This is a 4 × 1-bed/1.0-bath units multifamily listed at $400k. Condition is rated good.
Deal economics
- At list price, monthly cash flow is $1k ($17k/yr) — positive. Per door: $349/mo.
- The deal already cash-flows at list — no discount required.
- Meets the 1% rule at list price ($5k rent vs $400k).
- Cap rate 10.5% vs local median 3.1% in Elizabethtown — top-decile yield for the area; either an underpriced asset or a hidden risk that comps aren't pricing in. Stress-test before assuming the spread holds.
Location & tenants
- Location reads 80/100 on livability (#201 in PA, #1,759 nationally) — a professional / high-income tenant draw. Strengths: crime A+, cost of living A+, housing A+; Watch: commute F.
- Elizabethtown Area SD (suburban): math 46% / reading 62% proficiency, ranked #123 of 539 in PA (top 23%) — acceptable for families but not a draw, mixed tenant base, ~2y average lease.
- Market conditions: Rents rising fast (+6.5%/yr); 202 active listings in the ZIP; solid renter incomes; 1,093 units permitted in Lancaster County in 2024 (201 in 5+ unit buildings).
- At $5,267/mo this rent would consume 73% of the median local household income ($87k/yr) (locally 1404% of renters already pay >50% of income on rent) — very limited rent-growth headroom before tenants either downsize or default.
Forward outlook
- Local home prices are declining (-3.0%/yr); year-one equity from $3k of loan paydown is wiped out by about $12k of value loss. Plan a longer hold.
- Lancaster County population projected at +5% by 2050 — modest demand growth; plan on rents tracking national, not racing it.
- At projected returns (-3.0% appreciation + 6.5% rent growth), your $112k cash investment doubles in ~7 years — after that, you're playing with house money.
Negotiation context
- Only 6 days on market — expect competitive offers; lowballing is unlikely to land.
Risks & watch-outs
- Watch-outs: built in 1900 — expect roof / HVAC / electrical / plumbing capex.
- Climate carrying-cost: extreme-heat days projected 7→15/yr by 2055 (HVAC capex compounding) — expect insurance premiums to compound above CPI over the hold.
Questions for the listing agent
- Can we see the unit-by-unit rent roll, current vacancy, and any below-market leases? What's the average tenancy length?
- What capital expenditures (roof, boiler, parking lot, exteriors) have been made in the last 5 years, and what's planned in the next 2?
- Built in 1900 — when were the roof, HVAC, electrical panel, plumbing, and water heater last replaced?
- Is there a deadline driving the sale (1031 exchange, divorce, estate, relocation)? That informs how much negotiation room exists.
- Schools are A-rated — typically a magnet for longer-tenancy family renters. What's the average tenant stay here, and is there a school-zone premium baked into asking?
- What's the average days-on-market for RENTAL listings here right now (not sales)? A rising rental-DOM trend means longer vacancies and softer asking-rent achievability than the comps imply.
- What's the recent tenant-quality profile in this submarket — average credit score on applications, eviction rate, late-payment / NSF rate, and stable-employment percentage? A property-management company in the area should have these aggregated.
- How much new apartment / multifamily construction is in the pipeline within 1–3 miles? Heavy new supply (>2% of stock underway) typically softens rents 12–24 months out; light construction supports rent growth.
Investment metrics
- 1% rule
- 1.32% ✓
- Cap rate
- 10.48%
- Cash-on-cash
- 14.96%
- DSCR
- 1.67
- GRM
- 6.3
CMA / ARV
No comps found within radius.
Projected returns pro-forma
-3.0% appreciation · 6.52% rent growth · sell at horizon
- IRR
- 9.5%
- Equity multiple
- 1.39×
- Total profit
- $43,526
- Equity at exit
- $59,641
- IRR
- 21.4%
- Equity multiple
- 3.12×
- Total profit
- $237,969
- Equity at exit
- $34,585
Cash invested: $112,000 (down + closing). Projections, not guarantees.
Landlord ↔ Tenant lean methodology
- Overall (STATE)
- 62 Landlord-Friendly
- State Pennsylvania
- 62 Landlord-Friendly · EVEN
- County
- — inherits STATE
- City
- — inherits STATE
ZIP-level market 17022
- Home prices YoY
- -29.0%
- Rents YoY
- 6.5%
- Active inventory
- 202
- Price-to-rent
- 25.3×
Monthly cashflow live
- Estimated rent
- $5,267 medium interval (Pro) →
- Mortgage (P&I)
- −$2,098
- Tax est. 1.5%
- −$500 /mo · $6,000/yr
- Insurance
- −$167
- HOA
- −$0
- Vacancy / Maint / Mgmt
- −$1,106
- Net cashflow
- $1,397
Break-even live
4-unit breakdown (identical units grouped — click to expand)
| Units | Beds | Baths | Est. rent |
|---|---|---|---|
| 4× units | 1 | 1 | $5,268 |
| #1 | 1 | 1 | $1,317 |
| #2 | 1 | 1 | $1,317 |
| #3 | 1 | 1 | $1,317 |
| #4 | 1 | 1 | $1,317 |
| Total (4 units) | $5,267 | ||
UW: 25.0% down · 7.5% · 30yr · 1.5% tax · 5.0% vac · 8.0% maint · 8.0% mgmt
Financing live
Cash to close
- Down payment
- $100,000
- Closing costs
- $12,000
- Reserves months
- —
- Total cash needed
- —
Loan-product check · same deal, 3 products live
Conventional
25% down · 7.5% · 30yr
- Down + closing
- —
- Monthly P&I
- —
- Monthly cashflow
- —
- DSCR
- —
- Eligible?
- —
Personal DTI + credit; lowest rate.
DSCR
20% down · 8.5% · 30yr
- Down + closing
- —
- Monthly P&I
- —
- Monthly cashflow
- —
- DSCR
- —
- Eligible?
- —
No personal income docs; deal must DSCR.
Hard money
10% down · 12.0% · 12mo
- Down + closing
- —
- Monthly P&I
- —
- Monthly cashflow
- —
- DSCR
- —
- Eligible?
- —
Short-term bridge; refi at stabilization.
Listing history 7 events
-
2026-06-18status $400,000 Pending 6 DOM
-
2026-06-17days on market $400,000 Active 6 DOM
-
2026-06-16days on market $400,000 Active 5 DOM
-
2026-06-15days on market $400,000 Active 4 DOM
-
2026-06-14days on market $400,000 Active 2 DOM
-
2026-06-13remarks 373-char remark
-
2026-06-13$400,000 Active 1 DOM
ⓘ Source: listings_history table (triggers on properties + properties_extension) + one-shot
backfill from property_details.listing_events for pre-trigger history.
Climate risk First Street
- Flood 1/10 Low FEMA zone X (unshaded) · 0% chance over 30 yrs
- Wildfire 1/10 Low
- Heat 5/10 Major 7 d/yr ≥101°F today · 15 d/yr by 30 yrs out
- Wind 4/10 Moderate 10% chance of damaging wind over 30 yrs
- Air quality 4/10 Moderate 4 unhealthy d/yr today · 5 by 30 yrs out
Nearby sold comps map
Loading sold comps map…
Walkable amenities ~0.75 mi
Loading nearby amenities…
Taxation est. · year 1
- Rental income
- $63,204
- − Mortgage interest
- −$22,406
- − Property taxes
- −$6,000
- − Insurance
- −$2,000
- − Repairs & maintenance
- −$5,056
- − Management
- −$5,056
- − Depreciation
- −$11,636
- Taxable income
- $11,049
- Est. tax owed @ 24.0%
- −$2,652
- After-tax cash flow
- $14,108/yr
For passive investors: Depreciation is non-cash, so a rental often shows a tax loss while cash-flowing — sheltering income. Rental losses are passive: they offset passive income freely, and up to $25,000/yr can offset ordinary (W-2) income if you actively participate and your MAGI is under $100k (phasing out to $0 by $150k); unused losses carry forward. On sale, claimed depreciation is recaptured at up to 25%, and gains may owe capital-gains tax (a 1031 exchange can defer both). Figures are a year-1 estimate at your 24.0% rate — not tax advice; consult a CPA.
Condition & rehab AI · 2 photos
This multi-family property is in good condition with a well-maintained exterior and interior. Painting the exterior and maintaining the landscaping would significantly enhance its curb appeal and value.
Value-add opportunities
- Both Paint exterior — Enhances curb appeal and can increase both resale and rental value.
- Both Landscaping — Improves curb appeal and can attract more potential tenants or buyers.
- Both HVAC maintenance — Ensures the system is functioning properly and can improve both resale and rental value by providing a comfortable living environment.
Renovation cost estimate screening
Value-add ROI direction
- Both Paint exterior — Enhances curb appeal and can increase both resale and rental value. ↑
- Both Landscaping — Improves curb appeal and can attract more potential tenants or buyers. ↑
- Both HVAC maintenance — Ensures the system is functioning properly and can improve both resale and rental value by providing a comfortable living environment. ↑
ⓘ Cost ranges are severity-bucket heuristics (US national rule-of-thumb). Get contractor quotes + a written scope before underwriting a rehab budget.
Schools (NCES district)
- District
- Elizabethtown Area SD
- NCES district ID
- 4209120
- Math proficiency
- 46% ▼ -10.00%
- Reading proficiency
- 62% ▼ -8.00%
- Median HH income
- $59,380
- Composite
- 46.94/100
- National rank
- #2361
- State rank
- #123 of 539 in PA
Livability — Elizabethtown
- Score
- 80/100
- State rank
- #201
- US rank
- #1759
Category grades
Schools grade is shown separately in the Schools card above.
Census & demographics
- Census place
- Elizabethtown, PA
- County
- Lancaster County · 390,309 people
- City population
- 31,908
- Metro
- Lancaster, PA
- Population (ZIP)
- 31,908
- Household income
- $86,767
- Rent vs Own
- Severe rent burden
- 1404.0
Population outlook (Lancaster County) Hauer SSP2
- Today (2025)
- 561,011 people
- By 2030
- 570,969 · +1.8%
- By 2040
- 585,929 · +4.4%
- By 2050
- 591,056 · +5.4%
- By 2075
- 594,747 · +6.0%
- By 2100
- 558,850 · -0.4%
Race, ethnicity, and origin ACS 2023
- Neighborhood character
- Predominantly White (89%)
- Race & ethnicity
- White 89% Hispanic / Latino 6% Two or more races 4% Black 1% Asian 1%
- Hispanic origin (detail)
- Mexican 1% Puerto Rican 2%
- Common ancestry
- Romanian 4% Lithuanian 2% Slovak 2%
- Foreign-born
- 3% · Canada
- Languages at home
- 96% English-only · Spanish 2% Other Asian/Pacific 1%
Political lean MEDSL · Lancaster
- 2024 margin
- R (+15.9) · D 41.5% · R 57.5%
- 2008→2024 swing
- -4.1pp toward R · 2008: -11.8pp · 2024: -15.9pp
- All cycles
- 2024: R+15.9 2020: R+15.8 2016: R+19.7 2012: R+19.2 2008: R+11.8
Not yet ingested
- Civics
- —
Market trends
- HPI YoY
- ▼ -108.73%
- Current HPI
- 266.3184
- Rent YoY
- ▲ 6.52%
- Metro
- Lancaster, PA
- State GDP YoY
- ▲ 1.68%
- F500 in state
- 34
Industry mix (Fortune 500 HQ in PA)
| Industry | F500 HQs | Revenue |
|---|---|---|
| Healthcare | 2 | $309B |
|
||
| Insurance | 2 | $27B |
|
||
| Telecommunications / Media | 1 | $124B |
|
||
| Industrial Distribution | 1 | $22B |
|
||
| Financial Services | 1 | $20B |
|
||
| Chemicals / Materials | 1 | $18B |
|
||
Price history
1 event — show timeline
- 2026-06-11 Listed $400,000 BRIGHT MLS
Cash-flow waterfall
monthlySold comps — $/sqft
last 12 mo · ≤1 miLoading sold comps…