 🏷️ Likely Rental
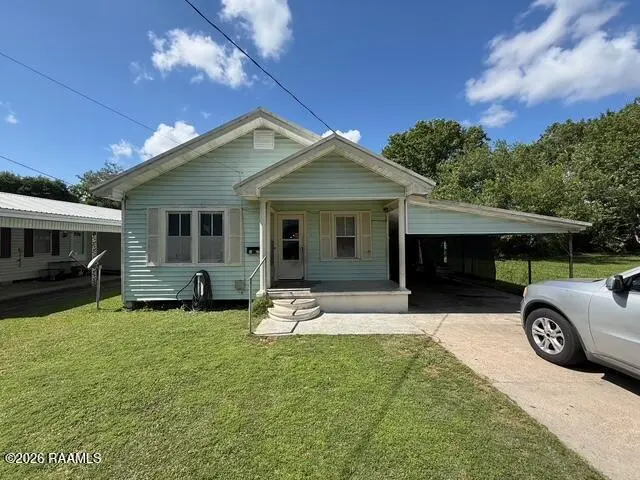
1022 Providence St · New Iberia, LA
Flood risk 4/10 · Minor
- FEMA flood zone
- X (unshaded)
- Chance of flooding over 30 yrs
- 0.22%
- Est. flood insurance / yr
- $507 – $1,088
Fire risk 1/10 · Minimal
- Est. fire insurance / yr
- $1,269 – $2,357
Heat risk 9/10 · Severe
- Hot days now (above 109°F)
- 7 days/yr
- Hot days in 30 yrs
- 22 days/yr
Wind risk 9/10 · Severe
- Chance of severe wind over 30 yrs
- 99.0%
Air-quality risk 2/10 · Minimal
- Unhealthy air days now
- 1 days/yr
- Unhealthy air days in 30 yrs
- 1 days/yr
Risk factors via First Street. Map © Google.
Why this score? — see what drove the B+ grade
The composite is a weighted blend of 9 inputs, each scored 0–100. Each bar is that input's sub-score; the figure is the points it added to the 100-point composite (weight × sub-score).
- Cash flow +30.0/30.0
- ARV discount +15.0/15.0
- 1% rule +10.0/10.0
- DSCR +10.0/10.0
- Livability +3.7/5.0
- Schools +3.2/10.0
- Rent growth +2.5/5.0
- Condition / age +2.5/5.0
- Appreciation +0.0/10.0
$57,888
🖨 Deal sheet 📄 Offer letter ✓ Due diligence
Listing remarks MLS
Very unique investment property opportunity! This rental is currently generating $675 per month with long-term tenants who would like to stay in place, providing immediate income for the new owner. This 1,202 SF, 3-bedroom, 1-bath home also features a massive 30' x 50' metal shop on slab totaling approximately 1,500 square feet -- a rare and valuable bonus, complete with oversized doors on both the front and back for easy drive-through access.The home includes a 2-car carport and on-site laundry. The property is professionally managed by Keaty Property Management and is located at the end of a quiet dead-end street.Low-maintenance features include a durable metal roof and vinyl siding, making this an excellent investment that easily meets the 1% rule. The home includes a gas cooktop, dishwasher, and refrigerator. A washer and dryer are already in place, along with a newer hot water heater located under the carport.Interior finishes include renter-friendly paneling walls and vinyl sheet flooring. There is some floor damage in the dining area, and the price reflects this condition. The home is cooled with window AC units and also offers a chain-link fenced backyard.
Key facts
- Metal shop
- Long-term tenants
- 2-car carport
Tags
Neighborhood map
What this means for you Summary
Snapshot
- This is a 3-bed/1.0-bath manufactured listed at $58k.
Deal economics
- At list price, monthly cash flow is $312 ($4k/yr) — positive.
- The deal already cash-flows at list — no discount required.
- Meets the 1% rule at list price ($868 rent vs $58k).
- Recommended offer: $56k (3.0% below list) — sets the bar for market timing.
- Cap rate 12.8% vs local median 5.8% in New Iberia — top-decile yield for the area; either an underpriced asset or a hidden risk that comps aren't pricing in. Stress-test before assuming the spread holds.
Location & tenants
- Location reads 73/100 on livability (#33 in LA) — a middle-class / working-renter tenant base. Strengths: cost of living A+, housing A+, health & safety A+; Watch: commute D+, crime F, employment F.
- Iberia Parish (other): math 32% / reading 43% proficiency, ranked #27 of 98 in LA (top 28%) — families likely to look elsewhere, expect single-tenant / working-renter base with shorter leases; 66% free/reduced lunch — lower-income household profile, screen leases tightly.
- Market conditions: 237 active listings in the ZIP; 4 comparable units currently listed for rent nearby; rentals lingering (median 44d on market — plan ~5-8 weeks vacancy on turnover, expect pricing pressure); 75% of comp listings sitting > 30 days — soft ceiling on asking rent; 94 units permitted in Iberia Parish in 2024 (0 in 5+ unit buildings).
Forward outlook
- Local home prices are declining (-3.0%/yr); year-one equity from $400 of loan paydown is wiped out by about $2k of value loss. Plan a longer hold.
- Iberia County population projected to shrink 4% by 2050 — rents likely to lag national; underwrite the cash flow, not the appreciation.
- At projected returns (-3.0% appreciation + 3.0% rent growth), your $16k cash investment doubles in ~6 years — after that, you're playing with house money.
Negotiation context
- It's been on market 60 days — a 3% lower offer ($56k) is reasonable based on typical stale-listing flexibility.
Risks & watch-outs
- Climate carrying-cost: severe wind risk, 99% chance of damaging wind over 30y; extreme-heat days projected 7→22/yr by 2055 (HVAC capex compounding) — expect insurance premiums to compound above CPI over the hold.
Questions for the listing agent
- It's been on market 60 days. Have you received any prior offers? Is the seller open to a 3% concession, seller financing, or rate buy-down credit?
- Is there a deadline driving the sale (1031 exchange, divorce, estate, relocation)? That informs how much negotiation room exists.
- Schools are B-rated — typically a magnet for longer-tenancy family renters. What's the average tenant stay here, and is there a school-zone premium baked into asking?
- Crime grade is F in this area — have there been break-ins, vandalism, or insurance claims at this property in the last 3 years? What carrier currently insures it and at what premium?
- What's the average days-on-market for RENTAL listings here right now (not sales)? A rising rental-DOM trend means longer vacancies and softer asking-rent achievability than the comps imply.
- What's the recent tenant-quality profile in this submarket — average credit score on applications, eviction rate, late-payment / NSF rate, and stable-employment percentage? A property-management company in the area should have these aggregated.
- How much new for-sale + rental construction is in the pipeline within 1–3 miles? Heavy new supply typically softens prices + rents 12–24 months out; constrained supply supports both.
Investment metrics
- 1% rule
- 1.50% ✓
- Cap rate
- 12.77%
- Cash-on-cash
- 23.13%
- DSCR
- 2.03
- GRM
- 5.6
CMA / ARV
- ARV (median comp)
- $75,387
- List price
- $57,888
- Delta
- -23.21%
- Verdict
- UNDERPRICED
- Comps
- 20 within 1.0 mi
Show comp detail 1 sale within ~0.75 mi
| Address | Dist | Beds/Ba | Sqft | Sold | Price | $/sf | Match |
|---|---|---|---|---|---|---|---|
| 934 Weeks St | 0.22mi | 3/2.0 | 1,200 (-0%) | 4mo | $45,000 | $38 | 83 |
Match score weights: distance 35% · size 25% · config 20% · recency 20%. Top-matched comps best support the ARV.
Projected returns pro-forma
-3.0% appreciation · 3.0% rent growth · sell at horizon
- IRR
- 16.1%
- Equity multiple
- 1.65×
- Total profit
- $10,511
- Equity at exit
- $8,631
- IRR
- 24.7%
- Equity multiple
- 3.14×
- Total profit
- $34,755
- Equity at exit
- $5,005
Cash invested: $16,209 (down + closing). Projections, not guarantees.
Landlord ↔ Tenant lean methodology
- Overall (STATE)
- 90 Strongly Landlord-Friendly
- State Louisiana
- 90 Strongly Landlord-Friendly · R+12
- County
- — inherits STATE
- City
- — inherits STATE
ZIP-level market 70560
- Home prices YoY
- -29.8%
- Active inventory
- 237
- Price-to-rent
- 5.6×
Monthly cashflow live
- Estimated rent
- $868 medium interval (Pro) →
- Mortgage (P&I)
- −$304
- Tax from tax record
- −$45 /mo · $544/yr
- Insurance
- −$24
- HOA
- −$0
- Vacancy / Maint / Mgmt
- −$182
- Net cashflow
- $312
Break-even live
UW: 25.0% down · 7.5% · 30yr · 1.5% tax · 5.0% vac · 8.0% maint · 8.0% mgmt
Financing live
Cash to close
- Down payment
- $14,472
- Closing costs
- $1,737
- Reserves months
- —
- Total cash needed
- —
Loan-product check · same deal, 3 products live
Conventional
25% down · 7.5% · 30yr
- Down + closing
- —
- Monthly P&I
- —
- Monthly cashflow
- —
- DSCR
- —
- Eligible?
- —
Personal DTI + credit; lowest rate.
DSCR
20% down · 8.5% · 30yr
- Down + closing
- —
- Monthly P&I
- —
- Monthly cashflow
- —
- DSCR
- —
- Eligible?
- —
No personal income docs; deal must DSCR.
Hard money
10% down · 12.0% · 12mo
- Down + closing
- —
- Monthly P&I
- —
- Monthly cashflow
- —
- DSCR
- —
- Eligible?
- —
Short-term bridge; refi at stabilization.
Rent comps 4 comps
| Address | Beds | Baths | Sqft | Rent | $/sqft | DOM | Units | Dist |
|---|---|---|---|---|---|---|---|---|
| 212 Hacker St New Iberia, LA | 2.0 | 1.0 | 1000 | $950 | $0.95 | 43d | 1 | 0.46mi |
| 1500 Adam St New Iberia, LA | 2.0 | 1.0 | 800 | $850 | $1.06 | 43d | 1 | 0.49mi |
| 405 Anderson St New Iberia, LA | 2.0 | 1.0 | 950 | $650 | $0.68 | 43d | 1 | 1.00mi |
| 713 W Admiral Doyle Dr New Iberia, LA | 2.0 | 1.0 | 830 | $938 | $1.13 | 13d | 5 | 1.05mi |
Listing history 18 events
-
2026-06-18days on market $57,888 Active 60 DOM
-
2026-06-17days on market $57,888 Active 59 DOM
-
2026-06-16days on market $57,888 Active 58 DOM
-
2026-06-15days on market $57,888 Active 57 DOM
-
2026-06-14days on market $57,888 Active 55 DOM
-
2026-06-13days on market $57,888 Active 54 DOM
-
2026-06-10days on market $57,888 Active 52 DOM
-
2026-06-09days on market $57,888 Active 51 DOM
-
2026-06-08days on market $57,888 Active 50 DOM
-
2026-06-07days on market $57,888 Active 49 DOM
-
2026-06-05days on market $57,888 Active 46 DOM
-
2026-06-03days on market $57,888 Active 45 DOM
-
2026-06-02days on market $57,888 Active 44 DOM
-
2026-06-01days on market $57,888 Active 43 DOM
-
2026-05-31days on market $57,888 Active 42 DOM
-
2026-05-30days on market $57,888 Active 41 DOM
-
2026-04-19$57,888 Active 1182-char remark
Show marketing remark (1182 chars)
Very unique investment property opportunity! This rental is currently generating $675 per month with long-term tenants who would like to stay in place, providing immediate income for the new owner. This 1,202 SF, 3-bedroom, 1-bath home also features a massive 30' x 50' metal shop on slab totaling approximately 1,500 square feet -- a rare and valuable bonus, complete with oversized doors on both the front and back for easy drive-through access.The home includes a 2-car carport and on-site laundry. The property is professionally managed by Keaty Property Management and is located at the end of a quiet dead-end street.Low-maintenance features include a durable metal roof and vinyl siding, making this an excellent investment that easily meets the 1% rule. The home includes a gas cooktop, dishwasher, and refrigerator. A washer and dryer are already in place, along with a newer hot water heater located under the carport.Interior finishes include renter-friendly paneling walls and vinyl sheet flooring. There is some floor damage in the dining area, and the price reflects this condition. The home is cooled with window AC units and also offers a chain-link fenced backyard.
-
2015-03-17soldstatus $70,000
ⓘ Source: listings_history table (triggers on properties + properties_extension) + one-shot
backfill from property_details.listing_events for pre-trigger history.
Tax reassessment forecast LA · Resets to sale price
- Current annual tax
- $544 · $45/mo
- Projected year-2 tax
- $544 · $45/mo
- Expected delta
- $0/yr ($0/mo · 0.0%)
ⓘ Screening estimate from a state-policy table — verify with the county assessor before closing.
Climate risk First Street
- Flood 4/10 Moderate FEMA zone X (unshaded) · 22% chance over 30 yrs
- Wildfire 1/10 Low
- Heat 9/10 Extreme 7 d/yr ≥109°F today · 22 d/yr by 30 yrs out
- Wind 9/10 Extreme 99% chance of damaging wind over 30 yrs
- Air quality 2/10 Low 1 unhealthy d/yr today · 1 by 30 yrs out
Nearby sold comps map
Loading sold comps map…
Walkable amenities ~0.75 mi
Loading nearby amenities…
Taxation est. · year 1
- Rental income
- $10,411
- − Mortgage interest
- −$3,243
- − Property taxes
- −$544
- − Insurance
- −$289
- − Repairs & maintenance
- −$833
- − Management
- −$833
- − Depreciation
- −$1,684
- Taxable income
- $2,985
- Est. tax owed @ 24.0%
- −$716
- After-tax cash flow
- $3,032/yr
For passive investors: Depreciation is non-cash, so a rental often shows a tax loss while cash-flowing — sheltering income. Rental losses are passive: they offset passive income freely, and up to $25,000/yr can offset ordinary (W-2) income if you actively participate and your MAGI is under $100k (phasing out to $0 by $150k); unused losses carry forward. On sale, claimed depreciation is recaptured at up to 25%, and gains may owe capital-gains tax (a 1031 exchange can defer both). Figures are a year-1 estimate at your 24.0% rate — not tax advice; consult a CPA.
Schools (NCES district)
- District
- Iberia Parish
- NCES district ID
- 2200720
- Math proficiency
- 32% ▼ -43.00%
- Reading proficiency
- 43% ▼ -35.00%
- Median HH income
- $43,289
- Composite
- 31.74/100
- National rank
- #5904
- State rank
- #27 of 98 in LA
Livability — New Iberia
- Score
- 73/100
- State rank
- #33
- US rank
- #5376
Category grades
Schools grade is shown separately in the Schools card above.
Census & demographics
- Census place
- New Iberia, LA
- Population (ZIP)
- 37,589
Population outlook (Iberia County) Hauer SSP2
- Today (2025)
- 74,632 people
- By 2030
- 74,368 · -0.4%
- By 2040
- 73,223 · -1.9%
- By 2050
- 71,728 · -3.9%
- By 2075
- 69,028 · -7.5%
- By 2100
- 65,018 · -12.9%
Race, ethnicity, and origin ACS 2023
- Neighborhood character
- Diverse neighborhood (Simpson 0.61)
- Race & ethnicity
- White 52% Black 35% Two or more races 8% Hispanic / Latino 6% Asian 2%
- Hispanic origin (detail)
- Mexican 2%
- Common ancestry
- Lithuanian 11% Italian 1% Serbian 1%
- Foreign-born
- 3% · Canada
- Languages at home
- 93% English-only · French/Haitian/Cajun 3% Spanish 2% Other Asian/Pacific 1%
Political lean MEDSL · Iberia
- 2024 margin
- Solid R (+34.1) · D 32.4% · R 66.5% · Other 1.1%
- 2008→2024 swing
- -11.1pp toward R · 2008: -23.0pp · 2024: -34.1pp
- All cycles
- 2024: R+34.1 2020: R+31.2 2016: R+31.4 2012: R+26.2 2008: R+23.0
Not yet ingested
- Civics
- —
Market trends
- HPI YoY
- ▼ -65.82%
- Current HPI
- 154.9018
- Rent YoY
- —
- Metro
- —
- State GDP YoY
- ▲ 3.29%
- F500 in state
- 10
Industry mix (Fortune 500 HQ in LA)
| Industry | F500 HQs | Revenue |
|---|---|---|
| Telecommunications | 2 | $23B |
|
||
| Utilities | 1 | $12B |
|
||
| Wholesale / Distribution | 1 | $5B |
|
||
| Advertising | 1 | $2B |
|
||
Price history
-17.3% since first listed2 events — show timeline
- 2026-04-19 Listed $57,888 AcadianaMLS
- 2015-03-17 Sold (Public Records) $70,000 Public Records
Property tax history
+2.0%/yrLatest (2025): $544 · +2.0% YoY. Source: county tax records.
Cash-flow waterfall
monthlySold comps — $/sqft
last 12 mo · ≤1 miLoading sold comps…