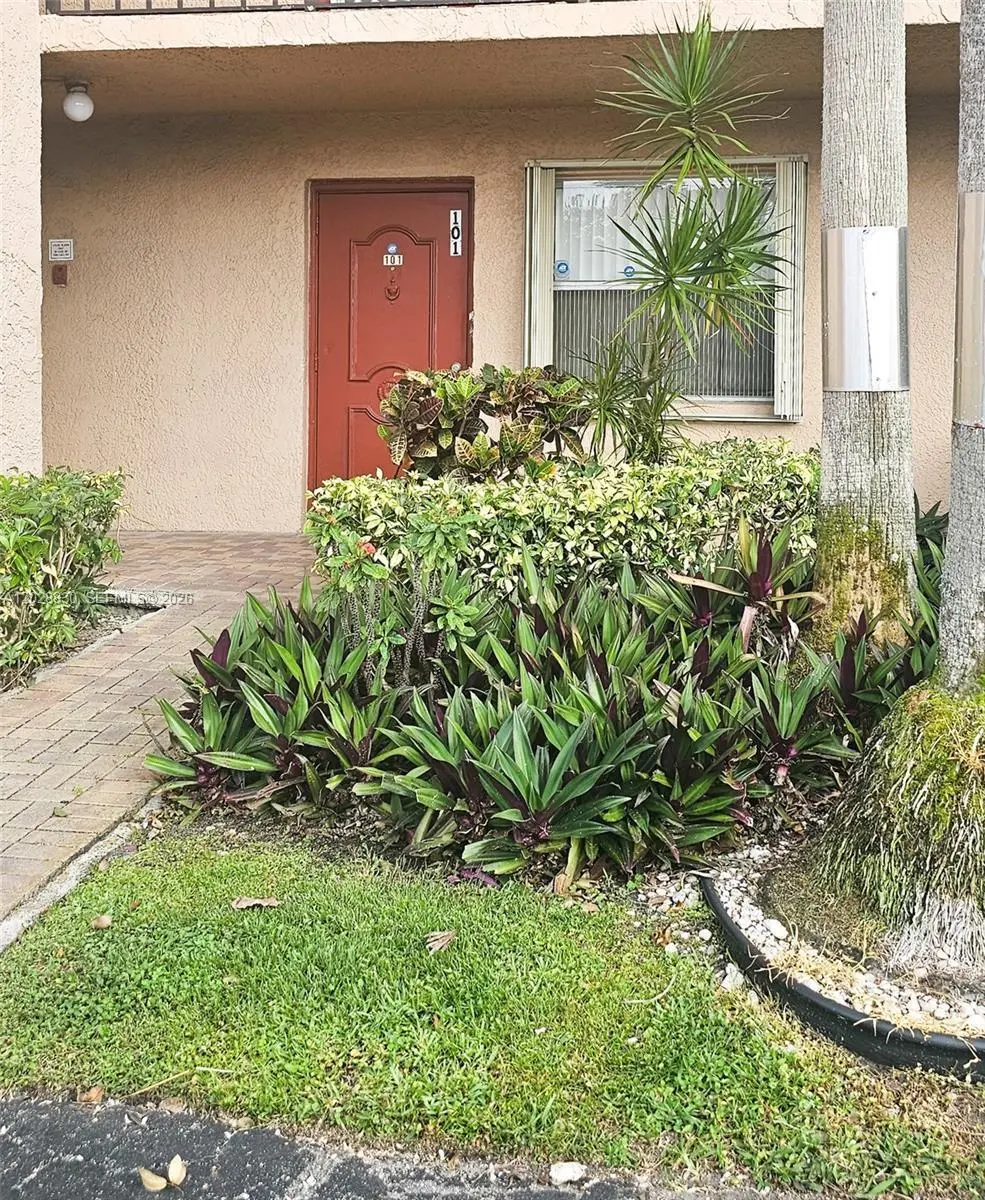
7220 Lake Cir Dr #101 · Margate, FL
Flood risk 1/10 · Minimal
- FEMA flood zone
- X (shaded)
- Chance of flooding over 30 yrs
- 0.0%
- Est. flood insurance / yr
- $507 – $1,088
Fire risk 1/10 · Minimal
- Est. fire insurance / yr
- $947 – $1,759
Heat risk 9/10 · Severe
- Hot days now (above 106°F)
- 7 days/yr
- Hot days in 30 yrs
- 28 days/yr
Wind risk 10/10 · Severe
- Chance of severe wind over 30 yrs
- 99.0%
Air-quality risk 3/10 · Minor
- Unhealthy air days now
- 3 days/yr
- Unhealthy air days in 30 yrs
- 3 days/yr
Risk factors via First Street. Map © Google.
Why this score? — see what drove the D grade
The composite is a weighted blend of 9 inputs, each scored 0–100. Each bar is that input's sub-score; the figure is the points it added to the 100-point composite (weight × sub-score).
- 1% rule +10.0/10.0
- Cash flow +7.9/30.0
- ARV discount +7.5/15.0
- Schools +4.1/10.0
- Livability +4.0/5.0
- Rent growth +3.0/5.0
- Condition / age +2.5/5.0
- DSCR +1.9/10.0
- Appreciation +0.0/10.0
$119,000
🖨 Deal sheet 📄 Offer letter ✓ Due diligence
Listing remarks MLS
Spacious first floor condo with fully a/c florida room with floor to ceiling windows. Freshly painted and move-in-ready. Updates to both Bathrooms and freshly cleaned carpets. Furniture is available or unfurnished. The community features 2 heated pools, tennis courts, clubhouse. Rare to find 55+ community that allows 2 pets under 20 lbs. Association requires min 650 credit score of 1 owner.
Key facts
- $773 HOA
- Parking
- Community pool
Property features AI
Finance
- Other: Association pool available
- Financial info: Pets are allowed
- HOA & community: Quarterly association fee; Association covers amenities, common areas, structure maintenance, parking, roof, and water; Community amenities include clubhouse, association pool, and elevators; Senior community
Exterior
- Parking: One parking space
- Utilities: Water service included in association; Electric service; Sewer service
- Home design: Attached property; 4-story building; Entry on level 1; Faces east
- Construction: Block construction; Effective year built
- Exterior features: Patio; No other exterior features listed
Interior
- Kitchen: Dryer; Dishwasher; Electric range; Refrigerator; Washer
- Bedrooms: Bedroom on main level
- Flooring: Carpet; Ceramic tile; Hardwood; Wood
- Bathrooms: 2 full bathrooms
- Heating & cooling: Central heating (electric); Central air; Ceiling fans; Electric cooling
- Interior features: First-floor entry; Bedroom on main level
- Laundry & utility: Washer and dryer included
Neighborhood map
What this means for you Summary
Snapshot
- This is a 2-bed/2.0-bath condo listed at $119k.
Deal economics
- At list price, monthly cash flow is $-128 ($-2k/yr) — negative.
- To cash-flow at today's rent, offer at most $96k (19.0% below list).
- Meets the 1% rule at list price ($2k rent vs $119k).
- Recommended offer: $96k (19.0% below list) — sets the bar for cash-flow.
Location & tenants
- Location reads 81/100 on livability (#85 in FL, #1,398 nationally) — a professional / high-income tenant draw. Strengths: commute A+, housing A+, health & safety A+; Watch: amenities F.
- Broward (suburban): math 42% / reading 53% proficiency, ranked #46 of 73 in FL (top 63%) — families likely to look elsewhere, expect single-tenant / working-renter base with shorter leases.
- Market conditions: Rents rising (+1.9%/yr); 548 active listings in the ZIP; 40 comparable units currently listed for rent nearby; rentals at typical pace (median 22d on market — plan ~3-4 weeks tenant-placement turnaround); 2,111 units permitted in Broward County in 2024 (1,265 in 5+ unit buildings).
- This rent runs 36% of the median local income ($63k/yr) — at the standard rent-burdened threshold; future hikes will face affordability resistance.
Forward outlook
- Local home prices are declining (-3.0%/yr); year-one equity from $823 of loan paydown is wiped out by about $4k of value loss. Plan a longer hold.
- Broward County population projected at +34% by 2050 — long-run rental-demand tailwind backs the buy-and-hold thesis.
Negotiation context
- Only 12 days on market — expect competitive offers; lowballing is unlikely to land.
- 2 sale attempts since 8y ago with the ask held roughly flat each time — persistent listings suggest the price (not the market) is what's stuck; bring a comps-based counter.
Risks & watch-outs
- Watch-outs: HOA is 40% of rent.
- Climate carrying-cost: severe wind risk, 99% chance of damaging wind over 30y; extreme-heat days projected 7→28/yr by 2055 (HVAC capex compounding) — expect insurance premiums to compound above CPI over the hold.
Questions for the listing agent
- What do current leases actually rent for vs. the listed asking? Can we see a recent rent roll and the last 12 months of T-12 income?
- What does the HOA fee cover, when was the last increase, and are there any pending special assessments or reserve-fund shortfalls?
- Any open or pending special assessments — roof, HVAC, plumbing, elevator, façade? What's the per-unit balance and payoff schedule, and is the seller paying it off at close or rolling it to the buyer?
- Is there a deadline driving the sale (1031 exchange, divorce, estate, relocation)? That informs how much negotiation room exists.
- The area grade is low — what's the realistic commute time and amenity access for the typical tenant pool here? Any planned neighborhood developments (good or bad) we should know about?
- What's the average days-on-market for RENTAL listings here right now (not sales)? A rising rental-DOM trend means longer vacancies and softer asking-rent achievability than the comps imply.
- What's the recent tenant-quality profile in this submarket — average credit score on applications, eviction rate, late-payment / NSF rate, and stable-employment percentage? A property-management company in the area should have these aggregated.
- How much new apartment / multifamily construction is in the pipeline within 1–3 miles? Heavy new supply (>2% of stock underway) typically softens rents 12–24 months out; light construction supports rent growth.
Investment metrics
- 1% rule
- 1.60% ✓
- Cap rate
- 5.00%
- Cash-on-cash
- -4.61%
- DSCR
- 0.79
- GRM
- 5.2
CMA / ARV
No comps found within radius.
Projected returns pro-forma
-3.0% appreciation · 1.94% rent growth · sell at horizon
- IRR
- -26.0%
- Equity multiple
- 0.13×
- Total profit
- $-28,919
- Equity at exit
- $17,743
- IRR
- -29.6%
- Equity multiple
- -0.25×
- Total profit
- $-41,621
- Equity at exit
- $10,289
Cash invested: $33,320 (down + closing). Projections, not guarantees.
Landlord ↔ Tenant lean methodology
- Overall (STATE)
- 87 Strongly Landlord-Friendly
- State Florida
- 87 Strongly Landlord-Friendly · R+3
- County
- — inherits STATE
- City
- — inherits STATE
ZIP-level market 33063
- Home prices YoY
- -18.1%
- Rents YoY
- 1.9%
- Active inventory
- 548
- Price-to-rent
- 5.2×
Monthly cashflow live
- Estimated rent
- $1,909 high interval (Pro) →
- Mortgage (P&I)
- −$624
- Tax from tax record
- −$190 /mo · $2,274/yr
- Insurance
- −$50
- HOA
- −$773
- Vacancy / Maint / Mgmt
- −$401
- Net cashflow
- $-128
Break-even live
UW: 25.0% down · 7.5% · 30yr · 1.5% tax · 5.0% vac · 8.0% maint · 8.0% mgmt
Financing live
Cash to close
- Down payment
- $29,750
- Closing costs
- $3,570
- Reserves months
- —
- Total cash needed
- —
Loan-product check · same deal, 3 products live
Conventional
25% down · 7.5% · 30yr
- Down + closing
- —
- Monthly P&I
- —
- Monthly cashflow
- —
- DSCR
- —
- Eligible?
- —
Personal DTI + credit; lowest rate.
DSCR
20% down · 8.5% · 30yr
- Down + closing
- —
- Monthly P&I
- —
- Monthly cashflow
- —
- DSCR
- —
- Eligible?
- —
No personal income docs; deal must DSCR.
Hard money
10% down · 12.0% · 12mo
- Down + closing
- —
- Monthly P&I
- —
- Monthly cashflow
- —
- DSCR
- —
- Eligible?
- —
Short-term bridge; refi at stabilization.
Rent comps 40 comps
| Address | Beds | Baths | Sqft | Rent | $/sqft | DOM | Units | Dist |
|---|---|---|---|---|---|---|---|---|
| 357 N Rock Island Rd #207 Margate, FL | 2.0 | 2.0 | 1100 | $1,720 | $1.56 | 24d | 1 | 0.09mi |
| 357 N Rock Island Rd #306 Margate, FL | 2.0 | 2.0 | 1300 | $1,850 | $1.42 | 22d | 1 | 0.09mi |
| 357 N Rock Island Rd #207 Margate, FL | 2.0 | 2.0 | 1100 | $1,720 | $1.56 | 10d | 1 | 0.09mi |
| 357 N Rock Island Rd #407 Margate, FL | 2.0 | 2.0 | 1100 | $1,700 | $1.55 | 3d | 1 | 0.09mi |
| 7300 Lake Circle Dr #107 Margate, FL | 2.0 | 2.0 | 1100 | $1,850 | $1.68 | 14d | 1 | 0.09mi |
| 7431 NW 1st St Margate, FL | 2.0 | 2.0 | 1100 | $1,900 | $1.73 | 24d | 1 | 0.10mi |
| 7561 NW 1st St #204 Margate, FL | 1.0 | 2.0 | 960 | $1,750 | $1.82 | 5d | 1 | 0.11mi |
| 7205 W Atlantic Blvd #101 Margate, FL | 2.0 | 2.0 | 990 | $1,500 | $1.52 | 24d | 1 | 0.19mi |
| 260 NW 76th Ave #404 Margate, FL | 1.0 | 2.0 | 960 | $1,500 | $1.56 | 24d | 1 | 0.20mi |
| 260 NW 76th Ave #406 Margate, FL | 2.0 | 2.0 | 1100 | $1,700 | $1.55 | 24d | 1 | 0.20mi |
| 370 NW 76th Ave #202 Margate, FL | 2.0 | 2.0 | 1100 | $1,950 | $1.77 | 11d | 1 | 0.21mi |
| 7300 NW 4th Pl #101 Margate, FL | 2.0 | 2.0 | 990 | $1,400 | $1.41 | 20d | 1 | 0.22mi |
| 480 NW 76th Ave #105 Margate, FL | 1.0 | 2.0 | 960 | $1,500 | $1.56 | 24d | 1 | 0.23mi |
| 7500 NW 4th Pl Margate, FL | 2.0 | 2.0 | 990 | $1,850 | $1.87 | 24d | 1 | 0.27mi |
| 7500 NW 4th Pl Margate, FL | 2.0 | 2.0 | 990 | $1,850 | $1.87 | 3d | 1 | 0.27mi |
| 7600 NW 4th Pl #207 Margate, FL | 2.0 | 2.0 | 990 | $1,700 | $1.72 | 24d | 1 | 0.31mi |
| 7461 SW 1st St Margate, FL | 3.0 | 2.0 | 1350 | $3,200 | $2.37 | 12d | 1 | 0.32mi |
| 7305 NW 5th Pl #206 Margate, FL | 2.0 | 2.0 | 990 | $1,650 | $1.67 | 24d | 1 | 0.34mi |
| 7600 NW 5th Pl #106 Margate, FL | 2.0 | 2.0 | 990 | $1,600 | $1.62 | 24d | 1 | 0.37mi |
| 7605 NW 5th Pl #106 Margate, FL | 2.0 | 2.0 | 990 | $1,500 | $1.52 | 24d | 1 | 0.40mi |
| 7814 NW 1st Ct Margate, FL | 3.0 | 2.0 | 1469 | $2,950 | $2.01 | 7d | 1 | 0.43mi |
| 7306 SW 3rd Ct North Lauderdale, FL | 3.0 | 2.0 | 1288 | $2,685 | $2.08 | 20d | 1 | 0.46mi |
| 6777 NW 4th St Margate, FL | 3.0 | 2.0 | 1306 | $3,600 | $2.76 | 24d | 1 | 0.48mi |
| 272 NW 79th Ave Margate, FL | 3.0 | 2.0 | 1433 | $3,500 | $2.44 | 2d | 1 | 0.49mi |
| 1010 NW 72nd Ter Margate, FL | 2.0 | 1.5 | 1061 | $2,200 | $2.07 | 7d | 1 | 0.57mi |
| 1010 NW 72nd Ter Margate, FL | 2.0 | 1.5 | 1061 | $2,250 | $2.12 | 17d | 1 | 0.57mi |
| 7897 Golf Circle Dr #108 Margate, FL | 1.0 | 1.5 | 775 | $1,450 | $1.87 | 16d | 1 | 0.57mi |
| 551 Kathy Ct Margate, FL | 2.0 | 1.0–2.0 | 851 | $1,945 | $2.29 | 3d | 2 | 0.58mi |
| 563 Kathy Ct Margate, FL | 2.0 | 2.0 | 875 | $2,035 | $2.33 | 24d | 1 | 0.60mi |
| 1045 NW 73rd Ave Margate, FL | 2.0 | 1.0 | 1036 | $2,500 | $2.41 | 24d | 1 | 0.61mi |
| 568 Kathy Ct Margate, FL | 2.0 | 2.0 | 875 | $1,995 | $2.28 | 24d | 1 | 0.61mi |
| 1010 Country Club Dr #206 Margate, FL | 1.0 | 1.5 | 775 | $1,450 | $1.87 | 24d | 1 | 0.64mi |
| 7897 Golf Circle Dr Margate, FL | 1.0–2.0 | 1.0–1.5 | 757 | $1,450 | $1.92 | 5d | 2 | 0.64mi |
| 631 Kathy Ct Margate, FL | 2.0 | 2.0 | 875 | $1,995 | $2.28 | 17d | 1 | 0.68mi |
| 1005 Country Club Dr Margate, FL | 2.0 | 2.0 | 925 | $1,475 | $1.59 | 22d | 2 | 0.68mi |
| 7901 Southgate Blvd Apt C5 North Lauderdale, FL | 2.0 | 2.0 | 1010 | $2,100 | $2.08 | 3d | 1 | 0.71mi |
| 1030 Country Club Dr #401 Margate, FL | 2.0 | 2.0 | 930 | $1,450 | $1.56 | 4d | 1 | 0.73mi |
| 1030 Country Club Dr #401 Margate, FL | 2.0 | 2.0 | 930 | $1,450 | $1.56 | 18d | 1 | 0.73mi |
| 1030 Country Club Dr #309 Margate, FL | 2.0 | 2.0 | 1038 | $1,450 | $1.40 | 24d | 1 | 0.73mi |
| 1025 Country Club Dr #302 Margate, FL | 2.0 | 2.0 | 920 | $1,475 | $1.60 | 24d | 1 | 0.73mi |
HOA detail condo
- Monthly dues
- $773 · $9,276/yr
- Likely covers
- pool
- Assessments
- None detected in remarks — confirm with the listing agent.
Listing history 12 events
-
2026-06-18days on market $119,000 Active 12 DOM
-
2026-06-17price $119,000 Active 11 DOM
-
2026-06-17days on market $125,000 Active 11 DOM
-
2026-06-16days on market $125,000 Active 10 DOM
-
2026-06-15days on market $125,000 Active 9 DOM
-
2026-06-13days on market $125,000 Active 7 DOM
-
2026-06-09days on market $125,000 Active 3 DOM
-
2026-06-08days on market $125,000 Active 2 DOM
-
2026-06-07remarks 449-char remark
-
2026-06-07status $125,000 Active 1 DOM
-
2026-06-02remarks 433-char remark
-
2026-06-02$125,000 Pending 1 DOM
ⓘ Source: listings_history table (triggers on properties + properties_extension) + one-shot
backfill from property_details.listing_events for pre-trigger history.
Tax reassessment forecast FL · Resets to sale price
- Current annual tax
- $2,274 · $190/mo
- Projected year-2 tax
- $2,274 · $190/mo
- Expected delta
- $0/yr ($0/mo · 0.0%)
ⓘ Screening estimate from a state-policy table — verify with the county assessor before closing.
Climate risk First Street
- Flood 1/10 Low FEMA zone X (shaded) · 0% chance over 30 yrs
- Wildfire 1/10 Low
- Heat 9/10 Extreme 7 d/yr ≥106°F today · 28 d/yr by 30 yrs out
- Wind 10/10 Extreme 99% chance of damaging wind over 30 yrs
- Air quality 3/10 Moderate 3 unhealthy d/yr today · 3 by 30 yrs out
Nearby sold comps map
Loading sold comps map…
Walkable amenities ~0.75 mi
Loading nearby amenities…
Taxation est. · year 1
- Rental income
- $22,909
- − Mortgage interest
- −$6,666
- − Property taxes
- −$2,274
- − Insurance
- −$595
- − Repairs & maintenance
- −$1,833
- − Management
- −$1,833
- − HOA
- −$9,276
- − Depreciation
- −$3,462
- Taxable loss
- −$3,029
- Est. tax savings @ 24.0%
- +$727
- After-tax cash flow
- $-809/yr
For passive investors: Depreciation is non-cash, so a rental often shows a tax loss while cash-flowing — sheltering income. Rental losses are passive: they offset passive income freely, and up to $25,000/yr can offset ordinary (W-2) income if you actively participate and your MAGI is under $100k (phasing out to $0 by $150k); unused losses carry forward. On sale, claimed depreciation is recaptured at up to 25%, and gains may owe capital-gains tax (a 1031 exchange can defer both). Figures are a year-1 estimate at your 24.0% rate — not tax advice; consult a CPA.
Schools (NCES district)
- District
- Broward
- NCES district ID
- 1200180
- Math proficiency
- 42% ▼ -18.00%
- Reading proficiency
- 53% ▼ -5.00%
- Median HH income
- $52,139
- Composite
- 40.88/100
- National rank
- #3621
- State rank
- #46 of 73 in FL
Livability — Margate
- Score
- 81/100
- State rank
- #85
- US rank
- #1398
Category grades
Schools grade is shown separately in the Schools card above.
Census & demographics
- Census place
- Margate, FL
- County
- Broward County · 1,963,430 people
- City population
- 55,466
- Metro
- Miami-Fort Lauderdale-Pompano Beach, FL
- Population (ZIP)
- 55,466
- Household income
- $62,918
- Rent vs Own
- Severe rent burden
- 2290.0
Population outlook (Broward County) Hauer SSP2
- Today (2025)
- 2,207,033 people
- By 2030
- 2,360,704 · +7.0%
- By 2040
- 2,661,208 · +20.6%
- By 2050
- 2,946,698 · +33.5%
- By 2075
- 3,602,273 · +63.2%
- By 2100
- 3,970,984 · +79.9%
Race, ethnicity, and origin ACS 2023
- Neighborhood character
- Highly diverse neighborhood (Simpson 0.72)
- Race & ethnicity
- White 34% Hispanic / Latino 29% Black 28% Two or more races 18% Asian 4%
- Hispanic origin (detail)
- Mexican 2% Puerto Rican 7% Cuban 3% Dominican 3%
- Common ancestry
- Hispanic 6% Romanian 2% Estonian 2%
- Foreign-born
- 36% · Canada, Jamaica, Vietnam
- Languages at home
- 61% English-only · Spanish 24% French/Haitian/Cajun 7% Other Indo-European 4%
Political lean MEDSL · Broward
- 2024 margin
- D (+17.0) · D 58.0% · R 41.0%
- 2008→2024 swing
- -17.8pp toward R · 2008: 34.7pp · 2024: 17.0pp
- All cycles
- 2024: D+17.0 2020: D+29.8 2016: D+35.0 2012: D+34.9 2008: D+34.7
Not yet ingested
- Civics
- —
Market trends
- HPI YoY
- ▼ -87.17%
- Current HPI
- 393.9225
- Rent YoY
- ▲ 1.94%
- Metro
- Miami-Fort Lauderdale-Pompano Beach, FL
- State GDP YoY
- ▲ 3.28%
- F500 in state
- 36
Industry mix (Fortune 500 HQ in FL)
| Industry | F500 HQs | Revenue |
|---|---|---|
| Industrial Technology | 2 | $29B |
|
||
| Insurance | 2 | $17B |
|
||
| Retail | 1 | $60B |
|
||
| Technology Distribution | 1 | $58B |
|
||
| Homebuilding | 1 | $35B |
|
||
| Technology Manufacturing | 1 | $35B |
|
||
Price history
+101.6% since first listed7 events — show timeline
- 2026-06-01 Pending — MARMLS
- 2026-06-01 Listed $125,000 MARMLS
- 2018-07-16 Sold (Public Records) $110,000 Public Records
- 2018-07-06 Sold (MLS) $110,000 Beaches MLS
- 2018-05-22 Contingent — Beaches MLS
- 2018-03-13 Listed $110,000 Beaches MLS
- 1980-04-01 Sold (Public Records) $62,000 Public Records
Property tax history
+13.7%/yrLatest (2025): $2,274 · +3.0% YoY. Source: county tax records.
Cash-flow waterfall
monthlySold comps — $/sqft
last 12 mo · ≤1 miLoading sold comps…