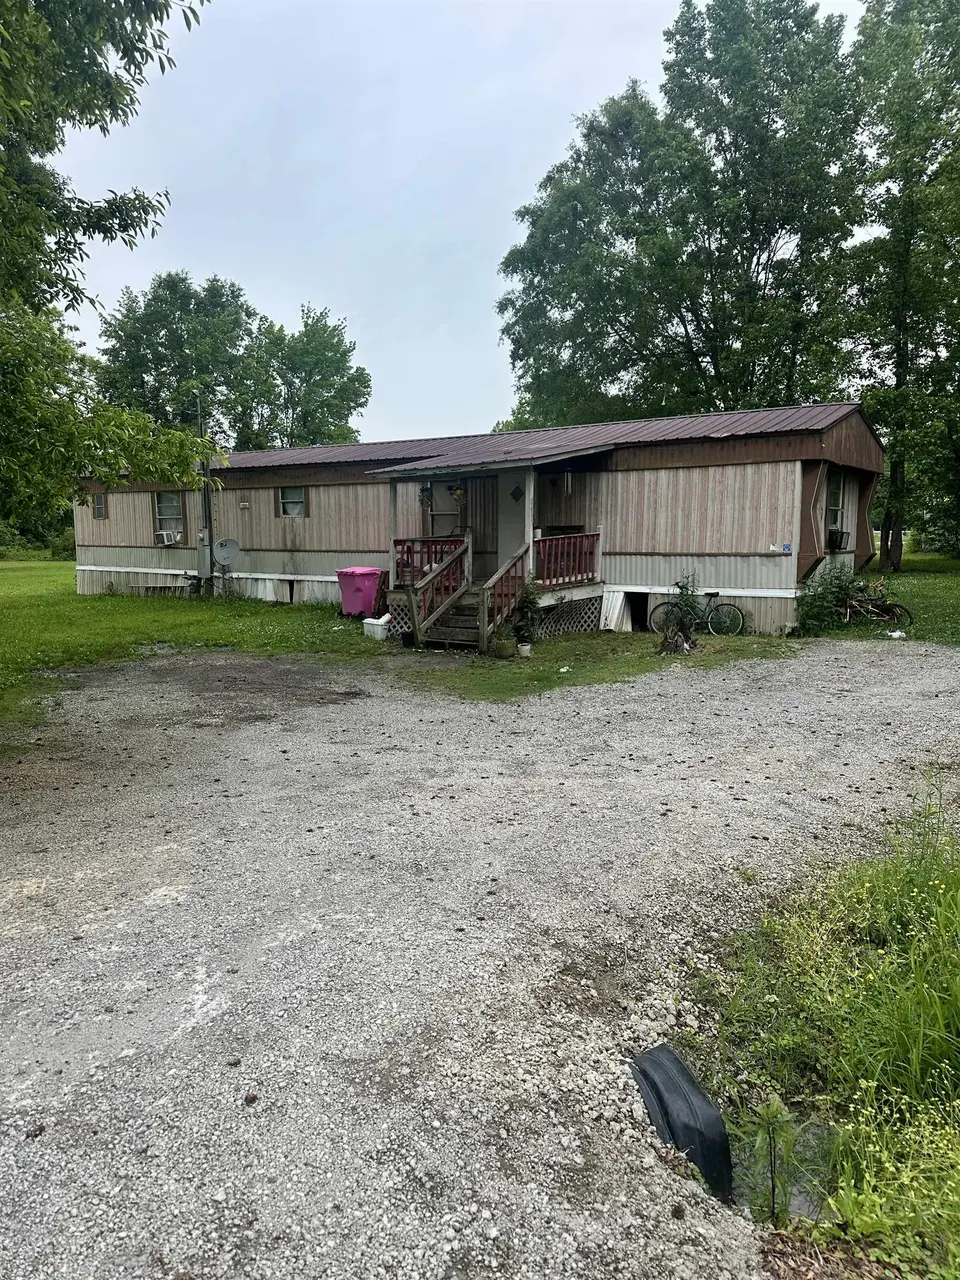
392 Jackson Hwy · Littleville, AL
Flood risk 1/10 · Minimal
- FEMA flood zone
- X (unshaded)
- Chance of flooding over 30 yrs
- 0.0%
- Est. flood insurance / yr
- $507 – $1,088
Fire risk 5/10 · Moderate
- Est. fire insurance / yr
- $916 – $1,700
Heat risk 6/10 · Moderate
- Hot days now (above 106°F)
- 7 days/yr
- Hot days in 30 yrs
- 21 days/yr
Wind risk 5/10 · Moderate
- Chance of severe wind over 30 yrs
- 25.0%
Air-quality risk 2/10 · Minimal
- Unhealthy air days now
- 1 days/yr
- Unhealthy air days in 30 yrs
- 1 days/yr
Risk factors via First Street. Map © Google.
Why this score? — see what drove the B- grade
The composite is a weighted blend of 9 inputs, each scored 0–100. Each bar is that input's sub-score; the figure is the points it added to the 100-point composite (weight × sub-score).
- Cash flow +30.0/30.0
- 1% rule +10.0/10.0
- DSCR +10.0/10.0
- ARV discount +7.5/15.0
- Livability +3.2/5.0
- Rent growth +2.5/5.0
- Condition / age +2.5/5.0
- Schools +2.1/10.0
- Appreciation +0.0/10.0
$65,000
🖨 Deal sheet (PDF) 📄 Offer letter ✓ Due diligence
Listing remarks
Investor opportunity in Littleville! Situated on approximately 0.45-/+ acres, this property offers solid potential for those looking to add to their rental portfolio or take on a value-add project. With the right updates and vision, this home could be transformed into a cash-flowing rental or resale opportunity. Conveniently located with easy access to local amenities, this property sits on a spacious lot, providing room for improvements, outdoor space, or future enhancements. Whether you're an experienced investor or just getting started, this is a chance to secure a property with upside potential in a growing area. Sold as-is. Bring your vision and make this investment work for you!
Key facts
- Spacious lot
- Growing area
- 0.45 acre lot
Tags
Property features AI
Finance
- Other: Lot dimensions approximately 126.2 x 147.5 feet (about 0.45 acres)
Exterior
- Utilities: Public water; Septic tank; Cable available; Phone available; Water connected
- Home design: Residential mobile home; Single-story (above-grade finished living area listed separately)
- Construction: 1,280 above-grade finished area
- Exterior features: Front porch; Level lot; Gravel road frontage on a highway
Interior
- Bathrooms: Two full bathrooms
- Interior features: Five total rooms; In fixer condition
Neighborhood map
What this means for you Summary
Snapshot
- This is a 3-bed/2.0-bath manufactured listed at $65k.
Deal economics
- At list price, monthly cash flow is $449 ($5k/yr) — positive.
- The deal already cash-flows at list — no discount required.
- Meets the 1% rule at list price ($1k rent vs $65k).
- Recommended offer: $63k (3.0% below list) — sets the bar for market timing.
- Cap rate 14.6% vs local median 4.7% in Littleville — top-decile yield for the area; either an underpriced asset or a hidden risk that comps aren't pricing in. Stress-test before assuming the spread holds.
Location & tenants
- Location reads 65/100 on livability (#122 in AL) — a middle-class / working-renter tenant base. Strengths: crime A+, cost of living A+, housing A+; Watch: employment C-, amenities F, commute F.
- Colbert County (rural): math 13% / reading 38% proficiency, ranked #90 of 129 in AL (top 70%) — low school quality limits family demand, transient renter base, plan for 1-2y turnover.
- Zoned schools: Colbert County High School (math 5% / reading 32%, grade F, #184 of 305 statewide, top 61%, 455 students, 43% FRL) — zoned schools average 43% FRL vs 59% district-wide (16 pts lower); this property's tenant base skews higher-income than the district average.
- Market conditions: 224 active listings in the ZIP; 91 units permitted in Colbert County in 2024 (0 in 5+ unit buildings).
Forward outlook
- Local home prices are declining (-3.0%/yr); year-one equity from $449 of loan paydown is wiped out by about $2k of value loss. Plan a longer hold.
- Colbert County population projected to shrink 7% by 2050 — rents likely to lag national; underwrite the cash flow, not the appreciation.
- At projected returns (-3.0% appreciation + 3.0% rent growth), your $18k cash investment doubles in ~5 years — after that, you're playing with house money.
Negotiation context
- It's been on market 50 days — a 3% lower offer ($63k) is reasonable based on typical stale-listing flexibility.
- Current owner paid $20k; list at $65k implies a 217% gain — meaningful room to come down on a strong offer.
Risks & watch-outs
- Climate carrying-cost: moderate wind risk, 25% chance of damaging wind over 30y; moderate wildfire risk; extreme-heat days projected 7→21/yr by 2055 (HVAC capex compounding) — expect insurance premiums to compound above CPI over the hold.
Questions for the listing agent
- It's been on market 50 days. Have you received any prior offers? Is the seller open to a 3% concession, seller financing, or rate buy-down credit?
- Built in 1978 — when were the roof, HVAC, electrical panel, plumbing, and water heater last replaced?
- Is there a deadline driving the sale (1031 exchange, divorce, estate, relocation)? That informs how much negotiation room exists.
- Schools are F-rated, which usually means shorter tenancies and higher turnover. Who's the typical renter profile here, and what's been the actual vacancy rate?
- What's the average days-on-market for RENTAL listings here right now (not sales)? A rising rental-DOM trend means longer vacancies and softer asking-rent achievability than the comps imply.
- What's the recent tenant-quality profile in this submarket — average credit score on applications, eviction rate, late-payment / NSF rate, and stable-employment percentage? A property-management company in the area should have these aggregated.
- How much new for-sale + rental construction is in the pipeline within 1–3 miles? Heavy new supply typically softens prices + rents 12–24 months out; constrained supply supports both.
Investment metrics
- 1% rule
- 1.63% ✓
- Cap rate
- 14.57%
- Cash-on-cash
- 29.57%
- DSCR
- 2.32
- GRM
- 5.1
CMA / ARV
No comps found within radius.
Projected returns pro-forma
-3.0% appreciation · 3.0% rent growth · sell at horizon
- IRR
- 24.0%
- Equity multiple
- 1.99×
- Total profit
- $18,015
- Equity at exit
- $9,692
- IRR
- 31.9%
- Equity multiple
- 3.88×
- Total profit
- $52,390
- Equity at exit
- $5,620
Cash invested: $18,200 (down + closing). Projections, not guarantees.
Landlord ↔ Tenant lean methodology
- Overall (STATE)
- 90 Strongly Landlord-Friendly
- State Alabama
- 90 Strongly Landlord-Friendly · R+15
- County
- — inherits STATE
- City
- — inherits STATE
ZIP-level market 35674
- Home prices YoY
- -28.4%
- Active inventory
- 224
- Price-to-rent
- 5.1×
Monthly cashflow live
- Estimated rent
- $1,062 medium interval (Pro) →
- Mortgage (P&I)
- −$341
- Tax from tax record
- −$22 /mo · $266/yr
- Insurance
- −$27
- HOA
- −$0
- Vacancy / Maint / Mgmt
- −$223
- Net cashflow
- $449
Break-even live
Sensitivity live
| Price | -10% $485 | -5% $467 | +0% $449 | +5% $430 | +10% $412 |
|---|---|---|---|---|---|
| Rent | -10% $365 | -5% $407 | +0% $449 | +5% $490 | +10% $532 |
| Rate | -1.0pp $481 | -0.5pp $465 | base $449 | +0.5pp $432 | +1.0pp $415 |
UW: 25.0% down · 7.5% · 30yr · 1.5% tax · 5.0% vac · 8.0% maint · 8.0% mgmt
Financing live
Cash to close
- Down payment
- $16,250
- Closing costs
- $1,950
- Reserves months
- —
- Total cash needed
- —
Loan-product check · same deal, 3 products live
Conventional
25% down · 7.5% · 30yr
- Down + closing
- —
- Monthly P&I
- —
- Monthly cashflow
- —
- DSCR
- —
- Eligible?
- —
Personal DTI + credit; lowest rate.
DSCR
20% down · 8.5% · 30yr
- Down + closing
- —
- Monthly P&I
- —
- Monthly cashflow
- —
- DSCR
- —
- Eligible?
- —
No personal income docs; deal must DSCR.
Hard money
10% down · 12.0% · 12mo
- Down + closing
- —
- Monthly P&I
- —
- Monthly cashflow
- —
- DSCR
- —
- Eligible?
- —
Short-term bridge; refi at stabilization.
Listing history 20 events
-
2026-06-21days on market $65,000 Active 50 DOM
-
2026-06-19days on market $65,000 Active 48 DOM
-
2026-06-18days on market $65,000 Active 47 DOM
-
2026-06-17days on market $65,000 Active 46 DOM
-
2026-06-16days on market $65,000 Active 45 DOM
-
2026-06-15days on market $65,000 Active 44 DOM
-
2026-06-14days on market $65,000 Active 42 DOM
-
2026-06-13days on market $65,000 Active 41 DOM
-
2026-06-10days on market $65,000 Active 39 DOM
-
2026-06-09days on market $65,000 Active 38 DOM
-
2026-06-08days on market $65,000 Active 37 DOM
-
2026-06-07days on market $65,000 Active 36 DOM
-
2026-06-05days on market $65,000 Active 33 DOM
-
2026-06-03days on market $65,000 Active 32 DOM
-
2026-06-02days on market $65,000 Active 31 DOM
-
2026-06-01days on market $65,000 Active 30 DOM
-
2026-05-31days on market $65,000 Active 29 DOM
-
2026-05-30days on market $65,000 Active 28 DOM
-
2026-05-01$65,000 Active 693-char remark
-
2013-08-06soldstatus $20,500
ⓘ Source: listings_history table (triggers on properties + properties_extension) + one-shot
backfill from property_details.listing_events for pre-trigger history.
Tax reassessment forecast AL · Resets to sale price
- Current annual tax
- $266 · $22/mo
- Projected year-2 tax
- $266 · $22/mo
- Expected delta
- +$1/yr ($0/mo · 0.3%)
ⓘ Screening estimate from a state-policy table — verify with the county assessor before closing.
Climate risk First Street
- Flood 1/10 Low FEMA zone X (unshaded) · 0% chance over 30 yrs
- Wildfire 5/10 Major
- Heat 6/10 Major 7 d/yr ≥106°F today · 21 d/yr by 30 yrs out
- Wind 5/10 Major 25% chance of damaging wind over 30 yrs
- Air quality 2/10 Low 1 unhealthy d/yr today · 1 by 30 yrs out
Nearby sold comps map
Loading sold comps map…
Walkable amenities ~0.75 mi
Loading nearby amenities…
Taxation est. · year 1
- Rental income
- $12,739
- − Mortgage interest
- −$3,641
- − Property taxes
- −$266
- − Insurance
- −$325
- − Repairs & maintenance
- −$1,019
- − Management
- −$1,019
- − Depreciation
- −$1,891
- Taxable income
- $4,578
- Est. tax owed @ 24.0%
- −$1,099
- After-tax cash flow
- $4,284/yr
For passive investors: Depreciation is non-cash, so a rental often shows a tax loss while cash-flowing — sheltering income. Rental losses are passive: they offset passive income freely, and up to $25,000/yr can offset ordinary (W-2) income if you actively participate and your MAGI is under $100k (phasing out to $0 by $150k); unused losses carry forward. On sale, claimed depreciation is recaptured at up to 25%, and gains may owe capital-gains tax (a 1031 exchange can defer both). Figures are a year-1 estimate at your 24.0% rate — not tax advice; consult a CPA.
Schools (NCES district)
- District
- Colbert County
- NCES district ID
- 0100840
- Math proficiency
- 13% ▼ -24.00%
- Reading proficiency
- 38% ▬ 0.00%
- Median HH income
- $40,710
- Composite
- 21.48/100
- National rank
- #8328
- State rank
- #90 of 129 in AL
Livability — Littleville
- Score
- 65/100
- State rank
- #122
- US rank
- #12858
Category grades
Schools grade is shown separately in the Schools card above.
Census & demographics
- Census place
- Littleville, AL
- County
- Colbert County · 20,176 people
- Metro
- Florence-Muscle Shoals, AL
- Population (ZIP)
- 20,176
- Household income
- $64,706
- Rent vs Own
- Severe rent burden
- 372.0
Population outlook (Colbert County) Hauer SSP2
- Today (2025)
- 54,154 people
- By 2030
- 53,746 · -0.8%
- By 2040
- 52,431 · -3.2%
- By 2050
- 50,303 · -7.1%
- By 2075
- 44,789 · -17.3%
- By 2100
- 36,676 · -32.3%
Race, ethnicity, and origin ACS 2023
- Neighborhood character
- Predominantly White (82%)
- Race & ethnicity
- White 82% Black 11% Hispanic / Latino 4% Two or more races 4%
- Common ancestry
- Slovak 2% Italian 1% Lithuanian 1%
- Foreign-born
- 2% · Canada
- Languages at home
- 98% English-only · Spanish 2%
Political lean MEDSL · Colbert
- 2024 margin
- Solid R (+46.4) · D 26.4% · R 72.8%
- 2008→2024 swing
- -26.2pp toward R · 2008: -20.3pp · 2024: -46.4pp
- All cycles
- 2024: R+46.4 2020: R+38.9 2016: R+38.3 2012: R+20.4 2008: R+20.3
Not yet ingested
- Civics
- —
Market trends
- HPI YoY
- ▼ -68.06%
- Current HPI
- 171.9693
- Rent YoY
- —
- Metro
- Florence-Muscle Shoals, AL
- State GDP YoY
- ▲ 2.94%
- F500 in state
- 4
Industry mix (Fortune 500 HQ in AL)
| Industry | F500 HQs | Revenue |
|---|---|---|
| Financial Services | 1 | $8B |
|
||
| Healthcare | 1 | $5B |
|
||
Price history
+217.1% since first listed2 events — show timeline
- 2026-05-01 Listed $65,000 SAARMLS
- 2013-08-06 Sold (Public Records) $20,500 Public Records
Property tax history
+5.2%/yrLatest (2025): $266 · +5.6% YoY. Source: county tax records.
Cash-flow waterfall
monthlySold comps — $/sqft
last 12 mo · ≤1 miLoading sold comps…