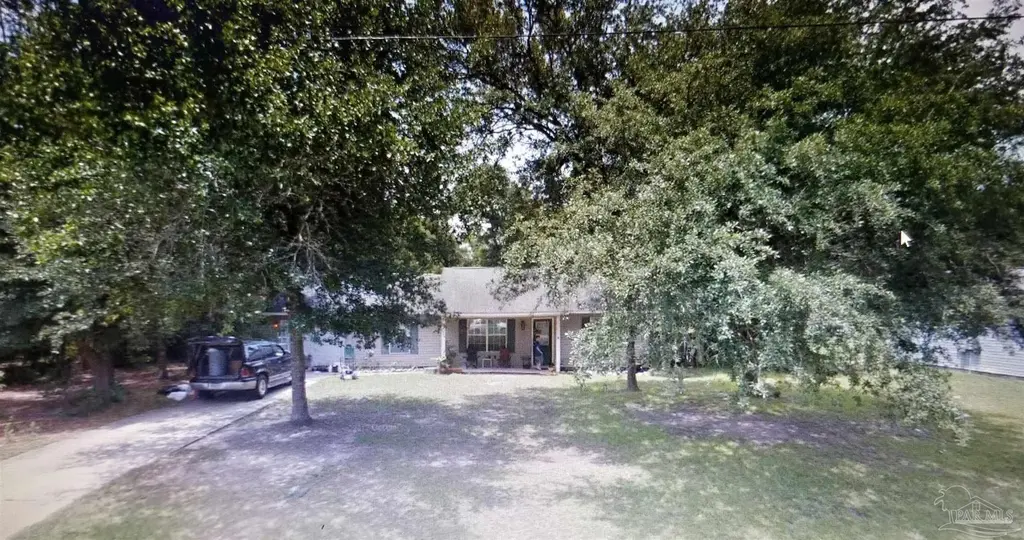
6280 Mohawk Trl · Bagdad, FL
Flood risk 6/10 · Moderate
- FEMA flood zone
- X (unshaded)
- Chance of flooding over 30 yrs
- 0.72%
- Est. flood insurance / yr
- $507 – $1,088
Fire risk 5/10 · Moderate
- Est. fire insurance / yr
- $947 – $1,759
Heat risk 10/10 · Severe
- Hot days now (above 105°F)
- 7 days/yr
- Hot days in 30 yrs
- 21 days/yr
Wind risk 9/10 · Severe
- Chance of severe wind over 30 yrs
- 99.0%
Air-quality risk 1/10 · Minimal
- Unhealthy air days now
- 0 days/yr
- Unhealthy air days in 30 yrs
- 0 days/yr
Risk factors via First Street. Map © Google.
Why this score? — see what drove the C grade
The composite is a weighted blend of 9 inputs, each scored 0–100. Each bar is that input's sub-score; the figure is the points it added to the 100-point composite (weight × sub-score).
- Cash flow +18.7/30.0
- ARV discount +14.9/15.0
- DSCR +5.9/10.0
- Schools +5.3/10.0
- 1% rule +4.1/10.0
- Rent growth +3.6/5.0
- Livability +3.4/5.0
- Condition / age +2.5/5.0
- Appreciation +0.0/10.0
$209,900
🖨 Deal sheet 📄 Offer letter ✓ Due diligence
Listing remarks MLS
Step into 6280 Mohawk Trail and enjoy country living in this beautifully updated newer home. Nestled close to shopping and schools. Breathtaking views of the over half acre property appear endless. This 3 bedroom, 2 bath home built in 1998 is move in ready and features a finished 300sqft studio. The open living spaces which also access the porches are designed entertaining friends and family while the split bedroom floor plan allows for your privacy from guests. The nicely appointed kitchen features beautiful cabinetry, backsplash, countertops, sink and stainless appliances. Flooring in the home has been replaced with wood plank laminate in the main areas and bedrooms. Fenced backyard with room for the kids to play. Large oak trees provide plenty of shade.
Key facts
- Eat in kitchen
- Converted garage
- Solar panels
Tags
Property features AI
Finance
- HOA & community: No homeowners association
Exterior
- Parking: Driveway with two total parking spaces; Converted garage; Has open parking
- Security: Smoke detector(s)
- Utilities: Public water; Septic tank; Circuit breakers with copper wiring; Cable available; Paved roads (county maintained)
- Home design: One-story brick home; Resale property; Not attached to another property; Solar energy generation
- Construction: Brick construction; Shingle roof; Slab foundation; One level
- Exterior features: Porch; Rain gutters; Interior lot
Interior
- Kitchen: Laminate counters; Dishwasher; Refrigerator; Kitchen and dining combo
- Bedrooms: Primary bedroom on the first floor (approx. 12' x 14'); Second bedroom on the first floor (approx. 10.6' x 11.1')
- Flooring: Laminate flooring
- Bathrooms: Two full bathrooms
- Heating & cooling: Central heating; Central air; Ceiling fan(s); Heat pump (energy efficient)
- Interior features: Baseboards; Ceiling fan(s); Double-pane windows
- Laundry & utility: Washer/dryer hookups inside; Electric water heater
Neighborhood map
What this means for you Summary
Snapshot
- This is a 3-bed/2.0-bath single-family listed at $210k.
Deal economics
- At list price, monthly cash flow is $208 ($2k/yr) — positive.
- The deal already cash-flows at list — no discount required.
- To meet the 1% rule (rent ≥ 1% of price), the offer needs to be $191k (8.8% below list).
- Recommended offer: $191k (8.8% below list) — sets the bar for 1% rule.
- Cap rate 7.5% vs local median 5.0% in Bagdad — top-decile yield for the area; either an underpriced asset or a hidden risk that comps aren't pricing in. Stress-test before assuming the spread holds.
Location & tenants
- Location reads 67/100 on livability (#571 in FL) — a middle-class / working-renter tenant base. Strengths: crime A+, cost of living A+, housing A+; Watch: schools F, amenities F, commute F.
- Santa Rosa (suburban): math 63% / reading 60% proficiency, ranked #8 of 73 in FL (top 11%) — acceptable for families but not a draw, mixed tenant base, ~2y average lease.
- Market conditions: Rents rising fast (+4.5%/yr); 806 active listings in the ZIP; 4 comparable units currently listed for rent nearby; rentals at typical pace (median 24d on market — plan ~3-4 weeks tenant-placement turnaround); solid renter incomes; 1,983 units permitted in Santa Rosa County in 2024 (128 in 5+ unit buildings).
Forward outlook
- Local home prices are declining (-3.0%/yr); year-one equity from $1k of loan paydown is wiped out by about $6k of value loss. Plan a longer hold.
- Santa Rosa County population projected at +31% by 2050 — long-run rental-demand tailwind backs the buy-and-hold thesis.
Negotiation context
- It's been on market 20 days — a 2% lower offer ($207k) is reasonable based on typical stale-listing flexibility.
- 4 sale attempts since 21y ago with the ask held roughly flat each time — persistent listings suggest the price (not the market) is what's stuck; bring a comps-based counter.
- Current owner paid $168k; 25% above their basis — modest negotiation headroom, anchor on the comps not their cost.
Risks & watch-outs
- Climate carrying-cost: major flood risk; severe wind risk, 99% chance of damaging wind over 30y; moderate wildfire risk; extreme-heat days projected 7→21/yr by 2055 (HVAC capex compounding) — expect insurance premiums to compound above CPI over the hold.
Questions for the listing agent
- Is there a deadline driving the sale (1031 exchange, divorce, estate, relocation)? That informs how much negotiation room exists.
- Schools are F-rated, which usually means shorter tenancies and higher turnover. Who's the typical renter profile here, and what's been the actual vacancy rate?
- What's the average days-on-market for RENTAL listings here right now (not sales)? A rising rental-DOM trend means longer vacancies and softer asking-rent achievability than the comps imply.
- What's the recent tenant-quality profile in this submarket — average credit score on applications, eviction rate, late-payment / NSF rate, and stable-employment percentage? A property-management company in the area should have these aggregated.
- How much new for-sale + rental construction is in the pipeline within 1–3 miles? Heavy new supply typically softens prices + rents 12–24 months out; constrained supply supports both.
Investment metrics
- 1% rule
- 0.91% ✗
- Cap rate
- 7.48%
- Cash-on-cash
- 4.25%
- DSCR
- 1.19
- GRM
- 9.1
CMA / ARV
- ARV (on-the-fly)
- $251,505
- Comps found
- 12
Show comp detail 12 sales within ~0.75 mi
| Address | Dist | Beds/Ba | Sqft | Sold | Price | $/sf | Match |
|---|---|---|---|---|---|---|---|
| 6333 Rice St | 0.07mi | 3/2.0 | 1,215 (0%) | 4mo | $250,000 | $206 | 94 |
| 6361 Firefly Dr | 0.44mi | 3/2.0 | 1,205 (-1%) | 10mo | $249,900 | $207 | 70 |
| 6349 Firefly Dr | 0.47mi | 3/2.0 | 1,205 (-1%) | 9mo | $250,000 | $207 | 69 |
| 6353 Firefly Dr | 0.46mi | 3/2.0 | 1,205 (-1%) | 10mo | $249,900 | $207 | 69 |
| 6333 Firefly Dr | 0.50mi | 3/2.0 | 1,205 (-1%) | 9mo | $254,900 | $212 | 68 |
| 6257 Mohawk Trl | 0.07mi | 3/1.5 | 1,356 (+12%) | 11mo | $214,999 | $159 | 67 |
| 6325 Firefly Dr | 0.52mi | 3/2.0 | 1,205 (-1%) | 11mo | $251,900 | $209 | 65 |
| 4281 Tomahawk Trl | 0.23mi | 3/2.0 | 1,356 (+12%) | 8mo | $215,000 | $159 | 63 |
| 6309 Firefly Dr | 0.55mi | 3/2.0 | 1,205 (-1%) | 12mo | $252,400 | $209 | 63 |
| 6301 Firefly Dr | 0.57mi | 3/2.0 | 1,205 (-1%) | 12mo | $249,900 | $207 | 62 |
| 6309 Matador St | 0.59mi | 3/2.0 | 1,140 (-6%) | 8mo | $205,000 | $180 | 56 |
| 4380 Glen Forest Dr | 0.35mi | 3/2.0 | 1,366 (+12%) | 10mo | $256,500 | $188 | 55 |
Match score weights: distance 35% · size 25% · config 20% · recency 20%. Top-matched comps best support the ARV.
Projected returns pro-forma
-3.0% appreciation · 4.53% rent growth · sell at horizon
- IRR
- -8.1%
- Equity multiple
- 0.70×
- Total profit
- $-17,828
- Equity at exit
- $31,297
- IRR
- 3.1%
- Equity multiple
- 1.24×
- Total profit
- $13,959
- Equity at exit
- $18,148
Cash invested: $58,772 (down + closing). Projections, not guarantees.
Landlord ↔ Tenant lean methodology
- Overall (STATE)
- 87 Strongly Landlord-Friendly
- State Florida
- 87 Strongly Landlord-Friendly · R+3
- County
- — inherits STATE
- City
- — inherits STATE
ZIP-level market 32583
- Home prices YoY
- -11.3%
- Rents YoY
- 4.5%
- Active inventory
- 806
- Price-to-rent
- 9.1×
Monthly cashflow live
- Estimated rent
- $1,914 medium interval (Pro) →
- Mortgage (P&I)
- −$1,101
- Tax from tax record
- −$116 /mo · $1,390/yr
- Insurance
- −$87
- HOA
- −$0
- Vacancy / Maint / Mgmt
- −$402
- Net cashflow
- $208
Break-even live
UW: 25.0% down · 7.5% · 30yr · 1.5% tax · 5.0% vac · 8.0% maint · 8.0% mgmt
Financing live
Cash to close
- Down payment
- $52,475
- Closing costs
- $6,297
- Reserves months
- —
- Total cash needed
- —
Loan-product check · same deal, 3 products live
Conventional
25% down · 7.5% · 30yr
- Down + closing
- —
- Monthly P&I
- —
- Monthly cashflow
- —
- DSCR
- —
- Eligible?
- —
Personal DTI + credit; lowest rate.
DSCR
20% down · 8.5% · 30yr
- Down + closing
- —
- Monthly P&I
- —
- Monthly cashflow
- —
- DSCR
- —
- Eligible?
- —
No personal income docs; deal must DSCR.
Hard money
10% down · 12.0% · 12mo
- Down + closing
- —
- Monthly P&I
- —
- Monthly cashflow
- —
- DSCR
- —
- Eligible?
- —
Short-term bridge; refi at stabilization.
Rent comps 4 comps
| Address | Beds | Baths | Sqft | Rent | $/sqft | DOM | Units | Dist |
|---|---|---|---|---|---|---|---|---|
| 6317 Firefly Dr Milton, FL | 4.0 | 2.0 | 1439 | $2,000 | $1.39 | 21d | 1 | 0.53mi |
| 6478 Da Lisa Rd Milton, FL | 3.0 | 2.0 | 1120 | $1,900 | $1.70 | 23d | 1 | 0.68mi |
| 4355 Park Ct Trlr Park , FL | 2.0 | 1.5 | 1000 | $1,200 | $1.20 | 23d | 1 | 1.08mi |
| 4389 Park Ct Trlr Park , FL | 2.0 | 1.0 | 700 | $1,100 | $1.57 | 23d | 1 | 1.10mi |
Listing history 16 events
-
2026-06-18days on market $209,900 Active 20 DOM
-
2026-06-17days on market $209,900 Active 19 DOM
-
2026-06-16days on market $209,900 Active 18 DOM
-
2026-06-15days on market $209,900 Active 17 DOM
-
2026-06-14days on market $209,900 Active 15 DOM
-
2026-06-10days on market $209,900 Active 12 DOM
-
2026-06-09days on market $209,900 Active 11 DOM
-
2026-06-08days on market $209,900 Active 10 DOM
-
2026-06-07days on market $209,900 Active 9 DOM
-
2026-06-05days on market $209,900 Active 6 DOM
-
2026-06-03days on market $209,900 Active 5 DOM
-
2026-06-02days on market $209,900 Active 4 DOM
-
2026-06-01days on market $209,900 Active 3 DOM
-
2026-05-31days on market $209,900 Active 2 DOM
-
2026-05-31remarks 399-char remark
-
2026-05-31$209,900 Active 1 DOM
ⓘ Source: listings_history table (triggers on properties + properties_extension) + one-shot
backfill from property_details.listing_events for pre-trigger history.
Tax reassessment forecast FL · Resets to sale price
- Current annual tax
- $1,390 · $116/mo
- Projected year-2 tax
- $1,742 · $145/mo
- Expected delta
- +$352/yr (+$29/mo · 25.3%)
ⓘ Screening estimate from a state-policy table — verify with the county assessor before closing.
Climate risk First Street
- Flood 6/10 Major FEMA zone X (unshaded) · 72% chance over 30 yrs
- Wildfire 5/10 Major
- Heat 10/10 Extreme 7 d/yr ≥105°F today · 21 d/yr by 30 yrs out
- Wind 9/10 Extreme 99% chance of damaging wind over 30 yrs
- Air quality 1/10 Low 0 unhealthy d/yr today · 0 by 30 yrs out
Nearby sold comps map
Loading sold comps map…
Walkable amenities ~0.75 mi
Loading nearby amenities…
Taxation est. · year 1
- Rental income
- $22,970
- − Mortgage interest
- −$11,758
- − Property taxes
- −$1,390
- − Insurance
- −$1,050
- − Repairs & maintenance
- −$1,838
- − Management
- −$1,838
- − Depreciation
- −$6,106
- Taxable loss
- −$1,009
- Est. tax savings @ 24.0%
- +$242
- After-tax cash flow
- $2,739/yr
For passive investors: Depreciation is non-cash, so a rental often shows a tax loss while cash-flowing — sheltering income. Rental losses are passive: they offset passive income freely, and up to $25,000/yr can offset ordinary (W-2) income if you actively participate and your MAGI is under $100k (phasing out to $0 by $150k); unused losses carry forward. On sale, claimed depreciation is recaptured at up to 25%, and gains may owe capital-gains tax (a 1031 exchange can defer both). Figures are a year-1 estimate at your 24.0% rate — not tax advice; consult a CPA.
Schools (NCES district)
- District
- Santa Rosa
- NCES district ID
- 1201650
- Math proficiency
- 63% ▼ -6.00%
- Reading proficiency
- 60% ▼ -5.00%
- Median HH income
- $58,161
- Composite
- 53.12/100
- National rank
- #1511
- State rank
- #8 of 73 in FL
Livability — Bagdad
- Score
- 67/100
- State rank
- #571
- US rank
- #10887
Category grades
Schools grade is shown separately in the Schools card above.
Census & demographics
- Census place
- Bagdad, FL
- County
- Santa Rosa County · 194,764 people
- Metro
- Pensacola-Ferry Pass-Brent, FL
- Population (ZIP)
- 31,828
- Household income
- $85,440
- Rent vs Own
- Severe rent burden
- 122.0
Population outlook (Santa Rosa County) Hauer SSP2
- Today (2025)
- 195,978 people
- By 2030
- 209,782 · +7.0%
- By 2040
- 235,293 · +20.1%
- By 2050
- 256,408 · +30.8%
- By 2075
- 298,074 · +52.1%
- By 2100
- 303,216 · +54.7%
Race, ethnicity, and origin ACS 2023
- Neighborhood character
- Predominantly White (74%)
- Race & ethnicity
- White 74% Black 11% Two or more races 10% Hispanic / Latino 6% Asian 1%
- Hispanic origin (detail)
- Mexican 3% Puerto Rican 2% Cuban 1%
- Common ancestry
- Italian 3% Slovak 2% Serbian 2%
- Foreign-born
- 3% · Canada
- Languages at home
- 94% English-only · Spanish 3%
Political lean MEDSL · Santa Rosa
- 2024 margin
- Solid R (+51.0) · D 24.1% · R 75.0%
- 2008→2024 swing
- -3.0pp toward R · 2008: -47.9pp · 2024: -51.0pp
- All cycles
- 2024: R+51.0 2020: R+46.5 2016: R+53.5 2012: R+52.6 2008: R+47.9
Not yet ingested
- Civics
- —
Market trends
- HPI YoY
- ▼ -38.35%
- Current HPI
- 301.8819
- Rent YoY
- ▲ 4.53%
- Metro
- Pensacola-Ferry Pass-Brent, FL
- State GDP YoY
- ▲ 3.28%
- F500 in state
- 36
Industry mix (Fortune 500 HQ in FL)
| Industry | F500 HQs | Revenue |
|---|---|---|
| Industrial Technology | 2 | $29B |
|
||
| Insurance | 2 | $17B |
|
||
| Retail | 1 | $60B |
|
||
| Technology Distribution | 1 | $58B |
|
||
| Homebuilding | 1 | $35B |
|
||
| Technology Manufacturing | 1 | $35B |
|
||
Price history
+195.6% since first listed10 events — show timeline
- 2026-05-29 Listed $209,900 PARMLS
- 2021-07-08 Pending — PARMLS
- 2021-07-07 Sold (Public Records) $168,000 Public Records
- 2021-07-06 Sold (MLS) $168,000 PARMLS
- 2021-05-11 Listed — PARMLS
- 2021-05-11 Listed $175,000 PARMLS
- 2005-04-21 Sold (Public Records) $105,500 Public Records
- 2005-04-15 Sold (MLS) $105,500 PARMLS
- 2005-03-16 Listed $99,900 PARMLS
- 1998-07-02 Sold (Public Records) $71,000 Public Records
Property tax history
+7.9%/yrLatest (2025): $1,390 · +5.7% YoY. Source: county tax records.
Cash-flow waterfall
monthlySold comps — $/sqft
last 12 mo · ≤1 miLoading sold comps…