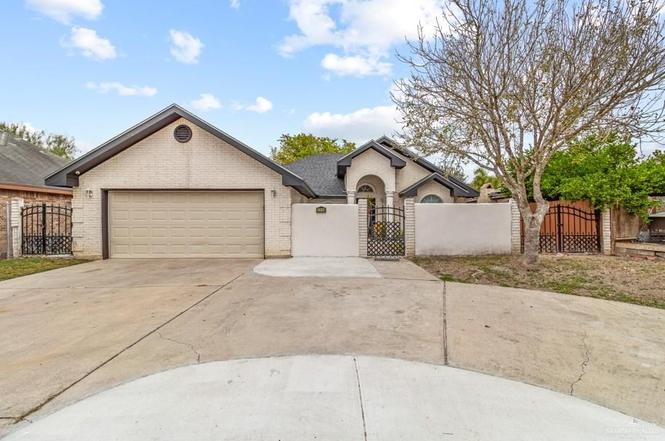
1210 E Boganbilia Ave · Hidalgo, TX
Flood risk 3/10 · Minor
- FEMA flood zone
- X (shaded)
- Chance of flooding over 30 yrs
- 0.2%
- Est. flood insurance / yr
- $507 – $1,088
Fire risk 5/10 · Moderate
- Est. fire insurance / yr
- $1,222 – $2,270
Heat risk 9/10 · Severe
- Hot days now (above 111°F)
- 7 days/yr
- Hot days in 30 yrs
- 23 days/yr
Wind risk 8/10 · Major
- Chance of severe wind over 30 yrs
- 96.0%
Air-quality risk 1/10 · Minimal
- Unhealthy air days now
- 0 days/yr
- Unhealthy air days in 30 yrs
- 0 days/yr
Risk factors via First Street. Map © Google.
Why this score? — see what drove the D grade
The composite is a weighted blend of 9 inputs, each scored 0–100. Each bar is that input's sub-score; the figure is the points it added to the 100-point composite (weight × sub-score).
- ARV discount +10.3/15.0
- Appreciation +10.0/10.0
- Cash flow +6.7/30.0
- Livability +3.4/5.0
- 1% rule +2.8/10.0
- Rent growth +2.5/5.0
- Condition / age +2.5/5.0
- Schools +2.4/10.0
- DSCR +1.0/10.0
$190,000
🖨 Deal sheet (PDF) 📄 Offer letter ✓ Due diligence
Listing remarks MLS
Beautiful starting home with a very nice backyard. Featuring 3 bedrooms, 1 bonus room , 3 bathrooms. This house is close to Shopping Centers, Airport and the McAllen-Hidalgo International Bridge. Also the city is working on the installation of a new drainage system.
Key facts
- 5,999 sq ft lot
- 2 garage spots
- Built 2004
Tags
Property features AI
Finance
- Other: Building area reported as 1,559 square feet; Green energy: None
- HOA & community: No homeowners association
Exterior
- Parking: Attached 2-car garage; 2 covered parking spaces; Total of 2 parking spaces
- Utilities: Public water; City sewer; Electric service
- Home design: Single-family property; Living area sourced from HidalgoCAD
- Construction: Brick construction; Slab foundation; Composition shingle roof; Lot owned (approx. 60 x 100)
- Exterior features: Privacy fence; Sidewalks; Paved road access
Interior
- Kitchen: Stove/Range; Electric water heater
- Bedrooms: Master bedroom with walk-in closet(s)
- Flooring: Tile
- Bathrooms: 2 full bathrooms; 1 half bathroom
- Heating & cooling: Central heating (electric); Central air conditioning (electric)
- Interior features: Entrance foyer; Laminate countertops; Ceiling fan(s); No window coverings
- Laundry & utility: Laundry area with washer/dryer connection
Neighborhood map
What this means for you Summary
Snapshot
- This is a 3-bed/2.0-bath single-family listed at $190k.
Deal economics
- At list price, monthly cash flow is $-301 ($-4k/yr) — negative.
- To cash-flow at today's rent, offer at most $137k (28.0% below list).
- To meet the 1% rule (rent ≥ 1% of price), the offer needs to be $148k (22.1% below list).
- Recommended offer: $137k (28.0% below list) — sets the bar for cash-flow.
Location & tenants
- Location reads 68/100 on livability (#488 in TX) — a middle-class / working-renter tenant base. Strengths: cost of living A+, housing A+, crime A-; Watch: amenities F, commute F, employment F.
- Hidalgo ISD (suburban): math 25% / reading 32% proficiency, ranked #678 of 826 in TX (top 82%) — low school quality limits family demand, transient renter base, plan for 1-2y turnover; 66% free/reduced lunch — lower-income household profile, screen leases tightly.
- Zoned schools: Hidalgo El (math 50% / reading 30%, grade F, #1,541 of 4,322 statewide, top 36%, 389 students, 94% FRL); Diaz J H (math 52% / reading 15%, grade F, #911 of 1,662 statewide, top 56%, 565 students, 88% FRL); Hidalgo Early College H S (math 10% / reading 30%, grade F, #1,397 of 1,632 statewide, top 87%, 1,083 students, 86% FRL) — zoned schools average 89% FRL vs 66% district-wide (23 pts higher); higher-poverty schools than district average — tighter screening recommended.
- Market conditions: 98 active listings in the ZIP; 6 comparable units currently listed for rent nearby; rentals at typical pace (median 25d on market — plan ~3-4 weeks tenant-placement turnaround); 7,378 units permitted in Hidalgo County in 2024 (641 in 5+ unit buildings).
Forward outlook
- In year one you build about $20k of equity ($1k loan paydown + $19k appreciation (10.0% local appreciation)).
- Hidalgo County population projected at +28% by 2050 — long-run rental-demand tailwind backs the buy-and-hold thesis.
- By year 2, paydown + projected appreciation supports a ~$33k cash-out refi (75% LTV) — recoverable capital for the next deal without selling this one.
Negotiation context
- It's been on market 145 days — a 12% lower offer ($167k) is reasonable based on typical stale-listing flexibility.
- 3 sale attempts since 15y ago with the ask held roughly flat each time — persistent listings suggest the price (not the market) is what's stuck; bring a comps-based counter.
Risks & watch-outs
- Climate carrying-cost: severe wind risk, 96% chance of damaging wind over 30y; moderate wildfire risk; extreme-heat days projected 7→23/yr by 2055 (HVAC capex compounding) — expect insurance premiums to compound above CPI over the hold.
Questions for the listing agent
- What do current leases actually rent for vs. the listed asking? Can we see a recent rent roll and the last 12 months of T-12 income?
- It's been on market 145 days. Have you received any prior offers? Is the seller open to a 28% concession, seller financing, or rate buy-down credit?
- Why hasn't it sold? Are there any deal-killer items the seller is aware of (foundation, flood, title, zoning, code violations)?
- Is there a deadline driving the sale (1031 exchange, divorce, estate, relocation)? That informs how much negotiation room exists.
- Schools are D-rated, which usually means shorter tenancies and higher turnover. Who's the typical renter profile here, and what's been the actual vacancy rate?
- The area grade is low — what's the realistic commute time and amenity access for the typical tenant pool here? Any planned neighborhood developments (good or bad) we should know about?
- What's the average days-on-market for RENTAL listings here right now (not sales)? A rising rental-DOM trend means longer vacancies and softer asking-rent achievability than the comps imply.
- What's the recent tenant-quality profile in this submarket — average credit score on applications, eviction rate, late-payment / NSF rate, and stable-employment percentage? A property-management company in the area should have these aggregated.
- How much new for-sale + rental construction is in the pipeline within 1–3 miles? Heavy new supply typically softens prices + rents 12–24 months out; constrained supply supports both.
Investment metrics
- 1% rule
- 0.78% ✗
- Cap rate
- 4.39%
- Cash-on-cash
- -6.79%
- DSCR
- 0.70
- GRM
- 10.7
CMA / ARV
- ARV (on-the-fly)
- $202,670
- Comps found
- 12
Show comp detail 12 sales within ~0.75 mi
| Address | Dist | Beds/Ba | Sqft | Sold | Price | $/sf | Match |
|---|---|---|---|---|---|---|---|
| 1210 E Boganbilia Ave | 0.00mi | 4/2.5 (+1) | 1,559 (0%) | 1mo | $190,000 | $122 | 92 |
| 203 S 8th St | 0.27mi | 3/2.0 | 1,596 (+2%) | 6mo | $175,000 | $110 | 78 |
| 904 Camelia Ave | 0.20mi | 3/2.0 | 1,407 (-10%) | 9mo | $183,000 | $130 | 67 |
| 208 N 16th St | 0.49mi | 3/2.0 | 1,534 (-2%) | 14mo | $235,000 | $153 | 63 |
| 1505 Esperanza Ave | 0.38mi | 4/2.0 (+1) | 1,410 (-10%) | 3mo | $177,600 | $126 | 59 |
| 1711 Esperanza Ave | 0.50mi | 3/2.0 | 1,695 (+9%) | 4mo | $220,000 | $130 | 59 |
| 701 E Azalea Ave | 0.36mi | 3/2.5 | 1,331 (-15%) | 3mo | $169,000 | $127 | 54 |
| 2007 E Esperanza Ave | 0.65mi | 3/2.0 | 1,579 (+1%) | 22mo | $149,000 | $94 | 49 |
| 211 N 16th St | 0.51mi | 3/2.0 | 1,760 (+13%) | 12mo | $265,000 | $151 | 44 |
| 212 N 16th St | 0.50mi | 3/3.5 | 1,666 (+7%) | 21mo | $250,000 | $150 | 41 |
| 1904 E Hibiscus Ave | 0.70mi | 3/2.0 | 1,339 (-14%) | 5mo | $190,000 | $142 | 40 |
| 1523 E Gardenia Ave | 0.46mi | 3/2.0 | 1,342 (-14%) | 21mo | $189,500 | $141 | 38 |
Match score weights: distance 35% · size 25% · config 20% · recency 20%. Top-matched comps best support the ARV.
Projected returns pro-forma
10.0% appreciation · 3.0% rent growth · sell at horizon
- IRR
- 19.5%
- Equity multiple
- 2.59×
- Total profit
- $84,414
- Equity at exit
- $171,167
- IRR
- 17.9%
- Equity multiple
- 5.96×
- Total profit
- $263,909
- Equity at exit
- $369,128
Cash invested: $53,200 (down + closing). Projections, not guarantees.
Landlord ↔ Tenant lean methodology
- Overall (STATE)
- 87 Strongly Landlord-Friendly
- State Texas
- 87 Strongly Landlord-Friendly · R+5
- County
- — inherits STATE
- City
- — inherits STATE
ZIP-level market 78557
- Home prices YoY
- 17.9%
- Active inventory
- 98
- Price-to-rent
- 10.7×
Monthly cashflow live
- Estimated rent
- $1,481 high interval (Pro) →
- Mortgage (P&I)
- −$996
- Tax from tax record
- −$395 /mo · $4,746/yr
- Insurance
- −$79
- HOA
- −$0
- Vacancy / Maint / Mgmt
- −$311
- Net cashflow
- $-301
Break-even live
Sensitivity live
| Price | -10% $-194 | -5% $-247 | +0% $-301 | +5% $-355 | +10% $-409 |
|---|---|---|---|---|---|
| Rent | -10% $-418 | -5% $-360 | +0% $-301 | +5% $-243 | +10% $-184 |
| Rate | -1.0pp $-206 | -0.5pp $-253 | base $-301 | +0.5pp $-350 | +1.0pp $-401 |
UW: 25.0% down · 7.5% · 30yr · 1.5% tax · 5.0% vac · 8.0% maint · 8.0% mgmt
Financing live
Cash to close
- Down payment
- $47,500
- Closing costs
- $5,700
- Reserves months
- —
- Total cash needed
- —
Loan-product check · same deal, 3 products live
Conventional
25% down · 7.5% · 30yr
- Down + closing
- —
- Monthly P&I
- —
- Monthly cashflow
- —
- DSCR
- —
- Eligible?
- —
Personal DTI + credit; lowest rate.
DSCR
20% down · 8.5% · 30yr
- Down + closing
- —
- Monthly P&I
- —
- Monthly cashflow
- —
- DSCR
- —
- Eligible?
- —
No personal income docs; deal must DSCR.
Hard money
10% down · 12.0% · 12mo
- Down + closing
- —
- Monthly P&I
- —
- Monthly cashflow
- —
- DSCR
- —
- Eligible?
- —
Short-term bridge; refi at stabilization.
Rent comps 6 comps
| Address | Beds | Baths | Sqft | Rent | $/sqft | DOM | Units | Dist |
|---|---|---|---|---|---|---|---|---|
| 607 Buccaneer Dr Unit 4 Hidalgo, TX | 3.0 | 2.0 | 1068 | $1,600 | $1.50 | 45d | 1 | 0.29mi |
| 605 Buccaneer Dr Unit 3 Hidalgo, TX | 3.0 | 2.0 | 1068 | $1,400 | $1.31 | 25d | 1 | 0.32mi |
| 201 S 5th St Apt 15 Hidalgo, TX | 2.0 | 2.5 | 1172 | $895 | $0.76 | 45d | 1 | 0.48mi |
| 704 S 17th St Hidalgo, TX | 3.0 | 2.0 | 1666 | $1,650 | $0.99 | 25d | 1 | 0.52mi |
| 2509 Coma St Hidalgo, TX | 4.0 | 2.5 | 1804 | $1,750 | $0.97 | 25d | 1 | 1.09mi |
| 2304 E Tamarindo Ave Hidalgo, TX | 3.0 | 2.0 | 1442 | $1,950 | $1.35 | 25d | 1 | 1.47mi |
Listing history 13 events
-
2026-05-09status Pending
-
2026-04-28historical Option
-
2025-12-14$190,000 Active
-
2024-07-10soldstatus Sold 266-char remark
Show marketing remark (266 chars)
Beautiful starting home with a very nice backyard. Featuring 3 bedrooms, 1 bonus room , 3 bathrooms. This house is close to Shopping Centers, Airport and the McAllen-Hidalgo International Bridge. Also the city is working on the installation of a new drainage system.
-
2024-07-10soldstatus
Show marketing remark (266 chars)
Beautiful starting home with a very nice backyard. Featuring 3 bedrooms, 1 bonus room , 3 bathrooms. This house is close to Shopping Centers, Airport and the McAllen-Hidalgo International Bridge. Also the city is working on the installation of a new drainage system.
-
2024-07-09status Pending 266-char remark
Show marketing remark (266 chars)
Beautiful starting home with a very nice backyard. Featuring 3 bedrooms, 1 bonus room , 3 bathrooms. This house is close to Shopping Centers, Airport and the McAllen-Hidalgo International Bridge. Also the city is working on the installation of a new drainage system.
-
2024-07-03historical Option 266-char remark
Show marketing remark (266 chars)
Beautiful starting home with a very nice backyard. Featuring 3 bedrooms, 1 bonus room , 3 bathrooms. This house is close to Shopping Centers, Airport and the McAllen-Hidalgo International Bridge. Also the city is working on the installation of a new drainage system.
-
2024-05-06$199,000 Active 266-char remark
Show marketing remark (266 chars)
Beautiful starting home with a very nice backyard. Featuring 3 bedrooms, 1 bonus room , 3 bathrooms. This house is close to Shopping Centers, Airport and the McAllen-Hidalgo International Bridge. Also the city is working on the installation of a new drainage system.
-
2011-11-23soldstatus
-
2011-11-22soldstatus 189-char remark
Show marketing remark (189 chars)
Great starter home in excellent condition, spacious bedrooms, two living areas and all appliances convey. Property is fenced in for privacy, and it has a nice little courtyard in the front.
-
2011-11-10historical 189-char remark
Show marketing remark (189 chars)
Great starter home in excellent condition, spacious bedrooms, two living areas and all appliances convey. Property is fenced in for privacy, and it has a nice little courtyard in the front.
-
2011-09-14$108,000 189-char remark
Show marketing remark (189 chars)
Great starter home in excellent condition, spacious bedrooms, two living areas and all appliances convey. Property is fenced in for privacy, and it has a nice little courtyard in the front.
-
2004-01-26soldstatus
ⓘ Source: listings_history table (triggers on properties + properties_extension) + one-shot
backfill from property_details.listing_events for pre-trigger history.
Tax reassessment forecast TX · Resets to sale price
- Current annual tax
- $4,746 · $395/mo
- Projected year-2 tax
- $4,746 · $395/mo
- Expected delta
- $0/yr ($0/mo · 0.0%)
ⓘ Screening estimate from a state-policy table — verify with the county assessor before closing.
Climate risk First Street
- Flood 3/10 Moderate FEMA zone X (shaded) · 20% chance over 30 yrs
- Wildfire 5/10 Major
- Heat 9/10 Extreme 7 d/yr ≥111°F today · 23 d/yr by 30 yrs out
- Wind 8/10 Severe 96% chance of damaging wind over 30 yrs
- Air quality 1/10 Low 0 unhealthy d/yr today · 0 by 30 yrs out
Nearby sold comps map
Loading sold comps map…
Walkable amenities ~0.75 mi
Loading nearby amenities…
Taxation est. · year 1
- Rental income
- $17,769
- − Mortgage interest
- −$10,643
- − Property taxes
- −$4,746
- − Insurance
- −$950
- − Repairs & maintenance
- −$1,422
- − Management
- −$1,422
- − Depreciation
- −$5,527
- Taxable loss
- −$6,940
- Est. tax savings @ 24.0%
- +$1,666
- After-tax cash flow
- $-1,949/yr
For passive investors: Depreciation is non-cash, so a rental often shows a tax loss while cash-flowing — sheltering income. Rental losses are passive: they offset passive income freely, and up to $25,000/yr can offset ordinary (W-2) income if you actively participate and your MAGI is under $100k (phasing out to $0 by $150k); unused losses carry forward. On sale, claimed depreciation is recaptured at up to 25%, and gains may owe capital-gains tax (a 1031 exchange can defer both). Figures are a year-1 estimate at your 24.0% rate — not tax advice; consult a CPA.
Schools (NCES district)
- District
- Hidalgo ISD
- NCES district ID
- 4823100
- Math proficiency
- 25% ▼ -32.00%
- Reading proficiency
- 32% ▼ -10.00%
- Median HH income
- $35,219
- Composite
- 23.52/100
- National rank
- #7866
- State rank
- #678 of 826 in TX
Livability — Hidalgo
- Score
- 68/100
- State rank
- #488
- US rank
- #9681
Category grades
Schools grade is shown separately in the Schools card above.
Census & demographics
- Census place
- Hidalgo, TX
- City population
- 14,250
- Population (ZIP)
- 14,250
Population outlook (Hidalgo County) Hauer SSP2
- Today (2025)
- 955,232 people
- By 2030
- 1,009,774 · +5.7%
- By 2040
- 1,120,332 · +17.3%
- By 2050
- 1,225,036 · +28.2%
- By 2075
- 1,439,189 · +50.7%
- By 2100
- 1,533,429 · +60.5%
Race, ethnicity, and origin ACS 2023
- Neighborhood character
- Predominantly Hispanic (99%)
- Race & ethnicity
- Hispanic / Latino 99% Two or more races 47%
- Hispanic origin (detail)
- Mexican 93%
- Foreign-born
- 39% · Canada
- Languages at home
- 6% English-only · Spanish 94%
Political lean MEDSL · Hidalgo
- 2024 margin
- Toss-up / Even · D 48.1% · R 51.0%
- 2008→2024 swing
- -41.6pp toward R · 2008: 38.7pp · 2024: -2.9pp
- All cycles
- 2024: R+2.9 2020: D+17.1 2016: D+40.5 2012: D+41.8 2008: D+38.7
Not yet ingested
- Civics
- —
Market trends
- HPI YoY
- ▲ 34.26%
- Current HPI
- 225.701
- Rent YoY
- —
- Metro
- —
- State GDP YoY
- ▲ 3.95%
- F500 in state
- 110
Industry mix (Fortune 500 HQ in TX)
| Industry | F500 HQs | Revenue |
|---|---|---|
| Energy | 16 | $1,198B |
|
||
| Technology | 5 | $198B |
|
||
| Engineering / Construction | 4 | $72B |
|
||
| Energy Services | 3 | $60B |
|
||
| Utilities | 3 | $41B |
|
||
| Healthcare | 2 | $330B |
|
||
Price history
+75.9% since first listed13 events — show timeline
- 2026-05-09 Pending — MCALLENMLS
- 2026-04-28 Contingent — MCALLENMLS
- 2025-12-14 Listed $190,000 MCALLENMLS
- 2024-07-10 Sold (Public Records) — Public Records
- 2024-07-10 Sold (MLS) — MCALLENMLS
- 2024-07-09 Pending — MCALLENMLS
- 2024-07-03 Contingent — MCALLENMLS
- 2024-05-06 Listed $199,000 MCALLENMLS
- 2011-11-23 Sold (Public Records) — Public Records
- 2011-11-22 Sold (MLS) — MCALLENMLS
- 2011-11-10 Delisted — MCALLENMLS
- 2011-09-14 Listed $108,000 MCALLENMLS
- 2004-01-26 Sold (Public Records) — Public Records
Property tax history
+4.3%/yrLatest (2025): $4,746 · +8.9% YoY. Source: county tax records.
Cash-flow waterfall
monthlySold comps — $/sqft
last 12 mo · ≤1 miLoading sold comps…