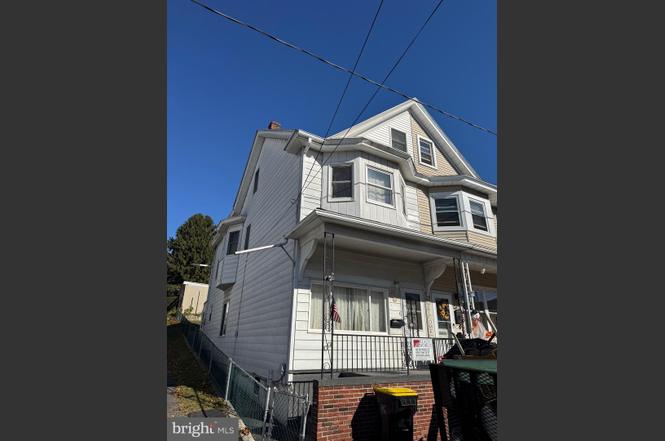
227 Florida Ave · West Mahanoy, PA
Flood risk 1/10 · Minimal
- FEMA flood zone
- X (unshaded)
- Chance of flooding over 30 yrs
- 0.0%
- Est. flood insurance / yr
- $473 – $860
Fire risk 4/10 · Minor
- Est. fire insurance / yr
- $511 – $949
Heat risk 3/10 · Minor
- Hot days now (above 92°F)
- 7 days/yr
- Hot days in 30 yrs
- 15 days/yr
Wind risk 4/10 · Minor
- Chance of severe wind over 30 yrs
- 7.0%
Air-quality risk 2/10 · Minimal
- Unhealthy air days now
- 1 days/yr
- Unhealthy air days in 30 yrs
- 1 days/yr
Risk factors via First Street. Map © Google.
Why this score? — see what drove the D grade
The composite is a weighted blend of 9 inputs, each scored 0–100. Each bar is that input's sub-score; the figure is the points it added to the 100-point composite (weight × sub-score).
- Cash flow +9.9/30.0
- ARV discount +7.5/15.0
- Appreciation +6.9/10.0
- 1% rule +6.4/10.0
- DSCR +2.8/10.0
- Rent growth +2.5/5.0
- Livability +2.5/5.0
- Condition / age +2.5/5.0
- Schools +2.4/10.0
$125,000
🖨 Deal sheet (PDF) 📄 Offer letter ✓ Due diligence
Listing remarks
Welcome to 227 Florida Ave, a 3-bedroom, 1-bath home offering plenty of potential for the right buyer. With a little TLC, this property can truly shine. Conveniently located near local shops, schools, and major routes, it’s a great opportunity for homeowners or investors alike. Bring your vision and make this house your own!
Key facts
- Built 1924
- Listed 12 days
Property features AI
Exterior
- Parking: On-street parking
- Utilities: Public water; Public sewer; Electric for cooling; Oil for heating and hot water
- Home design: Semi-detached property; Fee simple ownership; Estimated year built
- Construction: Aluminum siding, vinyl siding, frame and combination construction; Shingle roof; Permanent foundation; Above-grade and below-grade structures
- Exterior features: Not in a federal flood zone; Lot dimensions approximately 18 x 100
Interior
- Bedrooms: Three bedrooms on the main level
- Bathrooms: One full bathroom on the main level; One full bathroom total
- Heating & cooling: Baseboard hot water heating; Oil fuel for heating and hot water; Electric cooling fuel
- Interior features: Estimated living area; Full basement, partially finished; Two or more access exits
Neighborhood map
What this means for you Summary
Snapshot
- This is a 3-bed/1.0-bath townhouse listed at $125k.
Deal economics
- At list price, monthly cash flow is $-79 ($-946/yr) — negative.
- To cash-flow at today's rent, offer at most $118k (5.2% below list).
- Meets the 1% rule at list price ($1k rent vs $125k).
- Recommended offer: $118k (5.2% below list) — sets the bar for cash-flow.
Location & tenants
- Location reads: area grade D — affects rentability + tenant quality, not the cash-flow math above.
- Shenandoah Valley SD (town): math 20% / reading 38% proficiency, ranked #454 of 539 in PA (top 84%) — low school quality limits family demand, transient renter base, plan for 1-2y turnover; 66% free/reduced lunch — lower-income household profile, screen leases tightly.
- Zoned schools: Shenandoah Valley El Sch (math 21% / reading 41%, grade F, #1,116 of 1,518 statewide, top 74%, 667 students, 100% FRL); Shenandoah Valley Jshs (math 22% / reading 32%, grade F, #365 of 437 statewide, top 85%, 539 students, 96% FRL) — zoned schools average 98% FRL vs 66% district-wide (32 pts higher); higher-poverty schools than district average — tighter screening recommended.
- Market conditions: 63 active listings in the ZIP; 2 comparable units currently listed for rent nearby; 169 units permitted in Schuylkill County in 2024 (0 in 5+ unit buildings).
Forward outlook
- In year one you build about $6k of equity ($864 loan paydown + $5k appreciation (3.8% local appreciation)).
- Schuylkill County population projected at -16% by 2050 — secular population decline; favor cash flow + early exit over multi-decade hold.
- At projected returns (3.8% appreciation + 3.0% rent growth), your $35k cash investment doubles in ~6 years — after that, you're playing with house money.
- By year 6, paydown + projected appreciation supports a ~$30k cash-out refi (75% LTV) — recoverable capital for the next deal without selling this one.
Negotiation context
- Only 12 days on market — expect competitive offers; lowballing is unlikely to land.
- 5 sale attempts since 2y ago with the ask held roughly flat each time — persistent listings suggest the price (not the market) is what's stuck; bring a comps-based counter.
- Current owner paid $80k; list at $125k implies a 56% gain — meaningful room to come down on a strong offer.
Risks & watch-outs
- Watch-outs: property tax is 4.7% of price; built in 1924 — expect roof / HVAC / electrical / plumbing capex.
Questions for the listing agent
- What do current leases actually rent for vs. the listed asking? Can we see a recent rent roll and the last 12 months of T-12 income?
- Built in 1924 — when were the roof, HVAC, electrical panel, plumbing, and water heater last replaced?
- Property tax is high relative to price — has the assessment been appealed recently, and will the sale trigger a re-assessment?
- Is there a deadline driving the sale (1031 exchange, divorce, estate, relocation)? That informs how much negotiation room exists.
- The area grade is low — what's the realistic commute time and amenity access for the typical tenant pool here? Any planned neighborhood developments (good or bad) we should know about?
- What's the average days-on-market for RENTAL listings here right now (not sales)? A rising rental-DOM trend means longer vacancies and softer asking-rent achievability than the comps imply.
- What's the recent tenant-quality profile in this submarket — average credit score on applications, eviction rate, late-payment / NSF rate, and stable-employment percentage? A property-management company in the area should have these aggregated.
- How much new for-sale + rental construction is in the pipeline within 1–3 miles? Heavy new supply typically softens prices + rents 12–24 months out; constrained supply supports both.
Investment metrics
- 1% rule
- 1.14% ✓
- Cap rate
- 5.54%
- Cash-on-cash
- -2.70%
- DSCR
- 0.88
- GRM
- 7.3
CMA / ARV
- ARV (median comp)
- $54,237
- List price
- $125,000
- Delta
- 112.03%
- Verdict
- OVERPRICED
- Comps
- 6 within 1.0 mi
Show comp detail 10 sales within ~0.75 mi
| Address | Dist | Beds/Ba | Sqft | Sold | Price | $/sf | Match |
|---|---|---|---|---|---|---|---|
| 203 Florida Ave | 0.04mi | 3/1.0 | 1,634 (+1%) | 15mo | $90,300 | $55 | 84 |
| 209 Indiana Ave | 0.05mi | 3/1.5 | 1,527 (-5%) | 5mo | $133,000 | $87 | 83 |
| 227 N Chestnut St | 0.41mi | 2/1.0 (-1) | 1,592 (-1%) | 3mo | $19,000 | $12 | 71 |
| 532 W Coal St | 0.49mi | 3/1.5 | 1,694 (+5%) | 4mo | $20,000 | $12 | 63 |
| 515 Centre St | 0.59mi | 4/1.5 (+1) | 1,663 (+3%) | 5mo | $120,000 | $72 | 56 |
| 102 Schuylkill Ave | 0.26mi | 4/2.0 (+1) | 1,400 (-13%) | 9mo | $117,500 | $84 | 49 |
| 123 N Emerick St | 0.65mi | 3/1.0 | 1,710 (+6%) | 19mo | $120,000 | $70 | 43 |
| 35 E Coal St | 0.52mi | 3/1.5 | 1,492 (-8%) | 23mo | $128,750 | $86 | 42 |
| 445 W Coal St | 0.45mi | 4/1.5 (+1) | 1,830 (+14%) | 10mo | $68,000 | $37 | 41 |
| 316 W Oak St | 0.67mi | 4/2.0 (+1) | 1,668 (+3%) | 24mo | $106,000 | $64 | 34 |
Match score weights: distance 35% · size 25% · config 20% · recency 20%. Top-matched comps best support the ARV.
Projected returns pro-forma
3.84% appreciation · 3.0% rent growth · sell at horizon
- IRR
- 7.5%
- Equity multiple
- 1.46×
- Total profit
- $15,941
- Equity at exit
- $62,241
- IRR
- 10.0%
- Equity multiple
- 2.64×
- Total profit
- $57,348
- Equity at exit
- $100,905
Cash invested: $35,000 (down + closing). Projections, not guarantees.
Landlord ↔ Tenant lean methodology
- Overall (STATE)
- 62 Landlord-Friendly
- State Pennsylvania
- 62 Landlord-Friendly · EVEN
- County
- — inherits STATE
- City
- — inherits STATE
ZIP-level market 17976
- Home prices YoY
- 1.3%
- Active inventory
- 63
- Price-to-rent
- 7.3×
Monthly cashflow live
- Estimated rent
- $1,421 medium interval (Pro) →
- Mortgage (P&I)
- −$656
- Tax from tax record
- −$494 /mo · $5,924/yr
- Insurance
- −$52
- HOA
- −$0
- Vacancy / Maint / Mgmt
- −$298
- Net cashflow
- $-79
Break-even live
Sensitivity live
| Price | -10% $345 | -5% $-43 | +0% $-79 | +5% $-114 | +10% $-150 |
|---|---|---|---|---|---|
| Rent | -10% $-191 | -5% $-135 | +0% $-79 | +5% $-23 | +10% $33 |
| Rate | -1.0pp $-16 | -0.5pp $-47 | base $-79 | +0.5pp $-111 | +1.0pp $-144 |
UW: 25.0% down · 7.5% · 30yr · 1.5% tax · 5.0% vac · 8.0% maint · 8.0% mgmt
Financing live
Cash to close
- Down payment
- $31,250
- Closing costs
- $3,750
- Reserves months
- —
- Total cash needed
- —
Loan-product check · same deal, 3 products live
Conventional
25% down · 7.5% · 30yr
- Down + closing
- —
- Monthly P&I
- —
- Monthly cashflow
- —
- DSCR
- —
- Eligible?
- —
Personal DTI + credit; lowest rate.
DSCR
20% down · 8.5% · 30yr
- Down + closing
- —
- Monthly P&I
- —
- Monthly cashflow
- —
- DSCR
- —
- Eligible?
- —
No personal income docs; deal must DSCR.
Hard money
10% down · 12.0% · 12mo
- Down + closing
- —
- Monthly P&I
- —
- Monthly cashflow
- —
- DSCR
- —
- Eligible?
- —
Short-term bridge; refi at stabilization.
Rent comps 2 comps
| Address | Beds | Baths | Sqft | Rent | $/sqft | DOM | Units | Dist |
|---|---|---|---|---|---|---|---|---|
| 230 W Arlington St Shenandoah, PA | 3.0 | 1.0 | 1143 | $1,400 | $1.22 | 45d | 1 | 0.47mi |
| 25 E Oak St Shenandoah, PA | 4.0 | 1.5 | 2220 | $1,450 | $0.65 | 45d | 1 | 0.67mi |
Listing history 26 events
-
2026-06-21days on market $125,000 Active 12 DOM
-
2026-06-21days on market $125,000 Active 11 DOM
-
2026-06-18days on market $125,000 Active 9 DOM
-
2026-06-17days on market $125,000 Active 8 DOM
-
2026-06-16days on market $125,000 Active 7 DOM
-
2026-06-15days on market $125,000 Active 6 DOM
-
2026-06-13days on market $125,000 Active 4 DOM
-
2026-06-12days on market $125,000 Active 3 DOM
-
2026-06-09pricestatusdays on market $125,000 Active 1 DOM
-
2026-05-20historical
-
2026-05-18price $99,900
-
2026-04-02price $115,000
-
2026-04-02status Active
-
2026-02-11historical
-
2025-12-29price $125,000
-
2025-11-25price $129,900
-
2025-11-14$135,000 Active
-
2025-09-18historical
-
2025-08-27$140,000 Active
-
2024-11-13soldstatus $80,000
-
2024-11-08soldstatus $80,000 Closed
-
2024-10-10status Pending
-
2024-10-01price $99,500
-
2024-08-22price $110,000
-
2024-07-24price $119,000
-
2024-06-04$125,000 Active
ⓘ Source: listings_history table (triggers on properties + properties_extension) + one-shot
backfill from property_details.listing_events for pre-trigger history.
Tax reassessment forecast PA · Partial reset (capped growth)
- Current annual tax
- $5,924 · $494/mo
- Projected year-2 tax
- $5,924 · $494/mo
- Expected delta
- $0/yr ($0/mo · 0.0%)
ⓘ Screening estimate from a state-policy table — verify with the county assessor before closing.
Climate risk First Street
- Flood 1/10 Low FEMA zone X (unshaded) · 0% chance over 30 yrs
- Wildfire 4/10 Moderate
- Heat 3/10 Moderate 7 d/yr ≥92°F today · 15 d/yr by 30 yrs out
- Wind 4/10 Moderate 7% chance of damaging wind over 30 yrs
- Air quality 2/10 Low 1 unhealthy d/yr today · 1 by 30 yrs out
Nearby sold comps map
Loading sold comps map…
Walkable amenities ~0.75 mi
Loading nearby amenities…
Taxation est. · year 1
- Rental income
- $17,051
- − Mortgage interest
- −$7,002
- − Property taxes
- −$5,924
- − Insurance
- −$625
- − Repairs & maintenance
- −$1,364
- − Management
- −$1,364
- − Depreciation
- −$3,636
- Taxable loss
- −$2,865
- Est. tax savings @ 24.0%
- +$688
- After-tax cash flow
- $-258/yr
For passive investors: Depreciation is non-cash, so a rental often shows a tax loss while cash-flowing — sheltering income. Rental losses are passive: they offset passive income freely, and up to $25,000/yr can offset ordinary (W-2) income if you actively participate and your MAGI is under $100k (phasing out to $0 by $150k); unused losses carry forward. On sale, claimed depreciation is recaptured at up to 25%, and gains may owe capital-gains tax (a 1031 exchange can defer both). Figures are a year-1 estimate at your 24.0% rate — not tax advice; consult a CPA.
Schools (NCES district)
- District
- Shenandoah Valley SD
- NCES district ID
- 4221490
- Math proficiency
- 20% ▼ -8.00%
- Reading proficiency
- 38% ▼ -6.00%
- Median HH income
- $31,968
- Composite
- 23.58/100
- National rank
- #7851
- State rank
- #454 of 539 in PA
Livability — West Mahanoy
No livability data for this city. (Only ~50 U.S. cities are tracked.)
Census & demographics
- Census place
- Shenandoah Heights, PA
- Population (ZIP)
- 5,988
Population outlook (Schuylkill County) Hauer SSP2
- Today (2025)
- 137,447 people
- By 2030
- 133,121 · -3.1%
- By 2040
- 124,172 · -9.7%
- By 2050
- 115,611 · -15.9%
- By 2075
- 100,796 · -26.7%
- By 2100
- 86,667 · -36.9%
Race, ethnicity, and origin ACS 2023
- Neighborhood character
- Majority White (63%)
- Race & ethnicity
- White 63% Hispanic / Latino 34% Two or more races 12% Black 2%
- Hispanic origin (detail)
- Mexican 10% Puerto Rican 8% Dominican 11%
- Common ancestry
- Romanian 20% Iranian 2% Scotch-Irish 2%
- Foreign-born
- 10% · Canada
- Languages at home
- 68% English-only · Spanish 30% Russian/Polish/Slavic 1%
Political lean MEDSL · Schuylkill
- 2024 margin
- Solid R (+42.1) · D 28.5% · R 70.6%
- 2008→2024 swing
- -33.4pp toward R · 2008: -8.7pp · 2024: -42.1pp
- All cycles
- 2024: R+42.1 2020: R+39.9 2016: R+43.4 2012: R+13.4 2008: R+8.7
Not yet ingested
- Civics
- —
Market trends
- HPI YoY
- ▲ 3.84%
- Current HPI
- 308.8036
- Rent YoY
- —
- Metro
- —
- State GDP YoY
- ▲ 1.68%
- F500 in state
- 34
Industry mix (Fortune 500 HQ in PA)
| Industry | F500 HQs | Revenue |
|---|---|---|
| Healthcare | 2 | $309B |
|
||
| Insurance | 2 | $27B |
|
||
| Telecommunications / Media | 1 | $124B |
|
||
| Industrial Distribution | 1 | $22B |
|
||
| Financial Services | 1 | $20B |
|
||
| Chemicals / Materials | 1 | $18B |
|
||
Price history
+0.0% since first listed18 events — show timeline
- 2026-06-09 Listed $125,000 BRIGHT MLS
- 2026-05-20 Listing Removed — BRIGHT MLS
- 2026-05-18 Price Changed $99,900 BRIGHT MLS
- 2026-04-02 Price Changed $115,000 BRIGHT MLS
- 2026-04-02 Relisted — BRIGHT MLS
- 2026-02-11 Listing Removed — BRIGHT MLS
- 2025-12-29 Price Changed $125,000 BRIGHT MLS
- 2025-11-25 Price Changed $129,900 BRIGHT MLS
- 2025-11-14 Listed $135,000 BRIGHT MLS
- 2025-09-18 Listing Removed — BRIGHT MLS
- 2025-08-27 Listed $140,000 BRIGHT MLS
- 2024-11-13 Sold (Public Records) $80,000 Public Records
- 2024-11-08 Sold (MLS) $80,000 BRIGHT MLS
- 2024-10-10 Pending — BRIGHT MLS
- 2024-10-01 Price Changed $99,500 BRIGHT MLS
- 2024-08-22 Price Changed $110,000 BRIGHT MLS
- 2024-07-24 Price Changed $119,000 BRIGHT MLS
- 2024-06-04 Listed $125,000 BRIGHT MLS
Property tax history
+16.6%/yrLatest (2026): $5,924 · +388.2% YoY. Source: county tax records.
Cash-flow waterfall
monthlySold comps — $/sqft
last 12 mo · ≤1 miLoading sold comps…