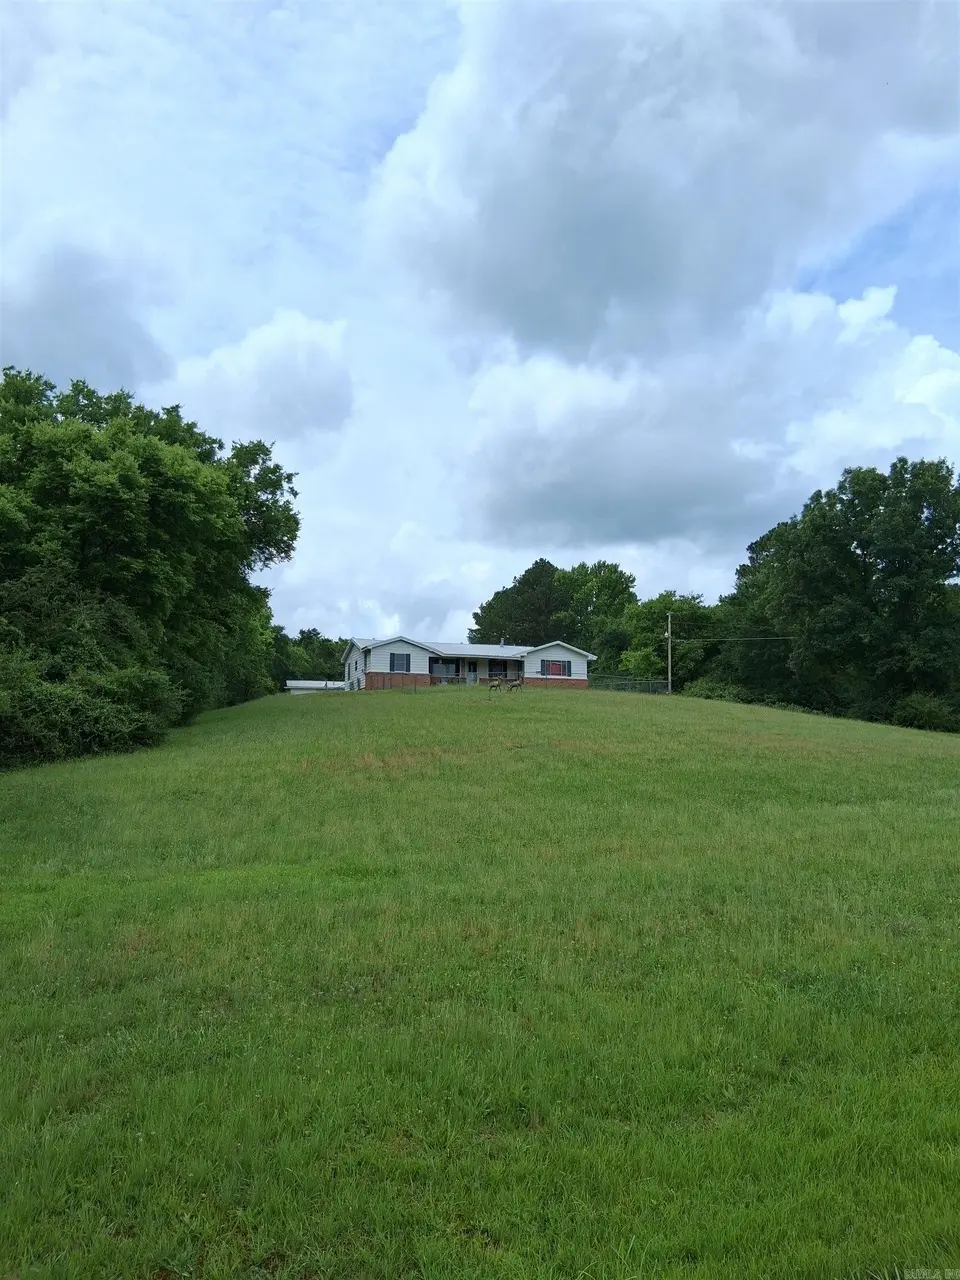
2373 N Hwy 7 · Hot Springs Village, AR
Flood risk 1/10 · Minimal
- FEMA flood zone
- X (unshaded)
- Chance of flooding over 30 yrs
- 0.0%
- Est. flood insurance / yr
- $507 – $1,088
Fire risk 5/10 · Moderate
- Est. fire insurance / yr
- $1,499 – $2,785
Heat risk 5/10 · Moderate
- Hot days now (above 111°F)
- 7 days/yr
- Hot days in 30 yrs
- 19 days/yr
Wind risk 3/10 · Minor
- Chance of severe wind over 30 yrs
- 7.0%
Air-quality risk 2/10 · Minimal
- Unhealthy air days now
- 0 days/yr
- Unhealthy air days in 30 yrs
- 1 days/yr
Risk factors via First Street. Map © Google.
Why this score? — see what drove the C+ grade
The composite is a weighted blend of 9 inputs, each scored 0–100. Each bar is that input's sub-score; the figure is the points it added to the 100-point composite (weight × sub-score).
- Cash flow +25.9/30.0
- DSCR +8.7/10.0
- ARV discount +7.5/15.0
- 1% rule +6.1/10.0
- Schools +3.6/10.0
- Livability +3.5/5.0
- Rent growth +2.5/5.0
- Condition / age +2.5/5.0
- Appreciation +0.0/10.0
$150,000
🖨 Deal sheet 📄 Offer letter ✓ Due diligence
Listing remarks
Rare investment opportunity with nearly 4 acres in a highly desirable location! This property is all about the land and the potential it offers. Whether you're looking to develop, build new, create multiple income streams, or hold for future appreciation, the possibilities here are wide open. Existing structures on the property—including a fixer-upper home with solid bones and metal roof, three sheds, covered parking for three vehicles, and a well house—are an added bonus and provide immediate flexibility for renovation, rental, storage, or workspace. This is a prime chance to secure land with multiple exit strategies. SOLD AS-IS, this property is ideal for investors, builders,
Key facts
- 3 car carport
- Metal roof
- Rv parking
Tags
Property features AI
Finance
- Other: Approximately 3.79 acres
Exterior
- Parking: Garage; Carport; Parking pads; Rear-entry parking for 3 cars
- Utilities: Public water and well; Public sewer and septic; Natural gas
- Home design: Brick exterior
- Construction: Metal roof; Crawl space and slab foundation; Built with brick exterior
- Exterior features: Patio; Fully fenced yard; Partially fenced areas; Outside storage area; RV parking; Chain link fencing; Gravel road access; Sloped and level terrain; Rural setting with mountain views; Livestock allowed
Interior
- Kitchen: Free-standing stove; Gas range; Bar with refrigerator space
- Flooring: Wood flooring; Tile flooring
- Bathrooms: 1 full bathroom
- Heating & cooling: Central gas heat; Window air conditioning units
- Interior features: Wet bar; Washer connection; Electric log fireplace; Sheetrock walls/ceilings
- Laundry & utility: Washer connection
Neighborhood map
What this means for you Summary
Snapshot
- This is a 3-bed/1.0-bath single-family listed at $150k.
Deal economics
- At list price, monthly cash flow is $370 ($4k/yr) — positive.
- The deal already cash-flows at list — no discount required.
- Meets the 1% rule at list price ($2k rent vs $150k).
- Cap rate 9.3% vs local median 3.6% in Hot Springs Village — top-decile yield for the area; either an underpriced asset or a hidden risk that comps aren't pricing in. Stress-test before assuming the spread holds.
Location & tenants
- Location reads 69/100 on livability (#76 in AR) — a middle-class / working-renter tenant base. Strengths: crime A+, housing A+, cost of living A; Watch: schools D+, amenities F, commute F.
- Fountain Lake School District (rural): math 43% / reading 40% proficiency, ranked #49 of 238 in AR (top 21%) — families likely to look elsewhere, expect single-tenant / working-renter base with shorter leases.
- Market conditions: 766 active listings in the ZIP; solid renter incomes; 117 units permitted in Garland County in 2024 (24 in 5+ unit buildings).
Forward outlook
- Local home prices are declining (-3.0%/yr); year-one equity from $1k of loan paydown is wiped out by about $4k of value loss. Plan a longer hold.
- Garland County population projected at +7% by 2050 — modest demand growth; plan on rents tracking national, not racing it.
Negotiation context
- Only 2 days on market — expect competitive offers; lowballing is unlikely to land.
- 4 sale attempts with the ask held roughly flat each time — persistent listings suggest the price (not the market) is what's stuck; bring a comps-based counter.
Risks & watch-outs
- Watch-outs: built in 1959 — expect roof / HVAC / electrical / plumbing capex.
- Climate carrying-cost: moderate wildfire risk; extreme-heat days projected 7→19/yr by 2055 (HVAC capex compounding) — expect insurance premiums to compound above CPI over the hold.
Questions for the listing agent
- Built in 1959 — when were the roof, HVAC, electrical panel, plumbing, and water heater last replaced?
- Is there a deadline driving the sale (1031 exchange, divorce, estate, relocation)? That informs how much negotiation room exists.
- Schools are D-rated, which usually means shorter tenancies and higher turnover. Who's the typical renter profile here, and what's been the actual vacancy rate?
- What's the average days-on-market for RENTAL listings here right now (not sales)? A rising rental-DOM trend means longer vacancies and softer asking-rent achievability than the comps imply.
- What's the recent tenant-quality profile in this submarket — average credit score on applications, eviction rate, late-payment / NSF rate, and stable-employment percentage? A property-management company in the area should have these aggregated.
- How much new for-sale + rental construction is in the pipeline within 1–3 miles? Heavy new supply typically softens prices + rents 12–24 months out; constrained supply supports both.
Investment metrics
- 1% rule
- 1.11% ✓
- Cap rate
- 9.25%
- Cash-on-cash
- 10.57%
- DSCR
- 1.47
- GRM
- 7.5
CMA / ARV
- ARV (median comp)
- $312,985
- List price
- $150,000
- Delta
- -60.06%
- Verdict
- UNDERPRICED
- Comps
- 6 within 1.0 mi
Projected returns pro-forma
-3.0% appreciation · 3.0% rent growth · sell at horizon
- IRR
- -0.5%
- Equity multiple
- 0.98×
- Total profit
- $-770
- Equity at exit
- $22,365
- IRR
- 9.2%
- Equity multiple
- 1.70×
- Total profit
- $29,543
- Equity at exit
- $12,969
Cash invested: $42,000 (down + closing). Projections, not guarantees.
Landlord ↔ Tenant lean methodology
- Overall (STATE)
- 92 Strongly Landlord-Friendly
- State Arkansas
- 92 Strongly Landlord-Friendly · R+14
- County
- — inherits STATE
- City
- — inherits STATE
ZIP-level market 71909
- Home prices YoY
- -10.9%
- Active inventory
- 766
- Price-to-rent
- 7.5×
Monthly cashflow live
- Estimated rent
- $1,660 medium interval (Pro) →
- Mortgage (P&I)
- −$787
- Tax from tax record
- −$92 /mo · $1,108/yr
- Insurance
- −$62
- HOA
- −$0
- Vacancy / Maint / Mgmt
- −$349
- Net cashflow
- $370
Break-even live
UW: 25.0% down · 7.5% · 30yr · 1.5% tax · 5.0% vac · 8.0% maint · 8.0% mgmt
Financing live
Cash to close
- Down payment
- $37,500
- Closing costs
- $4,500
- Reserves months
- —
- Total cash needed
- —
Loan-product check · same deal, 3 products live
Conventional
25% down · 7.5% · 30yr
- Down + closing
- —
- Monthly P&I
- —
- Monthly cashflow
- —
- DSCR
- —
- Eligible?
- —
Personal DTI + credit; lowest rate.
DSCR
20% down · 8.5% · 30yr
- Down + closing
- —
- Monthly P&I
- —
- Monthly cashflow
- —
- DSCR
- —
- Eligible?
- —
No personal income docs; deal must DSCR.
Hard money
10% down · 12.0% · 12mo
- Down + closing
- —
- Monthly P&I
- —
- Monthly cashflow
- —
- DSCR
- —
- Eligible?
- —
Short-term bridge; refi at stabilization.
Listing history 9 events
-
2026-06-13status $150,000 Under Contract 2 DOM
-
2026-06-10days on market $150,000 New Listing 2 DOM
-
2026-06-09pricestatusdays on market $150,000 New Listing 1 DOM
-
2026-05-14historical
-
2026-05-03status Back on Market
-
2026-04-11historical Take Backups
-
2026-03-31status Back on Market
-
2026-03-21historical Take Backups
-
2026-03-17$125,000 New Listing
ⓘ Source: listings_history table (triggers on properties + properties_extension) + one-shot
backfill from property_details.listing_events for pre-trigger history.
Tax reassessment forecast AR · Resets to sale price
- Current annual tax
- $1,108 · $92/mo
- Projected year-2 tax
- $1,108 · $92/mo
- Expected delta
- $0/yr ($0/mo · 0.0%)
ⓘ Screening estimate from a state-policy table — verify with the county assessor before closing.
Climate risk First Street
- Flood 1/10 Low FEMA zone X (unshaded) · 0% chance over 30 yrs
- Wildfire 5/10 Major
- Heat 5/10 Major 7 d/yr ≥111°F today · 19 d/yr by 30 yrs out
- Wind 3/10 Moderate 7% chance of damaging wind over 30 yrs
- Air quality 2/10 Low 0 unhealthy d/yr today · 1 by 30 yrs out
Nearby sold comps map
Loading sold comps map…
Walkable amenities ~0.75 mi
Loading nearby amenities…
Taxation est. · year 1
- Rental income
- $19,922
- − Mortgage interest
- −$8,402
- − Property taxes
- −$1,108
- − Insurance
- −$750
- − Repairs & maintenance
- −$1,594
- − Management
- −$1,594
- − Depreciation
- −$4,364
- Taxable income
- $2,110
- Est. tax owed @ 24.0%
- −$506
- After-tax cash flow
- $3,934/yr
For passive investors: Depreciation is non-cash, so a rental often shows a tax loss while cash-flowing — sheltering income. Rental losses are passive: they offset passive income freely, and up to $25,000/yr can offset ordinary (W-2) income if you actively participate and your MAGI is under $100k (phasing out to $0 by $150k); unused losses carry forward. On sale, claimed depreciation is recaptured at up to 25%, and gains may owe capital-gains tax (a 1031 exchange can defer both). Figures are a year-1 estimate at your 24.0% rate — not tax advice; consult a CPA.
Schools (NCES district)
- District
- Fountain Lake School District
- NCES district ID
- 0506420
- Math proficiency
- 43% ▼ -10.00%
- Reading proficiency
- 40% ▼ -6.00%
- Median HH income
- $52,435
- Composite
- 35.99/100
- National rank
- #4789
- State rank
- #49 of 238 in AR
Livability — Hot Springs Village
- Score
- 69/100
- State rank
- #76
- US rank
- #8970
Category grades
Schools grade is shown separately in the Schools card above.
Census & demographics
- County
- Saline County · 77,216 people
- City population
- 18,449
- Metro
- Little Rock-North Little Rock-Conway, AR
- Population (ZIP)
- 18,449
- Household income
- $75,433
- Rent vs Own
- Severe rent burden
- 207.0
Population outlook (Garland County) Hauer SSP2
- Today (2025)
- 100,343 people
- By 2030
- 101,880 · +1.5%
- By 2040
- 104,804 · +4.4%
- By 2050
- 107,292 · +6.9%
- By 2075
- 113,182 · +12.8%
- By 2100
- 112,247 · +11.9%
Race, ethnicity, and origin ACS 2023
- Neighborhood character
- Predominantly White (93%)
- Race & ethnicity
- White 93% Two or more races 3% Hispanic / Latino 2%
- Common ancestry
- Slovak 3% Romanian 3% Serbian 2%
- Foreign-born
- 2% · Canada, Vietnam
- Languages at home
- 97% English-only · Spanish 1%
Political lean MEDSL · Garland
- 2024 margin
- Solid R (+36.2) · D 30.8% · R 67.0% · Other 2.2%
- 2008→2024 swing
- -11.3pp toward R · 2008: -25.0pp · 2024: -36.2pp
- All cycles
- 2024: R+36.2 2020: R+34.0 2016: R+34.1 2012: R+29.9 2008: R+25.0
Not yet ingested
- Civics
- —
Market trends
- HPI YoY
- ▼ -24.00%
- Current HPI
- 195.9499
- Rent YoY
- —
- Metro
- Little Rock-North Little Rock-Conway, AR
- State GDP YoY
- ▲ 3.80%
- F500 in state
- 10
Industry mix (Fortune 500 HQ in AR)
| Industry | F500 HQs | Revenue |
|---|---|---|
| Retail | 1 | $681B |
|
||
| Food / Agriculture | 1 | $53B |
|
||
| Retail / Energy | 1 | $22B |
|
||
| Transportation / Logistics | 1 | $12B |
|
||
| Energy | 1 | $4B |
|
||
Price history
+20.0% since first listed8 events — show timeline
- 2026-06-10 Pending — CARMLS
- 2026-06-08 Listed $150,000 CARMLS
- 2026-05-14 Listing Removed — CARMLS
- 2026-05-03 Relisted — CARMLS
- 2026-04-11 Contingent — CARMLS
- 2026-03-31 Relisted — CARMLS
- 2026-03-21 Contingent — CARMLS
- 2026-03-17 Listed $125,000 CARMLS
Property tax history
+8.3%/yrLatest (2025): $1,108 · +5.7% YoY. Source: county tax records.
Cash-flow waterfall
monthlySold comps — $/sqft
last 12 mo · ≤1 miLoading sold comps…