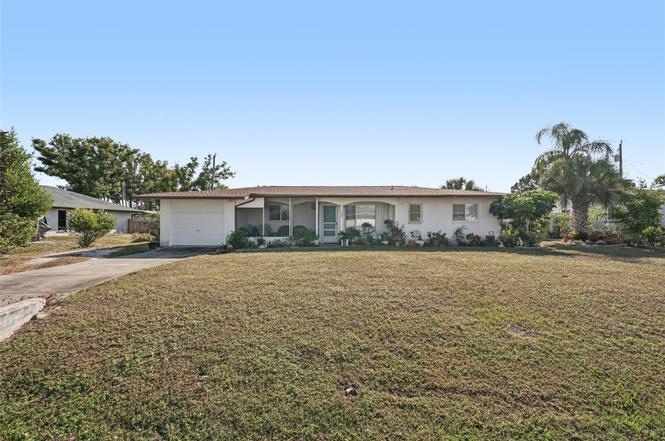
300 Gardenia Rd · Venice Gardens, FL
Flood risk 1/10 · Minimal
- FEMA flood zone
- X (unshaded)
- Chance of flooding over 30 yrs
- 0.0%
- Est. flood insurance / yr
- $507 – $1,088
Fire risk 1/10 · Minimal
- Est. fire insurance / yr
- $947 – $1,759
Heat risk 10/10 · Severe
- Hot days now (above 107°F)
- 7 days/yr
- Hot days in 30 yrs
- 30 days/yr
Wind risk 10/10 · Severe
- Chance of severe wind over 30 yrs
- 99.0%
Air-quality risk 2/10 · Minimal
- Unhealthy air days now
- 1 days/yr
- Unhealthy air days in 30 yrs
- 1 days/yr
Risk factors via First Street. Map © Google.
Why this score? — see what drove the C- grade
The composite is a weighted blend of 9 inputs, each scored 0–100. Each bar is that input's sub-score; the figure is the points it added to the 100-point composite (weight × sub-score).
- Cash flow +20.0/30.0
- ARV discount +7.5/15.0
- DSCR +6.3/10.0
- Schools +5.4/10.0
- 1% rule +4.6/10.0
- Livability +3.4/5.0
- Rent growth +2.7/5.0
- Condition / age +2.5/5.0
- Appreciation +0.0/10.0
$239,000
🖨 Deal sheet (PDF) 📄 Offer letter ✓ Due diligence
Listing remarks
Welcome to Gardenia Rd!!! This charming 2-bedroom 2- bath with a bonus room!! Located perfectly just a half a mile from shopping and dining! And only 4 miles to the beach! Enjoy the conveyance of a vibrant friendly neighborhood with everything you need close by. Come make this great home your new home!!All sizes approximate! The home features a newer roof, updated windows, and a relaxing back lanai, Ideal for morning coffee or evening unwinding! With just a few personal touches or light updates, this property has the potential to become a true "Diamond in the rough! Whether you're a first-time home buyer, investor, or someone looking for a cozy Florida retreat, this home offers co
Key facts
- Newer roof
- Updated windows
- Bonus room
Tags
Neighborhood map
What this means for you Summary
Snapshot
- This is a 2-bed/2.0-bath single-family listed at $239k.
Deal economics
- At list price, monthly cash flow is $291 ($3k/yr) — positive.
- The deal already cash-flows at list — no discount required.
- To meet the 1% rule (rent ≥ 1% of price), the offer needs to be $229k (4.1% below list).
- Recommended offer: $217k (9.0% below list) — sets the bar for market timing.
Location & tenants
- Location reads 68/100 on livability (#537 in FL) — a middle-class / working-renter tenant base. Strengths: crime A+, housing A+, health & safety A-; Watch: amenities F, commute F.
- Sarasota (urban): math 63% / reading 63% proficiency, ranked #7 of 73 in FL (top 10%) — acceptable for families but not a draw, mixed tenant base, ~2y average lease.
- Zoned schools: Garden Elementary School (math 71% / reading 69%, grade A-, #345 of 2,144 statewide, top 17%, 513 students, 52% FRL); Venice Middle School (math 71% / reading 58%, grade A-, #100 of 571 statewide, top 18%, 761 students, 37% FRL); Venice Senior High School (math 67% / reading 61%, grade B-, #86 of 667 statewide, top 13%, 2,584 students, 31% FRL) — zoned schools at 40% FRL track the district average.
- Market conditions: Rents flat; 1255 active listings in the ZIP; solid renter incomes; 7,466 units permitted in Sarasota County in 2024 (2,138 in 5+ unit buildings).
- This rent runs 31% of the median local income ($90k/yr) — at the standard rent-burdened threshold; future hikes will face affordability resistance.
Forward outlook
- Local home prices are declining (-3.0%/yr); year-one equity from $2k of loan paydown is wiped out by about $7k of value loss. Plan a longer hold.
- Sarasota County population projected at +20% by 2050 — long-run rental-demand tailwind backs the buy-and-hold thesis.
Negotiation context
- It's been on market 114 days — a 9% lower offer ($217k) is reasonable based on typical stale-listing flexibility.
- 2 sale attempts; this cycle's ask has dropped $30k (11%) from the opening price — seller is motivated, your offer sets the floor, not the list.
- Current owner paid $85k; list at $239k implies a 182% gain — meaningful room to come down on a strong offer.
Risks & watch-outs
- Climate carrying-cost: severe wind risk, 99% chance of damaging wind over 30y; extreme-heat days projected 7→30/yr by 2055 (HVAC capex compounding) — expect insurance premiums to compound above CPI over the hold.
Questions for the listing agent
- It's been on market 114 days. Have you received any prior offers? Is the seller open to a 9% concession, seller financing, or rate buy-down credit?
- Built in 1960 — when were the roof, HVAC, electrical panel, plumbing, and water heater last replaced?
- Why hasn't it sold? Are there any deal-killer items the seller is aware of (foundation, flood, title, zoning, code violations)?
- Is there a deadline driving the sale (1031 exchange, divorce, estate, relocation)? That informs how much negotiation room exists.
- Schools are D-rated, which usually means shorter tenancies and higher turnover. Who's the typical renter profile here, and what's been the actual vacancy rate?
- What's the average days-on-market for RENTAL listings here right now (not sales)? A rising rental-DOM trend means longer vacancies and softer asking-rent achievability than the comps imply.
- What's the recent tenant-quality profile in this submarket — average credit score on applications, eviction rate, late-payment / NSF rate, and stable-employment percentage? A property-management company in the area should have these aggregated.
- How much new for-sale + rental construction is in the pipeline within 1–3 miles? Heavy new supply typically softens prices + rents 12–24 months out; constrained supply supports both.
Investment metrics
- 1% rule
- 0.96% ✗
- Cap rate
- 7.76%
- Cash-on-cash
- 5.22%
- DSCR
- 1.23
- GRM
- 8.7
CMA / ARV
No comps found within radius.
Projected returns pro-forma
-3.0% appreciation · 0.7% rent growth · sell at horizon
- IRR
- -10.7%
- Equity multiple
- 0.62×
- Total profit
- $-25,406
- Equity at exit
- $35,636
- IRR
- -4.7%
- Equity multiple
- 0.72×
- Total profit
- $-18,735
- Equity at exit
- $20,664
Cash invested: $66,920 (down + closing). Projections, not guarantees.
Landlord ↔ Tenant lean methodology
- Overall (STATE)
- 87 Strongly Landlord-Friendly
- State Florida
- 87 Strongly Landlord-Friendly · R+3
- County
- — inherits STATE
- City
- — inherits STATE
ZIP-level market 34293
- Rents YoY
- 0.7%
- Active inventory
- 1255
- Price-to-rent
- 8.7×
Monthly cashflow live
- Estimated rent
- $2,291 medium interval (Pro) →
- Mortgage (P&I)
- −$1,253
- Tax from tax record
- −$166 /mo · $1,987/yr
- Insurance
- −$100
- HOA
- −$0
- Vacancy / Maint / Mgmt
- −$481
- Net cashflow
- $291
Break-even live
Sensitivity live
| Price | -10% $427 | -5% $359 | +0% $291 | +5% $224 | +10% $156 |
|---|---|---|---|---|---|
| Rent | -10% $110 | -5% $201 | +0% $291 | +5% $382 | +10% $472 |
| Rate | -1.0pp $412 | -0.5pp $352 | base $291 | +0.5pp $229 | +1.0pp $166 |
UW: 25.0% down · 7.5% · 30yr · 1.5% tax · 5.0% vac · 8.0% maint · 8.0% mgmt
Financing live
Cash to close
- Down payment
- $59,750
- Closing costs
- $7,170
- Reserves months
- —
- Total cash needed
- —
Loan-product check · same deal, 3 products live
Conventional
25% down · 7.5% · 30yr
- Down + closing
- —
- Monthly P&I
- —
- Monthly cashflow
- —
- DSCR
- —
- Eligible?
- —
Personal DTI + credit; lowest rate.
DSCR
20% down · 8.5% · 30yr
- Down + closing
- —
- Monthly P&I
- —
- Monthly cashflow
- —
- DSCR
- —
- Eligible?
- —
No personal income docs; deal must DSCR.
Hard money
10% down · 12.0% · 12mo
- Down + closing
- —
- Monthly P&I
- —
- Monthly cashflow
- —
- DSCR
- —
- Eligible?
- —
Short-term bridge; refi at stabilization.
Listing history 10 events
-
2026-04-07status Pending
-
2026-02-18price $239,000
-
2026-01-18price $249,000
-
2026-01-06status Active
-
2025-12-15status Pending
-
2025-11-22$269,000 Active
-
2001-01-31soldstatus $84,900
-
2000-04-03soldstatus $49,900
-
1997-03-19soldstatus $55,000
-
1971-12-01soldstatus $17,500
ⓘ Source: listings_history table (triggers on properties + properties_extension) + one-shot
backfill from property_details.listing_events for pre-trigger history.
Tax reassessment forecast FL · Resets to sale price
- Current annual tax
- $1,987 · $166/mo
- Projected year-2 tax
- $1,987 · $166/mo
- Expected delta
- $0/yr ($0/mo · 0.0%)
ⓘ Screening estimate from a state-policy table — verify with the county assessor before closing.
Climate risk First Street
- Flood 1/10 Low FEMA zone X (unshaded) · 0% chance over 30 yrs
- Wildfire 1/10 Low
- Heat 10/10 Extreme 7 d/yr ≥107°F today · 30 d/yr by 30 yrs out
- Wind 10/10 Extreme 99% chance of damaging wind over 30 yrs
- Air quality 2/10 Low 1 unhealthy d/yr today · 1 by 30 yrs out
Nearby sold comps map
Loading sold comps map…
Walkable amenities ~0.75 mi
Loading nearby amenities…
Taxation est. · year 1
- Rental income
- $27,491
- − Mortgage interest
- −$13,388
- − Property taxes
- −$1,987
- − Insurance
- −$1,195
- − Repairs & maintenance
- −$2,199
- − Management
- −$2,199
- − Depreciation
- −$6,953
- Taxable loss
- −$430
- Est. tax savings @ 24.0%
- +$103
- After-tax cash flow
- $3,599/yr
For passive investors: Depreciation is non-cash, so a rental often shows a tax loss while cash-flowing — sheltering income. Rental losses are passive: they offset passive income freely, and up to $25,000/yr can offset ordinary (W-2) income if you actively participate and your MAGI is under $100k (phasing out to $0 by $150k); unused losses carry forward. On sale, claimed depreciation is recaptured at up to 25%, and gains may owe capital-gains tax (a 1031 exchange can defer both). Figures are a year-1 estimate at your 24.0% rate — not tax advice; consult a CPA.
Schools (NCES district)
- District
- Sarasota
- NCES district ID
- 1201680
- Math proficiency
- 63% ▼ -8.00%
- Reading proficiency
- 63% ▼ -3.00%
- Median HH income
- $51,167
- Composite
- 53.68/100
- National rank
- #1428
- State rank
- #7 of 73 in FL
Livability — Venice Gardens
- Score
- 68/100
- State rank
- #537
- US rank
- #10074
Category grades
Schools grade is shown separately in the Schools card above.
Census & demographics
- Census place
- Venice Gardens, FL
- County
- Sarasota County · 448,376 people
- Metro
- North Port-Sarasota-Bradenton, FL
- Population (ZIP)
- 50,278
- Household income
- $90,038
- Rent vs Own
- Severe rent burden
- 548.0
Population outlook (Sarasota County) Hauer SSP2
- Today (2025)
- 452,380 people
- By 2030
- 474,175 · +4.8%
- By 2040
- 511,577 · +13.1%
- By 2050
- 541,467 · +19.7%
- By 2075
- 604,947 · +33.7%
- By 2100
- 621,965 · +37.5%
Race, ethnicity, and origin ACS 2023
- Neighborhood character
- Predominantly White (90%)
- Race & ethnicity
- White 90% Hispanic / Latino 5% Two or more races 4% Asian 2%
- Hispanic origin (detail)
- Mexican 1% Puerto Rican 2%
- Common ancestry
- Romanian 7% Lithuanian 4% Slovak 3%
- Foreign-born
- 9% · Canada, China, Dominican Republic
- Languages at home
- 90% English-only · Spanish 3% Russian/Polish/Slavic 2% French/Haitian/Cajun 1%
Political lean MEDSL · Sarasota
- 2024 margin
- R (+18.2) · D 40.5% · R 58.7%
- 2008→2024 swing
- -18.1pp toward R · 2008: -0.1pp · 2024: -18.2pp
- All cycles
- 2024: R+18.2 2020: R+10.4 2016: R+11.6 2012: R+7.4 2008: R+0.1
Not yet ingested
- Civics
- —
Market trends
- HPI YoY
- ▼ -355.64%
- Current HPI
- 270.5242
- Rent YoY
- ▲ 0.70%
- Metro
- North Port-Sarasota-Bradenton, FL
- State GDP YoY
- ▲ 3.28%
- F500 in state
- 36
Industry mix (Fortune 500 HQ in FL)
| Industry | F500 HQs | Revenue |
|---|---|---|
| Industrial Technology | 2 | $29B |
|
||
| Insurance | 2 | $17B |
|
||
| Retail | 1 | $60B |
|
||
| Technology Distribution | 1 | $58B |
|
||
| Homebuilding | 1 | $35B |
|
||
| Technology Manufacturing | 1 | $35B |
|
||
Price history
+1265.7% since first listed10 events — show timeline
- 2026-04-07 Pending — Stellar MLS as Distributed by MLS Grid
- 2026-02-18 Price Changed $239,000 Stellar MLS as Distributed by MLS Grid
- 2026-01-18 Price Changed $249,000 Stellar MLS as Distributed by MLS Grid
- 2026-01-06 Relisted — Stellar MLS as Distributed by MLS Grid
- 2025-12-15 Pending — Stellar MLS as Distributed by MLS Grid
- 2025-11-22 Listed $269,000 Stellar MLS as Distributed by MLS Grid
- 2001-01-31 Sold (Public Records) $84,900 Public Records
- 2000-04-03 Sold (Public Records) $49,900 Public Records
- 1997-03-19 Sold (Public Records) $55,000 Public Records
- 1971-12-01 Sold (Public Records) $17,500 Public Records
Property tax history
+7.0%/yrLatest (2025): $1,987 · +81.2% YoY. Source: county tax records.
Cash-flow waterfall
monthlySold comps — $/sqft
last 12 mo · ≤1 miLoading sold comps…