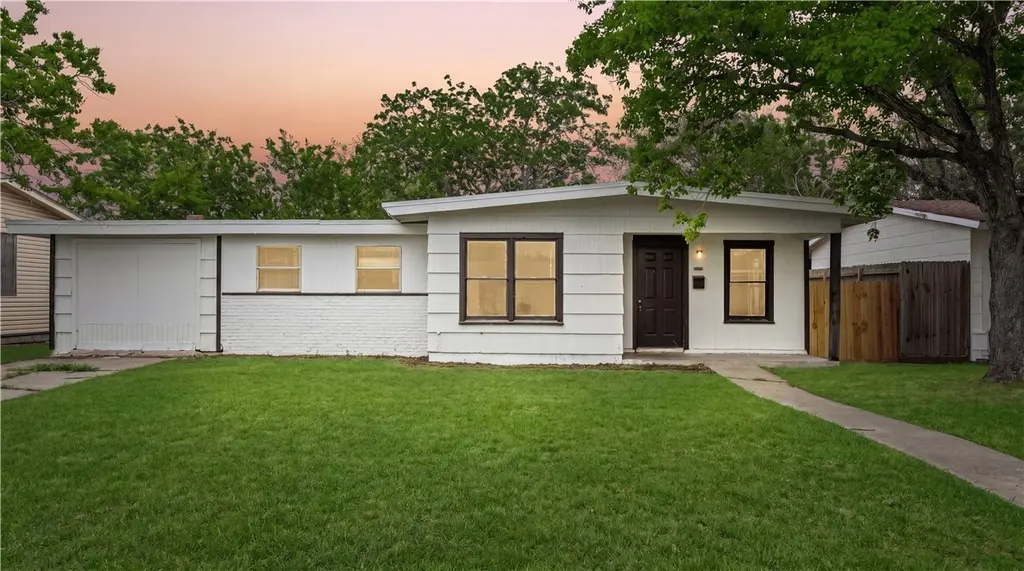
1506 Crosby St · Portland, TX
Flood risk 1/10 · Minimal
- FEMA flood zone
- X (unshaded)
- Chance of flooding over 30 yrs
- 0.0%
- Est. flood insurance / yr
- $507 – $1,088
Fire risk 1/10 · Minimal
- Est. fire insurance / yr
- $1,222 – $2,270
Heat risk 10/10 · Severe
- Hot days now (above 106°F)
- 7 days/yr
- Hot days in 30 yrs
- 28 days/yr
Wind risk 9/10 · Severe
- Chance of severe wind over 30 yrs
- 99.0%
Air-quality risk 1/10 · Minimal
- Unhealthy air days now
- 0 days/yr
- Unhealthy air days in 30 yrs
- 0 days/yr
Risk factors via First Street. Map © Google.
Why this score? — see what drove the C grade
The composite is a weighted blend of 9 inputs, each scored 0–100. Each bar is that input's sub-score; the figure is the points it added to the 100-point composite (weight × sub-score).
- Cash flow +24.2/30.0
- ARV discount +8.2/15.0
- DSCR +7.8/10.0
- 1% rule +6.9/10.0
- Livability +4.0/5.0
- Schools +3.7/10.0
- Condition / age +2.5/5.0
- Rent growth +2.0/5.0
- Appreciation +0.0/10.0
$169,900
🖨 Deal sheet 📄 Offer letter ✓ Due diligence
Listing remarks MLS
Welcome to 1506 Crosby in the growing city of Portland, TX! This recently renovated 3-bedroom, 1-bath home offers a fresh, clean feel with functional living space and tasteful updates throughout. Inside, you’ll find updated flooring, light and bright interior paint, refreshed fixtures, and an inviting layout designed for comfortable everyday living. The spacious living area provides plenty of room to relax or entertain, while the kitchen offers great workspace, updated finishes, and a practical flow into the main areas of the home. Each bedroom offers flexibility for family, guests, or even a home office setup. The bathroom has been updated to complement the home’s overall refreshed feel, making this property move-in ready for its next owner. Natural light flows throughout, helping each space feel open and welcoming. Step outside and enjoy one of the standout features of the property, the expansive backyard. Whether you envision weekend gatherings, play space, pets, a garden, or simply room to spread out, this oversized outdoor area offers endless potential. Mature trees provide shade and character, while the lot gives you the outdoor space that can be hard to find. Located in the growing community of Portland, this home offers convenient access to local schools, shopping, dining, and an easy commute to nearby employment centers. Whether you’re a first-time buyer, looking to downsize, or searching for an investment opportunity, 1506 Crosby presents a strong combination of updates, functionality, and value. Don’t miss your chance to own a recently renovated home with charm, usable space, and a large backyard in one of the Coastal Bend’s most steadily growing areas. Schedule your showing today!
Key facts
- Updated finishes
- Spacious living area
- Refreshed fixtures
Tags
Neighborhood map
What this means for you Summary
Snapshot
- This is a 4-bed/1.0-bath single-family listed at $170k.
Deal economics
- At list price, monthly cash flow is $340 ($4k/yr) — positive.
- The deal already cash-flows at list — no discount required.
- Meets the 1% rule at list price ($2k rent vs $170k).
- Recommended offer: $165k (3.0% below list) — sets the bar for market timing.
- Cap rate 8.7% vs local median 4.2% in Portland — top-decile yield for the area; either an underpriced asset or a hidden risk that comps aren't pricing in. Stress-test before assuming the spread holds.
Location & tenants
- Location reads 80/100 on livability (#36 in TX, #1,740 nationally) — a professional / high-income tenant draw. Strengths: employment A+, cost of living A+, housing A+; Watch: amenities F, commute F.
- Gregory-Portland ISD (suburban): math 41% / reading 42% proficiency, ranked #314 of 826 in TX (top 38%) — families likely to look elsewhere, expect single-tenant / working-renter base with shorter leases.
- Market conditions: Rents soft (-1.8%/yr); 302 active listings in the ZIP; 9 comparable units currently listed for rent nearby; rentals at typical pace (median 14d on market — plan ~3-4 weeks tenant-placement turnaround); solid renter incomes; 344 units permitted in San Patricio County in 2024 (0 in 5+ unit buildings).
Forward outlook
- Local home prices are declining (-3.0%/yr); year-one equity from $1k of loan paydown is wiped out by about $5k of value loss. Plan a longer hold.
- San Patricio County population projected at +27% by 2050 — long-run rental-demand tailwind backs the buy-and-hold thesis.
Negotiation context
- It's been on market 57 days — a 3% lower offer ($165k) is reasonable based on typical stale-listing flexibility.
- 2 sale attempts with the ask held roughly flat each time — persistent listings suggest the price (not the market) is what's stuck; bring a comps-based counter.
Risks & watch-outs
- Watch-outs: built in 1956 — expect roof / HVAC / electrical / plumbing capex.
- Climate carrying-cost: severe wind risk, 99% chance of damaging wind over 30y; extreme-heat days projected 7→28/yr by 2055 (HVAC capex compounding) — expect insurance premiums to compound above CPI over the hold.
Questions for the listing agent
- It's been on market 57 days. Have you received any prior offers? Is the seller open to a 3% concession, seller financing, or rate buy-down credit?
- Built in 1956 — when were the roof, HVAC, electrical panel, plumbing, and water heater last replaced?
- Is there a deadline driving the sale (1031 exchange, divorce, estate, relocation)? That informs how much negotiation room exists.
- What's the average days-on-market for RENTAL listings here right now (not sales)? A rising rental-DOM trend means longer vacancies and softer asking-rent achievability than the comps imply.
- What's the recent tenant-quality profile in this submarket — average credit score on applications, eviction rate, late-payment / NSF rate, and stable-employment percentage? A property-management company in the area should have these aggregated.
- How much new for-sale + rental construction is in the pipeline within 1–3 miles? Heavy new supply typically softens prices + rents 12–24 months out; constrained supply supports both.
Investment metrics
- 1% rule
- 1.19% ✓
- Cap rate
- 8.69%
- Cash-on-cash
- 8.56%
- DSCR
- 1.38
- GRM
- 7.0
CMA / ARV
- ARV (median comp)
- $172,655
- List price
- $169,900
- Delta
- -1.60%
- Verdict
- FAIR
- Comps
- 20 within 1.0 mi
Show comp detail 12 sales within ~0.75 mi
| Address | Dist | Beds/Ba | Sqft | Sold | Price | $/sf | Match |
|---|---|---|---|---|---|---|---|
| 110 Driftwood Dr | 0.15mi | 3/2.0 (-1) | 1,138 (-7%) | 2mo | $187,000 | $164 | 71 |
| 1607 Crosby St | 0.08mi | 3/1.5 (-1) | 1,084 (-11%) | 1mo | $190,000 | $175 | 70 |
| 1608 Crosby St | 0.07mi | 3/2.0 (-1) | 1,316 (+8%) | 8mo | $199,900 | $152 | 68 |
| 1721 Austin St | 0.25mi | 3/2.0 (-1) | 1,151 (-6%) | 3mo | $150,000 | $130 | 68 |
| 118 Carmel Dr | 0.18mi | 3/2.0 (-1) | 1,306 (+7%) | 4mo | $239,000 | $183 | 67 |
| 106 Westover Dr | 0.33mi | 3/2.0 (-1) | 1,282 (+5%) | 1mo | $210,000 | $164 | 67 |
| 1226 Euclid Cir | 0.21mi | 3/1.5 (-1) | 1,150 (-6%) | 10mo | $185,000 | $161 | 65 |
| 1403 Austin St | 0.11mi | 3/1.5 (-1) | 1,083 (-11%) | 11mo | $160,000 | $148 | 60 |
| 1115 Orion Dr | 0.43mi | 3/2.0 (-1) | 1,184 (-3%) | 8mo | $229,500 | $194 | 60 |
| 1014 Espana Dr | 0.52mi | 3/2.0 (-1) | 1,333 (+9%) | 3mo | $209,900 | $157 | 49 |
| 123 Catalina | 0.36mi | 3/2.0 (-1) | 1,384 (+13%) | 6mo | $225,000 | $163 | 47 |
| 1011 Diomede Dr | 0.49mi | 3/2.0 (-1) | 1,134 (-7%) | 11mo | $199,900 | $176 | 47 |
Match score weights: distance 35% · size 25% · config 20% · recency 20%. Top-matched comps best support the ARV.
Projected returns pro-forma
-3.0% appreciation · 0.0% rent growth · sell at horizon
- IRR
- -6.9%
- Equity multiple
- 0.75×
- Total profit
- $-11,742
- Equity at exit
- $25,333
- IRR
- -1.8%
- Equity multiple
- 0.90×
- Total profit
- $-4,920
- Equity at exit
- $14,690
Cash invested: $47,572 (down + closing). Projections, not guarantees.
Landlord ↔ Tenant lean methodology
- Overall (STATE)
- 87 Strongly Landlord-Friendly
- State Texas
- 87 Strongly Landlord-Friendly · R+5
- County
- — inherits STATE
- City
- — inherits STATE
ZIP-level market 78374
- Rents YoY
- -1.8%
- Active inventory
- 302
- Price-to-rent
- 7.0×
Monthly cashflow live
- Estimated rent
- $2,019 high interval (Pro) →
- Mortgage (P&I)
- −$891
- Tax from tax record
- −$294 /mo · $3,526/yr
- Insurance
- −$71
- HOA
- −$0
- Vacancy / Maint / Mgmt
- −$424
- Net cashflow
- $340
Break-even live
UW: 25.0% down · 7.5% · 30yr · 1.5% tax · 5.0% vac · 8.0% maint · 8.0% mgmt
Financing live
Cash to close
- Down payment
- $42,475
- Closing costs
- $5,097
- Reserves months
- —
- Total cash needed
- —
Loan-product check · same deal, 3 products live
Conventional
25% down · 7.5% · 30yr
- Down + closing
- —
- Monthly P&I
- —
- Monthly cashflow
- —
- DSCR
- —
- Eligible?
- —
Personal DTI + credit; lowest rate.
DSCR
20% down · 8.5% · 30yr
- Down + closing
- —
- Monthly P&I
- —
- Monthly cashflow
- —
- DSCR
- —
- Eligible?
- —
No personal income docs; deal must DSCR.
Hard money
10% down · 12.0% · 12mo
- Down + closing
- —
- Monthly P&I
- —
- Monthly cashflow
- —
- DSCR
- —
- Eligible?
- —
Short-term bridge; refi at stabilization.
Rent comps 9 comps
| Address | Beds | Baths | Sqft | Rent | $/sqft | DOM | Units | Dist |
|---|---|---|---|---|---|---|---|---|
| 1719 Austin St Portland, TX | 3.0 | 1.5 | 1127 | $1,550 | $1.38 | 44d | 1 | 0.26mi |
| 1028 Starlite Dr Portland, TX | 3.0 | 1.5 | 984 | $1,450 | $1.47 | 21d | 1 | 0.36mi |
| 1012 Memorial Pkwy Portland, TX | 3.0 | 2.0 | 1409 | $1,850 | $1.31 | 44d | 1 | 0.46mi |
| 2201 Timberline Dr Unit Na Portland, TX | 4.0 | 2.0 | 1484 | $2,200 | $1.48 | 14d | 1 | 0.48mi |
| 1201 Moore Ave Portland, TX | 3.0 | 1.0–2.0 | 844 | $1,685 | $2.00 | 13d | 25 | 0.60mi |
| 101 Terlingua Dr Portland, TX | 3.0 | 2.0 | 1367 | $1,995 | $1.46 | 14d | 1 | 0.64mi |
| 1825 Billy G Webb Portland, TX | 1.0–3.0 | 1.0–2.0 | 1009 | $1,983 | $1.97 | 13d | 32 | 0.73mi |
| 544 Olympic Portland, TX | 1.0–3.0 | 1.0–2.5 | 1079 | $2,825 | $2.62 | 13d | 8 | 0.85mi |
| 1601 Moore Ave Portland, TX | 2.0–3.0 | 2.0–2.5 | 1295 | $1,899 | $1.47 | 13d | 18 | 0.89mi |
Listing history 25 events
-
2026-06-18days on market $169,900 Active 57 DOM
-
2026-06-17days on market $169,900 Active 56 DOM
-
2026-06-16days on market $169,900 Active 55 DOM
-
2026-06-15days on market $169,900 Active 54 DOM
-
2026-06-14days on market $169,900 Active 52 DOM
-
2026-06-13days on market $169,900 Active 51 DOM
-
2026-06-10days on market $169,900 Active 49 DOM
-
2026-06-09days on market $169,900 Active 48 DOM
-
2026-06-08days on market $169,900 Active 47 DOM
-
2026-06-07days on market $169,900 Active 46 DOM
-
2026-06-03days on market $169,900 Active 42 DOM
-
2026-06-02days on market $169,900 Active 41 DOM
-
2026-06-01days on market $169,900 Active 40 DOM
-
2026-05-31days on market $169,900 Active 39 DOM
-
2026-05-30days on market $169,900 Active 38 DOM
-
2026-04-24historical $1,575
-
2026-04-22$175,000 Active 1751-char remark
Show marketing remark (1751 chars)
Welcome to 1506 Crosby in the growing city of Portland, TX! This recently renovated 3-bedroom, 1-bath home offers a fresh, clean feel with functional living space and tasteful updates throughout. Inside, you’ll find updated flooring, light and bright interior paint, refreshed fixtures, and an inviting layout designed for comfortable everyday living. The spacious living area provides plenty of room to relax or entertain, while the kitchen offers great workspace, updated finishes, and a practical flow into the main areas of the home. Each bedroom offers flexibility for family, guests, or even a home office setup. The bathroom has been updated to complement the home’s overall refreshed feel, making this property move-in ready for its next owner. Natural light flows throughout, helping each space feel open and welcoming. Step outside and enjoy one of the standout features of the property, the expansive backyard. Whether you envision weekend gatherings, play space, pets, a garden, or simply room to spread out, this oversized outdoor area offers endless potential. Mature trees provide shade and character, while the lot gives you the outdoor space that can be hard to find. Located in the growing community of Portland, this home offers convenient access to local schools, shopping, dining, and an easy commute to nearby employment centers. Whether you’re a first-time buyer, looking to downsize, or searching for an investment opportunity, 1506 Crosby presents a strong combination of updates, functionality, and value. Don’t miss your chance to own a recently renovated home with charm, usable space, and a large backyard in one of the Coastal Bend’s most steadily growing areas. Schedule your showing today!
-
2026-04-11price $1,575
-
2026-03-26price $1,600
-
2026-03-18$1,700
-
2025-06-06soldstatus
-
2025-06-06soldstatus
-
2025-05-19soldstatus
-
2015-09-18soldstatus
-
1992-02-21soldstatus
ⓘ Source: listings_history table (triggers on properties + properties_extension) + one-shot
backfill from property_details.listing_events for pre-trigger history.
Tax reassessment forecast TX · Resets to sale price
- Current annual tax
- $3,526 · $294/mo
- Projected year-2 tax
- $3,526 · $294/mo
- Expected delta
- $0/yr ($0/mo · 0.0%)
ⓘ Screening estimate from a state-policy table — verify with the county assessor before closing.
Climate risk First Street
- Flood 1/10 Low FEMA zone X (unshaded) · 0% chance over 30 yrs
- Wildfire 1/10 Low
- Heat 10/10 Extreme 7 d/yr ≥106°F today · 28 d/yr by 30 yrs out
- Wind 9/10 Extreme 99% chance of damaging wind over 30 yrs
- Air quality 1/10 Low 0 unhealthy d/yr today · 0 by 30 yrs out
Nearby sold comps map
Loading sold comps map…
Walkable amenities ~0.75 mi
Loading nearby amenities…
Taxation est. · year 1
- Rental income
- $24,230
- − Mortgage interest
- −$9,517
- − Property taxes
- −$3,526
- − Insurance
- −$850
- − Repairs & maintenance
- −$1,938
- − Management
- −$1,938
- − Depreciation
- −$4,943
- Taxable income
- $1,518
- Est. tax owed @ 24.0%
- −$364
- After-tax cash flow
- $3,710/yr
For passive investors: Depreciation is non-cash, so a rental often shows a tax loss while cash-flowing — sheltering income. Rental losses are passive: they offset passive income freely, and up to $25,000/yr can offset ordinary (W-2) income if you actively participate and your MAGI is under $100k (phasing out to $0 by $150k); unused losses carry forward. On sale, claimed depreciation is recaptured at up to 25%, and gains may owe capital-gains tax (a 1031 exchange can defer both). Figures are a year-1 estimate at your 24.0% rate — not tax advice; consult a CPA.
Schools (NCES district)
- District
- Gregory-Portland ISD
- NCES district ID
- 4821780
- Math proficiency
- 41% ▼ -15.00%
- Reading proficiency
- 42% ▼ -9.00%
- Median HH income
- $59,135
- Composite
- 36.62/100
- National rank
- #4622
- State rank
- #314 of 826 in TX
Livability — Portland
- Score
- 80/100
- State rank
- #36
- US rank
- #1740
Category grades
Schools grade is shown separately in the Schools card above.
Census & demographics
- Census place
- Portland, TX
- County
- San Patricio County · 31,224 people
- City population
- 20,408
- Metro
- Corpus Christi, TX
- Population (ZIP)
- 20,408
- Household income
- $83,504
- Rent vs Own
- Severe rent burden
- 523.0
Population outlook (San Patricio County) Hauer SSP2
- Today (2025)
- 75,538 people
- By 2030
- 79,575 · +5.3%
- By 2040
- 87,670 · +16.1%
- By 2050
- 96,107 · +27.2%
- By 2075
- 117,984 · +56.2%
- By 2100
- 130,010 · +72.1%
Race, ethnicity, and origin ACS 2023
- Neighborhood character
- Diverse neighborhood (Simpson 0.57)
- Race & ethnicity
- White 51% Hispanic / Latino 41% Two or more races 19% Asian 2% Black 2%
- Hispanic origin (detail)
- Mexican 35% Cuban 2%
- Common ancestry
- Lithuanian 2% Slovak 2% Estonian 1%
- Foreign-born
- 7% · Canada
- Languages at home
- 79% English-only · Spanish 18% Other Indo-European 2% Tagalog/Filipino 0%
Political lean MEDSL · San Patricio
- 2024 margin
- Solid R (+36.4) · D 31.4% · R 67.8%
- 2008→2024 swing
- -19.8pp toward R · 2008: -16.6pp · 2024: -36.4pp
- All cycles
- 2024: R+36.4 2020: R+29.1 2016: R+24.1 2012: R+20.6 2008: R+16.6
Not yet ingested
- Civics
- —
Market trends
- HPI YoY
- ▼ -227.28%
- Current HPI
- 166.5529
- Rent YoY
- ▼ -1.84%
- Metro
- Corpus Christi, TX
- State GDP YoY
- ▲ 3.95%
- F500 in state
- 110
Industry mix (Fortune 500 HQ in TX)
| Industry | F500 HQs | Revenue |
|---|---|---|
| Energy | 16 | $1,198B |
|
||
| Technology | 5 | $198B |
|
||
| Engineering / Construction | 4 | $72B |
|
||
| Energy Services | 3 | $60B |
|
||
| Utilities | 3 | $41B |
|
||
| Healthcare | 2 | $330B |
|
||
Price history
-7.4% since first listed10 events — show timeline
- 2026-04-24 Rental Removed $1,575 TENANTTURNER2
- 2026-04-22 Listed $175,000 CBMLS
- 2026-04-11 Price Changed $1,575 TENANTTURNER2
- 2026-03-26 Price Changed $1,600 TENANTTURNER2
- 2026-03-18 Listed for Rent $1,700 TENANTTURNER2
- 2025-06-06 Sold (Public Records) — Public Records
- 2025-06-06 Sold (Public Records) — Public Records
- 2025-05-19 Sold (Public Records) — Public Records
- 2015-09-18 Sold (Public Records) — Public Records
- 1992-02-21 Sold (Public Records) — Public Records
Property tax history
+6.2%/yrLatest (2025): $3,526 · -1.2% YoY. Source: county tax records.
Cash-flow waterfall
monthlySold comps — $/sqft
last 12 mo · ≤1 miLoading sold comps…