4015 Prospect Ave · Kansas City, MO
Flood risk 1/10 · Minimal
- FEMA flood zone
- X (unshaded)
- Chance of flooding over 30 yrs
- 0.0%
- Est. flood insurance / yr
- $507 – $1,088
Fire risk 1/10 · Minimal
- Est. fire insurance / yr
- $1,054 – $1,958
Heat risk 4/10 · Minor
- Hot days now (above 107°F)
- 7 days/yr
- Hot days in 30 yrs
- 17 days/yr
Wind risk 2/10 · Minimal
- Chance of severe wind over 30 yrs
- —
Air-quality risk 3/10 · Minor
- Unhealthy air days now
- 2 days/yr
- Unhealthy air days in 30 yrs
- 3 days/yr
Risk factors via First Street. Map © Google.
Why this score? — see what drove the D grade
The composite is a weighted blend of 9 inputs, each scored 0–100. Each bar is that input's sub-score; the figure is the points it added to the 100-point composite (weight × sub-score).
- Cash flow +15.0/30.0
- ARV discount +7.5/15.0
- 1% rule +5.0/10.0
- DSCR +5.0/10.0
- Livability +3.9/5.0
- Rent growth +3.6/5.0
- Condition / age +2.5/5.0
- Schools +1.5/10.0
- Appreciation +0.0/10.0
$29,900
🖨 Deal sheet 📄 Offer letter ✓ Due diligence
Listing remarks MLS
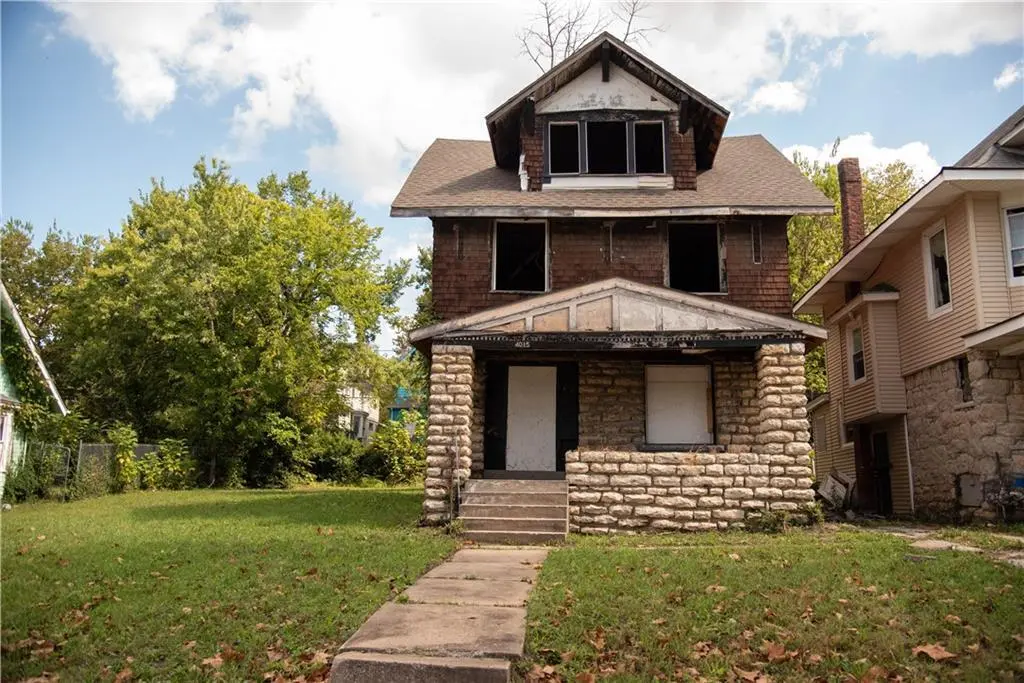
Investor Special Full Rehab Opportunity at 4015 Prospect, Kansas City, MO. This two story home on double lot is in nearly fully gutted condition and will require extensive repairs and updates throughout. Ideal for experienced investors, builders, or contractors ready to take on a full scale project. Historically, the property was listed as a 4 bedroom, 2 bathroom home in 2005, offering insight into its potential layout and expansion possibilities. With approximately 1,800+ square feet, there is opportunity to reconfigure and maximize bedroom and bathroom count. Situated on a deep city lot with alley access on Kansas City’s revitalizing east side, this property presents strong upside for a fix and flip, long term rental, or full renovation project. Bring your vision and creativity. This is a true blank slate ready to be transformed on a large double lot.
Key facts
- Alley access
- Blank slate
- Double lot
Tags
Neighborhood map
What this means for you Summary
Snapshot
- This is a 6-bed/2.0-bath single-family listed at $30k.
Deal economics
- At list price, monthly cash flow is $2k ($19k/yr) — positive.
- The deal already cash-flows at list — no discount required.
- Meets the 1% rule at list price ($2k rent vs $30k).
- Recommended offer: $28k (6.0% below list) — sets the bar for market timing.
- Cap rate 69.1% vs local median 3.9% in Kansas City — top-decile yield for the area; either an underpriced asset or a hidden risk that comps aren't pricing in. Stress-test before assuming the spread holds.
Location & tenants
- Location reads 78/100 on livability (#28 in MO, #2,671 nationally) — a middle-class / working-renter tenant base. Strengths: amenities A+, commute A+, cost of living A+; Watch: schools C-, crime F.
- Kansas City 33 (urban): math 12% / reading 24% proficiency, ranked #308 of 324 in MO (top 95%) — low school quality limits family demand, transient renter base, plan for 1-2y turnover; 75% free/reduced lunch — lower-income household profile, screen leases tightly.
- Market conditions: Rents rising fast (+4.4%/yr); 187 active listings in the ZIP; 2 comparable units currently listed for rent nearby; lower-income renter base — watch delinquency; 4,002 units permitted in Jackson County in 2024 (2,271 in 5+ unit buildings).
- At $2,231/mo this rent would consume 63% of the median local household income ($42k/yr) (locally 1132% of renters already pay >50% of income on rent) — very limited rent-growth headroom before tenants either downsize or default.
Forward outlook
- Local home prices are declining (-3.0%/yr); year-one equity from $207 of loan paydown is wiped out by about $897 of value loss. Plan a longer hold.
- Jackson County population projected at +4% by 2050 — modest demand growth; plan on rents tracking national, not racing it.
- At projected returns (-3.0% appreciation + 4.4% rent growth), your $8k cash investment doubles in ~1 year — after that, you're playing with house money.
Negotiation context
- It's been on market 84 days — a 6% lower offer ($28k) is reasonable based on typical stale-listing flexibility.
- 2 sale attempts since 21y ago; this cycle's ask has dropped $5k (15%) from the opening price — seller is motivated, your offer sets the floor, not the list.
Risks & watch-outs
- Watch-outs: built in 1910 — expect roof / HVAC / electrical / plumbing capex.
Questions for the listing agent
- It's been on market 84 days. Have you received any prior offers? Is the seller open to a 6% concession, seller financing, or rate buy-down credit?
- Built in 1910 — when were the roof, HVAC, electrical panel, plumbing, and water heater last replaced?
- Why hasn't it sold? Are there any deal-killer items the seller is aware of (foundation, flood, title, zoning, code violations)?
- Is there a deadline driving the sale (1031 exchange, divorce, estate, relocation)? That informs how much negotiation room exists.
- Crime grade is F in this area — have there been break-ins, vandalism, or insurance claims at this property in the last 3 years? What carrier currently insures it and at what premium?
- The area grade is low — what's the realistic commute time and amenity access for the typical tenant pool here? Any planned neighborhood developments (good or bad) we should know about?
- What's the average days-on-market for RENTAL listings here right now (not sales)? A rising rental-DOM trend means longer vacancies and softer asking-rent achievability than the comps imply.
- What's the recent tenant-quality profile in this submarket — average credit score on applications, eviction rate, late-payment / NSF rate, and stable-employment percentage? A property-management company in the area should have these aggregated.
- How much new for-sale + rental construction is in the pipeline within 1–3 miles? Heavy new supply typically softens prices + rents 12–24 months out; constrained supply supports both.
Investment metrics
- 1% rule
- 7.46% ✓
- Cap rate
- 69.13%
- Cash-on-cash
- 224.43%
- DSCR
- 10.99
- GRM
- 1.1
CMA / ARV
- ARV (median comp)
- $157,960
- List price
- $29,900
- Delta
- -81.07%
- Verdict
- UNDERPRICED
- Comps
- 20 within 1.0 mi
Show comp detail 5 sales within ~0.75 mi
| Address | Dist | Beds/Ba | Sqft | Sold | Price | $/sf | Match |
|---|---|---|---|---|---|---|---|
| 4332 Benton Blvd | 0.53mi | 5/2.5 (-1) | 1,826 (-1%) | 13mo | $119,900 | $66 | 56 |
| 4531 Park Ave | 0.68mi | 5/2.0 (-1) | 1,823 (-1%) | 18mo | $59,900 | $33 | 47 |
| 4429 Wabash Ave | 0.53mi | 5/2.0 (-1) | 1,600 (-13%) | 8mo | $140,000 | $88 | 42 |
| 3430 Wabash Ave | 0.72mi | 6/5.5 | 1,975 (+8%) | 13mo | $215,000 | $109 | 29 |
| 2804 E 35th St | 0.70mi | 5/2.0 (-1) | 1,600 (-13%) | 18mo | $105,000 | $66 | 26 |
Match score weights: distance 35% · size 25% · config 20% · recency 20%. Top-matched comps best support the ARV.
Projected returns pro-forma
-3.0% appreciation · 4.42% rent growth · sell at horizon
- IRR
- —
- Equity multiple
- 12.72×
- Total profit
- $98,138
- Equity at exit
- $4,458
- IRR
- —
- Equity multiple
- 28.19×
- Total profit
- $227,632
- Equity at exit
- $2,585
Cash invested: $8,372 (down + closing). Projections, not guarantees.
Landlord ↔ Tenant lean methodology
- Overall (STATE)
- 81 Strongly Landlord-Friendly
- State Missouri
- 81 Strongly Landlord-Friendly · R+10
- County
- — inherits STATE
- City
- — inherits STATE
ZIP-level market 64130
- Home prices YoY
- -21.5%
- Rents YoY
- 4.4%
- Active inventory
- 187
- Price-to-rent
- 1.1×
Monthly cashflow live
- Estimated rent
- $2,231 medium interval (Pro) →
- Mortgage (P&I)
- −$157
- Tax from tax record
- −$27 /mo · $328/yr
- Insurance
- −$12
- HOA
- −$0
- Vacancy / Maint / Mgmt
- −$468
- Net cashflow
- $1,566
Break-even live
UW: 25.0% down · 7.5% · 30yr · 1.5% tax · 5.0% vac · 8.0% maint · 8.0% mgmt
Financing live
Cash to close
- Down payment
- $7,475
- Closing costs
- $897
- Reserves months
- —
- Total cash needed
- —
Loan-product check · same deal, 3 products live
Conventional
25% down · 7.5% · 30yr
- Down + closing
- —
- Monthly P&I
- —
- Monthly cashflow
- —
- DSCR
- —
- Eligible?
- —
Personal DTI + credit; lowest rate.
DSCR
20% down · 8.5% · 30yr
- Down + closing
- —
- Monthly P&I
- —
- Monthly cashflow
- —
- DSCR
- —
- Eligible?
- —
No personal income docs; deal must DSCR.
Hard money
10% down · 12.0% · 12mo
- Down + closing
- —
- Monthly P&I
- —
- Monthly cashflow
- —
- DSCR
- —
- Eligible?
- —
Short-term bridge; refi at stabilization.
Rent comps 2 comps
| Address | Beds | Baths | Sqft | Rent | $/sqft | DOM | Units | Dist |
|---|---|---|---|---|---|---|---|---|
| 4440 Troost Ave Kansas City, MO | 5.0 | 2.0 | 2400 | $2,250 | $0.94 | 43d | 1 | 1.19mi |
| 4444 Troost Ave Kansas City, MO | 5.0 | 2.0 | 2400 | $2,250 | $0.94 | 43d | 1 | 1.19mi |
Listing history 4 events
-
2026-04-09price $29,900 871-char remark
Show marketing remark (871 chars)
Investor Special Full Rehab Opportunity at 4015 Prospect, Kansas City, MO. This two story home on double lot is in nearly fully gutted condition and will require extensive repairs and updates throughout. Ideal for experienced investors, builders, or contractors ready to take on a full scale project. Historically, the property was listed as a 4 bedroom, 2 bathroom home in 2005, offering insight into its potential layout and expansion possibilities. With approximately 1,800+ square feet, there is opportunity to reconfigure and maximize bedroom and bathroom count. Situated on a deep city lot with alley access on Kansas City’s revitalizing east side, this property presents strong upside for a fix and flip, long term rental, or full renovation project. Bring your vision and creativity. This is a true blank slate ready to be transformed on a large double lot.
-
2026-03-02$35,000 Active 871-char remark
Show marketing remark (871 chars)
Investor Special Full Rehab Opportunity at 4015 Prospect, Kansas City, MO. This two story home on double lot is in nearly fully gutted condition and will require extensive repairs and updates throughout. Ideal for experienced investors, builders, or contractors ready to take on a full scale project. Historically, the property was listed as a 4 bedroom, 2 bathroom home in 2005, offering insight into its potential layout and expansion possibilities. With approximately 1,800+ square feet, there is opportunity to reconfigure and maximize bedroom and bathroom count. Situated on a deep city lot with alley access on Kansas City’s revitalizing east side, this property presents strong upside for a fix and flip, long term rental, or full renovation project. Bring your vision and creativity. This is a true blank slate ready to be transformed on a large double lot.
-
2006-06-09soldstatus 139-char remark
Show marketing remark (139 chars)
Corporate Owned. Selling "As Is". No Seller's Disclosure. Proof of funds or preapproval letter must be submitted with all offers.
-
2005-09-20$11,900 139-char remark
Show marketing remark (139 chars)
Corporate Owned. Selling "As Is". No Seller's Disclosure. Proof of funds or preapproval letter must be submitted with all offers.
ⓘ Source: listings_history table (triggers on properties + properties_extension) + one-shot
backfill from property_details.listing_events for pre-trigger history.
Tax reassessment forecast MO · Resets to sale price
- Current annual tax
- $328 · $27/mo
- Projected year-2 tax
- $328 · $27/mo
- Expected delta
- $0/yr ($0/mo · 0.0%)
ⓘ Screening estimate from a state-policy table — verify with the county assessor before closing.
Climate risk First Street
- Flood 1/10 Low FEMA zone X (unshaded) · 0% chance over 30 yrs
- Wildfire 1/10 Low
- Heat 4/10 Moderate 7 d/yr ≥107°F today · 17 d/yr by 30 yrs out
- Wind 2/10 Low
- Air quality 3/10 Moderate 2 unhealthy d/yr today · 3 by 30 yrs out
Nearby sold comps map
Loading sold comps map…
Walkable amenities ~0.75 mi
Loading nearby amenities…
Taxation est. · year 1
- Rental income
- $26,770
- − Mortgage interest
- −$1,675
- − Property taxes
- −$328
- − Insurance
- −$150
- − Repairs & maintenance
- −$2,142
- − Management
- −$2,142
- − Depreciation
- −$870
- Taxable income
- $19,464
- Est. tax owed @ 24.0%
- −$4,671
- After-tax cash flow
- $14,118/yr
For passive investors: Depreciation is non-cash, so a rental often shows a tax loss while cash-flowing — sheltering income. Rental losses are passive: they offset passive income freely, and up to $25,000/yr can offset ordinary (W-2) income if you actively participate and your MAGI is under $100k (phasing out to $0 by $150k); unused losses carry forward. On sale, claimed depreciation is recaptured at up to 25%, and gains may owe capital-gains tax (a 1031 exchange can defer both). Figures are a year-1 estimate at your 24.0% rate — not tax advice; consult a CPA.
Schools (NCES district)
- District
- Kansas City 33
- NCES district ID
- 2916400
- Math proficiency
- 12% ▼ -8.00%
- Reading proficiency
- 24% ▬ 0.00%
- Median HH income
- $35,227
- Composite
- 14.8/100
- National rank
- #9387
- State rank
- #308 of 324 in MO
Livability — Kansas City
- Score
- 78/100
- State rank
- #28
- US rank
- #2671
Category grades
Schools grade is shown separately in the Schools card above.
Census & demographics
- Census place
- Kansas City, MO
- County
- Jackson County · 687,798 people
- City population
- 439,467
- Metro
- Kansas City, MO-KS
- Population (ZIP)
- 19,644
- Household income
- $42,221
- Rent vs Own
- Severe rent burden
- 1132.0
Population outlook (Jackson County) Hauer SSP2
- Today (2025)
- 719,589 people
- By 2030
- 731,456 · +1.6%
- By 2040
- 746,689 · +3.8%
- By 2050
- 749,289 · +4.1%
- By 2075
- 736,227 · +2.3%
- By 2100
- 668,210 · -7.1%
Race, ethnicity, and origin ACS 2023
- Neighborhood character
- Predominantly Black (80%)
- Race & ethnicity
- Black 80% White 9% Hispanic / Latino 8% Two or more races 6%
- Hispanic origin (detail)
- Mexican 5%
- Common ancestry
- Lithuanian 1% Swedish 0%
- Foreign-born
- 6% · Canada
- Languages at home
- 92% English-only · Spanish 7%
Political lean MEDSL · Jackson
- 2024 margin
- D (+19.3) · D 58.9% · R 39.5% · Other 1.6%
- 2008→2024 swing
- -6.1pp toward R · 2008: 25.4pp · 2024: 19.3pp
- All cycles
- 2024: D+19.3 2020: D+22.0 2016: D+16.6 2012: D+19.0 2008: D+25.4
Not yet ingested
- Civics
- —
Market trends
- HPI YoY
- ▼ -73.32%
- Current HPI
- 267.491
- Rent YoY
- ▲ 4.42%
- Metro
- Kansas City, MO-KS
- State GDP YoY
- ▲ 1.84%
- F500 in state
- 20
Industry mix (Fortune 500 HQ in MO)
| Industry | F500 HQs | Revenue |
|---|---|---|
| Healthcare | 1 | $163B |
|
||
| Insurance | 1 | $21B |
|
||
| Industrial Technology | 1 | $17B |
|
||
| Retail | 1 | $16B |
|
||
| Industrial Distribution | 1 | $10B |
|
||
| Utilities | 1 | $9B |
|
||
Price history
+151.3% since first listed4 events — show timeline
- 2026-04-09 Price Changed $29,900 Heartland MLS as Distributed by MLS Grid
- 2026-03-02 Listed $35,000 Heartland MLS as Distributed by MLS Grid
- 2006-06-09 Sold (MLS) — Heartland MLS as Distributed by MLS Grid
- 2005-09-20 Listed $11,900 Heartland MLS as Distributed by MLS Grid
Property tax history
+1.4%/yrLatest (2020): $328 · +2.1% YoY. Source: county tax records.
Cash-flow waterfall
monthlySold comps — $/sqft
last 12 mo · ≤1 miLoading sold comps…