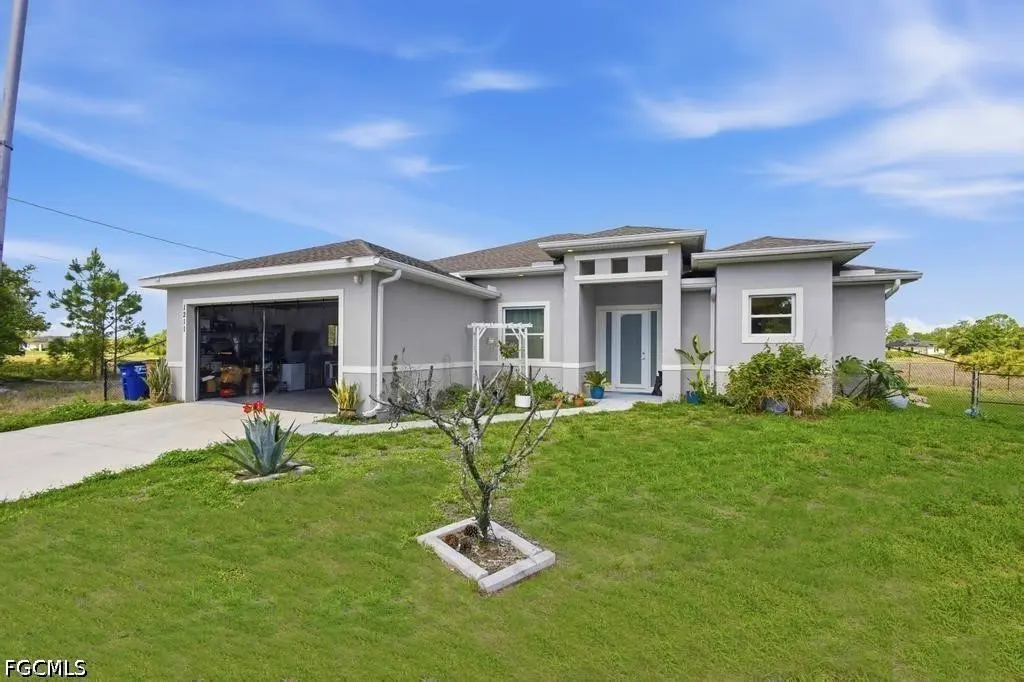
1211 Eclat St E · Lehigh Acres, FL
Flood risk 5/10 · Moderate
- FEMA flood zone
- X (unshaded)
- Chance of flooding over 30 yrs
- 0.66%
- Est. flood insurance / yr
- $507 – $1,088
Fire risk 2/10 · Minimal
- Est. fire insurance / yr
- $947 – $1,759
Heat risk 9/10 · Severe
- Hot days now (above 109°F)
- 7 days/yr
- Hot days in 30 yrs
- 27 days/yr
Wind risk 10/10 · Severe
- Chance of severe wind over 30 yrs
- 99.0%
Air-quality risk 2/10 · Minimal
- Unhealthy air days now
- 1 days/yr
- Unhealthy air days in 30 yrs
- 2 days/yr
Risk factors via First Street. Map © Google.
Why this score? — see what drove the D grade
The composite is a weighted blend of 9 inputs, each scored 0–100. Each bar is that input's sub-score; the figure is the points it added to the 100-point composite (weight × sub-score).
- ARV discount +12.5/15.0
- Appreciation +10.0/10.0
- Cash flow +7.4/30.0
- Schools +4.1/10.0
- Livability +3.0/5.0
- Condition / age +2.5/5.0
- DSCR +1.6/10.0
- 1% rule +1.4/10.0
- Rent growth +1.3/5.0
$324,500
🖨 Deal sheet 📄 Offer letter ✓ Due diligence
Listing remarks
Take advantage of a rare opportunity to secure a low 3.125% interest rate through an assumable loan in the growing community of Lehigh Acres. In today's higher-rate market, this home offers significant monthly savings by allowing qualified buyers to step into the seller's existing mortgage, potentially saving hundreds compared to current financing options. Don't miss your chance to lock in yesterday's rate in today's market Call Listing Agent for Instructions, Showing schedule Monday to Friday 9am till 6PM, Weekends available upon request of availability.
Key facts
- 0.42 acre lot
- 2 garage spots
- Built 2020
Property features AI
Finance
- Other: Lot is approximately a quarter to half acre; City street frontage; Paved road access; Zoning: RS-1
Exterior
- Parking: 2-car garage; Driveway; RV access/parking; Garage door opener
- Security: Smoke detectors; Security/high-impact doors
- Utilities: Well water; Septic tank
- Home design: Single-story home; Resale property; Faces north; Raised foundation
- Construction: Block and stucco construction; Shingle roof
- Exterior features: Deck; Open patio; Porch; Fenced yard; Room for pool; Security/high-impact doors; Sprinkler system (automatic)
Interior
- Kitchen: Electric range; Microwave; Dishwasher; Refrigerator; Pantry
- Bedrooms: Includes den (flex room); Includes family room
- Flooring: Tile flooring
- Bathrooms: 2 full bathrooms
- Heating & cooling: Central air conditioning; Central heating; Wall furnace
- Interior features: French doors; Breakfast area; Dual sinks; Atrium/French-style doors; First-floor entry; Combined living/dining room; Pantry; Vaulted ceilings; Walk-in closets
- Laundry & utility: Washer hookup; Dryer hookup; Washer included; Dryer included; Electric water heater; Owned water softener
Neighborhood map
What this means for you Summary
Snapshot
- This is a 3-bed/2.0-bath single-family listed at $324k.
Deal economics
- At list price, monthly cash flow is $-411 ($-5k/yr) — negative.
- To cash-flow at today's rent, offer at most $252k (22.4% below list).
- To meet the 1% rule (rent ≥ 1% of price), the offer needs to be $208k (35.9% below list).
- Recommended offer: $208k (35.9% below list) — sets the bar for 1% rule.
Location & tenants
- Location reads 59/100 on livability (#826 in FL) — a working-class tenant base; expect higher turnover. Strengths: cost of living A+, housing A+; Watch: crime C-, employment D+, schools D-.
- Lee (suburban): math 47% / reading 50% proficiency, ranked #42 of 73 in FL (top 58%) — families likely to look elsewhere, expect single-tenant / working-renter base with shorter leases.
- Market conditions: Rents falling (-4.7%/yr); 2460 active listings in the ZIP; 25 comparable units currently listed for rent nearby; rentals leasing fast (median 12d on market — plan ~1-2 weeks tenant-placement turnaround); 15,411 units permitted in Lee County in 2024 (4,686 in 5+ unit buildings).
- This rent runs 35% of the median local income ($72k/yr) — at the standard rent-burdened threshold; future hikes will face affordability resistance.
Forward outlook
- In year one you build about $35k of equity ($2k loan paydown + $32k appreciation (10.0% local appreciation)).
- Lee County population projected at +44% by 2050 — long-run rental-demand tailwind backs the buy-and-hold thesis.
- By year 2, paydown + projected appreciation supports a ~$56k cash-out refi (75% LTV) — recoverable capital for the next deal without selling this one.
Negotiation context
- It's been on market 45 days — a 3% lower offer ($315k) is reasonable based on typical stale-listing flexibility.
- 5 sale attempts since 20y ago with the ask held roughly flat each time — persistent listings suggest the price (not the market) is what's stuck; bring a comps-based counter.
- Current owner paid $250k; 30% above their basis — modest negotiation headroom, anchor on the comps not their cost.
Risks & watch-outs
- Climate carrying-cost: moderate flood risk; severe wind risk, 99% chance of damaging wind over 30y; extreme-heat days projected 7→27/yr by 2055 (HVAC capex compounding) — expect insurance premiums to compound above CPI over the hold.
Questions for the listing agent
- What do current leases actually rent for vs. the listed asking? Can we see a recent rent roll and the last 12 months of T-12 income?
- It's been on market 45 days. Have you received any prior offers? Is the seller open to a 36% concession, seller financing, or rate buy-down credit?
- Is there a deadline driving the sale (1031 exchange, divorce, estate, relocation)? That informs how much negotiation room exists.
- Schools are D-rated, which usually means shorter tenancies and higher turnover. Who's the typical renter profile here, and what's been the actual vacancy rate?
- The area grade is low — what's the realistic commute time and amenity access for the typical tenant pool here? Any planned neighborhood developments (good or bad) we should know about?
- What's the average days-on-market for RENTAL listings here right now (not sales)? A rising rental-DOM trend means longer vacancies and softer asking-rent achievability than the comps imply.
- What's the recent tenant-quality profile in this submarket — average credit score on applications, eviction rate, late-payment / NSF rate, and stable-employment percentage? A property-management company in the area should have these aggregated.
- How much new for-sale + rental construction is in the pipeline within 1–3 miles? Heavy new supply typically softens prices + rents 12–24 months out; constrained supply supports both.
Investment metrics
- 1% rule
- 0.64% ✗
- Cap rate
- 4.77%
- Cash-on-cash
- -5.43%
- DSCR
- 0.76
- GRM
- 13.0
CMA / ARV
- ARV (on-the-fly)
- $364,812
- Comps found
- 3
Show comp detail 3 sales within ~0.75 mi
| Address | Dist | Beds/Ba | Sqft | Sold | Price | $/sf | Match |
|---|---|---|---|---|---|---|---|
| 1137 Ecrue St E | 0.27mi | 3/1.0 | 1,536 (-15%) | 9mo | $310,000 | $202 | 51 |
| 1140 Nimitz Blvd | 0.22mi | 3/2.0 | 1,571 (-13%) | 23mo | $321,000 | $204 | 49 |
| 1119 Edgewood St E | 0.45mi | 4/2.0 (+1) | 1,571 (-13%) | 20mo | $315,000 | $201 | 36 |
Match score weights: distance 35% · size 25% · config 20% · recency 20%. Top-matched comps best support the ARV.
Projected returns pro-forma
10.0% appreciation · 0.0% rent growth · sell at horizon
- IRR
- 19.7%
- Equity multiple
- 2.59×
- Total profit
- $144,373
- Equity at exit
- $292,335
- IRR
- 17.6%
- Equity multiple
- 5.78×
- Total profit
- $434,658
- Equity at exit
- $630,432
Cash invested: $90,860 (down + closing). Projections, not guarantees.
Landlord ↔ Tenant lean methodology
- Overall (STATE)
- 87 Strongly Landlord-Friendly
- State Florida
- 87 Strongly Landlord-Friendly · R+3
- County
- — inherits STATE
- City
- — inherits STATE
ZIP-level market 33974
- Home prices YoY
- 5.8%
- Rents YoY
- -4.7%
- Active inventory
- 2460
- Price-to-rent
- 13.0×
Monthly cashflow live
- Estimated rent
- $2,080 high interval (Pro) →
- Mortgage (P&I)
- −$1,702
- Tax from tax record
- −$217 /mo · $2,608/yr
- Insurance
- −$135
- HOA
- −$0
- Vacancy / Maint / Mgmt
- −$437
- Net cashflow
- $-411
Break-even live
UW: 25.0% down · 7.5% · 30yr · 1.5% tax · 5.0% vac · 8.0% maint · 8.0% mgmt
Financing live
Cash to close
- Down payment
- $81,125
- Closing costs
- $9,735
- Reserves months
- —
- Total cash needed
- —
Loan-product check · same deal, 3 products live
Conventional
25% down · 7.5% · 30yr
- Down + closing
- —
- Monthly P&I
- —
- Monthly cashflow
- —
- DSCR
- —
- Eligible?
- —
Personal DTI + credit; lowest rate.
DSCR
20% down · 8.5% · 30yr
- Down + closing
- —
- Monthly P&I
- —
- Monthly cashflow
- —
- DSCR
- —
- Eligible?
- —
No personal income docs; deal must DSCR.
Hard money
10% down · 12.0% · 12mo
- Down + closing
- —
- Monthly P&I
- —
- Monthly cashflow
- —
- DSCR
- —
- Eligible?
- —
Short-term bridge; refi at stabilization.
Rent comps 25 comps
| Address | Beds | Baths | Sqft | Rent | $/sqft | DOM | Units | Dist |
|---|---|---|---|---|---|---|---|---|
| 934 Marilyn Ave S Lehigh Acres, FL | 4.0 | 2.0 | 1577 | $2,000 | $1.27 | 11d | 1 | 0.25mi |
| 934 Marilyn Ave S Lehigh Acres, FL | 4.0 | 2.0 | 1577 | $2,000 | $1.27 | 1d | 1 | 0.25mi |
| 1107 Enrique St E Lehigh Acres, FL | 3.0 | 2.0 | 1363 | $1,800 | $1.32 | 23d | 1 | 0.50mi |
| 1150 Darling St E Lehigh Acres, FL | 3.0 | 2.0 | 1292 | $1,800 | $1.39 | 23d | 1 | 0.64mi |
| 1142 Dutchess St E Lehigh Acres, FL | 4.0 | 2.5 | 1632 | $2,400 | $1.47 | 23d | 1 | 0.71mi |
| 847 Genoa Ave Lehigh Acres, FL | 3.0 | 2.0 | 1600 | $2,000 | $1.25 | 3d | 1 | 0.71mi |
| 1129 Deauville St E Lehigh Acres, FL | 3.0 | 2.0 | 1698 | $2,100 | $1.24 | 23d | 1 | 0.79mi |
| 1125 Deauville St E Lehigh Acres, FL | 3.0 | 2.0 | 1292 | $1,900 | $1.47 | 2d | 1 | 0.80mi |
| 1121 Deauville St E Lehigh Acres, FL | 3.0 | 2.0 | 1698 | $2,100 | $1.24 | 23d | 1 | 0.82mi |
| 828 Genoa Ave S Lehigh Acres, FL | 4.0 | 2.5 | 1632 | $2,400 | $1.47 | 23d | 1 | 0.84mi |
| 765 Aprile Ave S Lehigh Acres, FL | 4.0 | 2.0 | 1712 | $2,100 | $1.23 | 1d | 1 | 0.97mi |
| 1089 Eisenhower Blvd Lehigh Acres, FL | 4.0 | 2.0 | 1639 | $2,000 | $1.22 | 3d | 1 | 1.04mi |
| 751 Milano Ave S Lehigh Acres, FL | 4.0 | 3.0 | 2263 | $2,500 | $1.10 | 1d | 1 | 1.10mi |
| 936 Eisenhower Blvd Lehigh Acres, FL | 3.0 | 2.0 | 1300 | $1,395 | $1.07 | 3d | 1 | 1.10mi |
| 851 Eisenhower Blvd Lehigh Acres, FL | 3.0 | 2.0 | 2330 | $1,450 | $0.62 | 10d | 1 | 1.22mi |
| 1137 Edgerton Ave Lehigh Acres, FL | 3.0 | 2.0 | 2394 | $1,800 | $0.75 | 1d | 1 | 1.24mi |
| 851 Bedford Dr Lehigh Acres, FL | 3.0 | 2.0 | 2364 | $1,600 | $0.68 | 23d | 1 | 1.25mi |
| 941 Elgin St Lehigh Acres, FL | 3.0 | 2.0 | 1582 | $2,664 | $1.68 | 23d | 1 | 1.26mi |
| 827 Eisenhower Blvd Lehigh Acres, FL | 3.0 | 2.5 | 1640 | $1,780 | $1.09 | 11d | 1 | 1.29mi |
| 1253 Columbus Blvd Fort Myers, FL | 3.0 | 2.0 | 1288 | $1,650 | $1.28 | 23d | 1 | 1.30mi |
| 819 Eisenhower Blvd Unit 819 Lehigh Acres, FL | 3.0 | 2.0 | 1390 | $1,650 | $1.19 | 23d | 1 | 1.31mi |
| 1262 Best Ave Fort Myers, FL | 3.0 | 2.0 | 1288 | $1,600 | $1.24 | 14d | 1 | 1.38mi |
| 1147 Antonio St E Lehigh Acres, FL | 3.0 | 2.0 | 1713 | $2,300 | $1.34 | 1d | 1 | 1.47mi |
| 1018 Garnet Ave Lehigh Acres, FL | 3.0 | 2.0 | 1381 | $1,575 | $1.14 | 23d | 1 | 1.49mi |
| 1270 Bermar St Fort Myers, FL | 3.0 | 2.0 | 1408 | $1,660 | $1.18 | 3d | 1 | 1.50mi |
Listing history 26 events
-
2026-06-17remarks 562-char remark
-
2026-06-17days on market $324,500 Active 45 DOM
-
2026-06-16days on market $324,500 Active 44 DOM
-
2026-06-15days on market $324,500 Active 43 DOM
-
2026-06-13days on market $324,500 Active 41 DOM
-
2026-06-10pricedays on market $324,500 Active 38 DOM
-
2026-06-09days on market $337,000 Active 37 DOM
-
2026-06-08days on market $337,000 Active 36 DOM
-
2026-06-07days on market $337,000 Active 35 DOM
-
2026-06-03days on market $337,000 Active 31 DOM
-
2026-06-02days on market $337,000 Active 30 DOM
-
2026-06-01days on market $337,000 Active 29 DOM
-
2026-05-31days on market $337,000 Active 28 DOM
-
2026-05-01$337,000 Active
-
2026-03-18historical
-
2026-02-23price $347,000
-
2025-12-14price $365,000
-
2025-10-27price $370,000
-
2025-10-27$37,000 Active
-
2023-06-19historical
-
2023-01-10$389,900 Active
-
2020-09-29soldstatus $250,000 Closed
-
2020-07-17status Pending
-
2020-06-01$250,000 Active
-
2011-05-17historical
-
2006-05-22$7,900
ⓘ Source: listings_history table (triggers on properties + properties_extension) + one-shot
backfill from property_details.listing_events for pre-trigger history.
Tax reassessment forecast FL · Resets to sale price
- Current annual tax
- $2,608 · $217/mo
- Projected year-2 tax
- $2,693 · $224/mo
- Expected delta
- +$85/yr (+$7/mo · 3.3%)
ⓘ Screening estimate from a state-policy table — verify with the county assessor before closing.
Climate risk First Street
- Flood 5/10 Major FEMA zone X (unshaded) · 66% chance over 30 yrs
- Wildfire 2/10 Low
- Heat 9/10 Extreme 7 d/yr ≥109°F today · 27 d/yr by 30 yrs out
- Wind 10/10 Extreme 99% chance of damaging wind over 30 yrs
- Air quality 2/10 Low 1 unhealthy d/yr today · 2 by 30 yrs out
Nearby sold comps map
Loading sold comps map…
Walkable amenities ~0.75 mi
Loading nearby amenities…
Taxation est. · year 1
- Rental income
- $24,960
- − Mortgage interest
- −$18,177
- − Property taxes
- −$2,608
- − Insurance
- −$1,622
- − Repairs & maintenance
- −$1,997
- − Management
- −$1,997
- − Depreciation
- −$9,440
- Taxable loss
- −$10,881
- Est. tax savings @ 24.0%
- +$2,611
- After-tax cash flow
- $-2,321/yr
For passive investors: Depreciation is non-cash, so a rental often shows a tax loss while cash-flowing — sheltering income. Rental losses are passive: they offset passive income freely, and up to $25,000/yr can offset ordinary (W-2) income if you actively participate and your MAGI is under $100k (phasing out to $0 by $150k); unused losses carry forward. On sale, claimed depreciation is recaptured at up to 25%, and gains may owe capital-gains tax (a 1031 exchange can defer both). Figures are a year-1 estimate at your 24.0% rate — not tax advice; consult a CPA.
Schools (NCES district)
- District
- Lee
- NCES district ID
- 1201080
- Math proficiency
- 47% ▼ -11.00%
- Reading proficiency
- 50% ▼ -4.00%
- Median HH income
- $49,518
- Composite
- 41.49/100
- National rank
- #3458
- State rank
- #42 of 73 in FL
Livability — Lehigh Acres
- Score
- 59/100
- State rank
- #826
- US rank
- #20055
Category grades
Schools grade is shown separately in the Schools card above.
Census & demographics
- Census place
- Lehigh Acres, FL
- County
- Lee County · 788,662 people
- City population
- 130,638
- Metro
- Cape Coral-Fort Myers, FL
- Population (ZIP)
- 19,927
- Household income
- $72,192
- Rent vs Own
- Severe rent burden
- 434.0
Population outlook (Lee County) Hauer SSP2
- Today (2025)
- 871,946 people
- By 2030
- 955,468 · +9.6%
- By 2040
- 1,113,587 · +27.7%
- By 2050
- 1,256,891 · +44.1%
- By 2075
- 1,560,270 · +78.9%
- By 2100
- 1,726,848 · +98.0%
Race, ethnicity, and origin ACS 2023
- Neighborhood character
- Diverse neighborhood (Simpson 0.64)
- Race & ethnicity
- Hispanic / Latino 52% Two or more races 31% White 26% Black 18%
- Hispanic origin (detail)
- Mexican 12% Puerto Rican 7% Cuban 20% Dominican 4%
- Common ancestry
- Hispanic 7% Italian 1% Portuguese 1%
- Foreign-born
- 32% · Canada, Jamaica
- Languages at home
- 48% English-only · Spanish 43% French/Haitian/Cajun 7% Other Indo-European 1%
Political lean MEDSL · Lee
- 2024 margin
- Strong R (+28.4) · D 35.5% · R 63.9%
- 2008→2024 swing
- -18.0pp toward R · 2008: -10.4pp · 2024: -28.4pp
- All cycles
- 2024: R+28.4 2020: R+19.2 2016: R+20.4 2012: R+16.6 2008: R+10.4
Not yet ingested
- Civics
- —
Market trends
- HPI YoY
- ▲ 16.53%
- Current HPI
- 303.3399
- Rent YoY
- ▼ -4.68%
- Metro
- Cape Coral-Fort Myers, FL
- State GDP YoY
- ▲ 3.28%
- F500 in state
- 36
Industry mix (Fortune 500 HQ in FL)
| Industry | F500 HQs | Revenue |
|---|---|---|
| Industrial Technology | 2 | $29B |
|
||
| Insurance | 2 | $17B |
|
||
| Retail | 1 | $60B |
|
||
| Technology Distribution | 1 | $58B |
|
||
| Homebuilding | 1 | $35B |
|
||
| Technology Manufacturing | 1 | $35B |
|
||
Price history
+4165.8% since first listed13 events — show timeline
- 2026-05-01 Listed $337,000 MARMLS
- 2026-03-18 Listing Removed — NAPLESMLS
- 2026-02-23 Price Changed $347,000 NAPLESMLS
- 2025-12-14 Price Changed $365,000 NAPLESMLS
- 2025-10-27 Price Changed $370,000 NAPLESMLS
- 2025-10-27 Listed $37,000 NAPLESMLS
- 2023-06-19 Listing Removed — FORTMLS
- 2023-01-10 Listed $389,900 FORTMLS
- 2020-09-29 Sold (MLS) $250,000 FORTMLS
- 2020-07-17 Pending — FORTMLS
- 2020-06-01 Listed $250,000 FORTMLS
- 2011-05-17 Listing Removed — NAPLESMLS
- 2006-05-22 Listed $7,900 NAPLESMLS
Property tax history
+53.6%/yrLatest (2022): $2,608 · +10.3% YoY. Source: county tax records.
Cash-flow waterfall
monthlySold comps — $/sqft
last 12 mo · ≤1 miLoading sold comps…