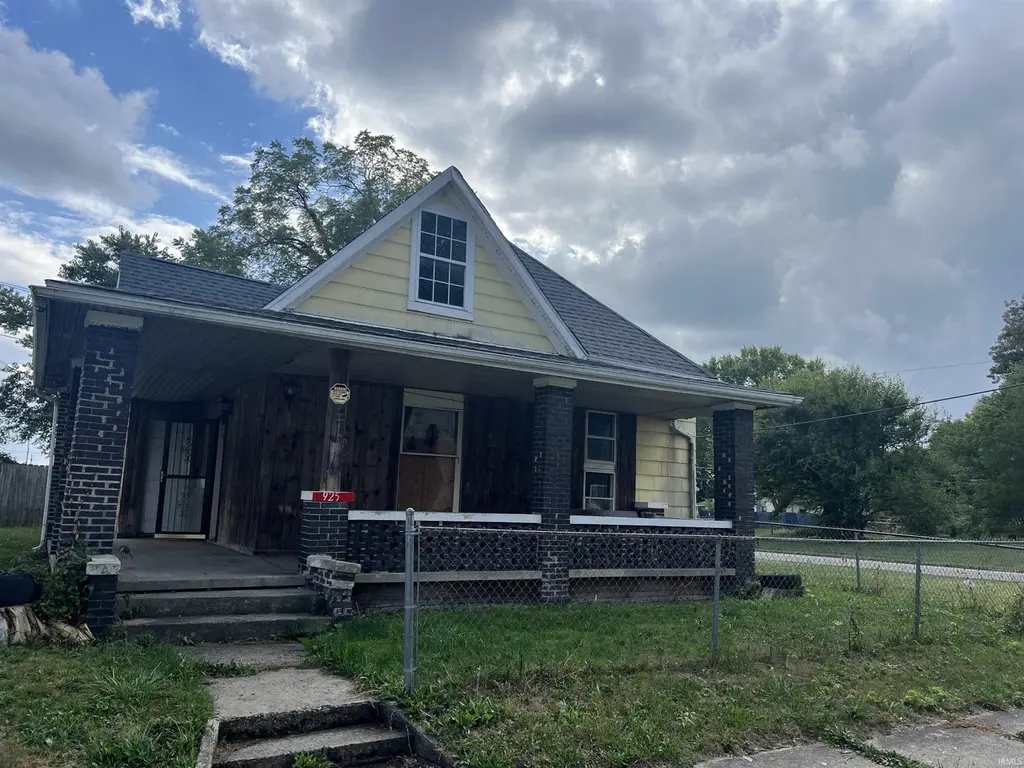
925 W Powers St · Muncie, IN
Flood risk 1/10 · Minimal
- FEMA flood zone
- X (unshaded)
- Chance of flooding over 30 yrs
- 0.0%
- Est. flood insurance / yr
- $473 – $860
Fire risk 1/10 · Minimal
- Est. fire insurance / yr
- $717 – $1,331
Heat risk 3/10 · Minor
- Hot days now (above 100°F)
- 7 days/yr
- Hot days in 30 yrs
- 18 days/yr
Wind risk 2/10 · Minimal
- Chance of severe wind over 30 yrs
- 0.0%
Air-quality risk 3/10 · Minor
- Unhealthy air days now
- 2 days/yr
- Unhealthy air days in 30 yrs
- 3 days/yr
Risk factors via First Street. Map © Google.
Why this score? — see what drove the C+ grade
The composite is a weighted blend of 9 inputs, each scored 0–100. Each bar is that input's sub-score; the figure is the points it added to the 100-point composite (weight × sub-score).
- Cash flow +30.0/30.0
- 1% rule +10.0/10.0
- DSCR +10.0/10.0
- Rent growth +4.5/5.0
- Livability +4.0/5.0
- Condition / age +2.5/5.0
- Schools +1.7/10.0
- ARV discount +0.0/15.0
- Appreciation +0.0/10.0
$69,500
🖨 Deal sheet 📄 Offer letter ✓ Due diligence
Listing remarks MLS
Spacious 4-Bedroom Home with Wraparound Porch, front and side. - Selling As-Is. This charming two-story, four-bedroom, two-bath home offers endless potential for the right buyer. While the home needs updates and TLC, it provides opportunity to create your own investment property. The Property features include wrap around front porch, partially fenced yard, detached garage, newer roof (2020), water heater (2022). Selling as-is- perfect for investors, flippers, or DIY buyers. Don't miss out on this opportunity.
Key facts
- Newer roof
- Water heater
- Wraparound porch
Tags
Neighborhood map
What this means for you Summary
Snapshot
- This is a 2-bed/1.0-bath single-family listed at $70k.
Deal economics
- At list price, monthly cash flow is $480 ($6k/yr) — positive.
- The deal already cash-flows at list — no discount required.
- Meets the 1% rule at list price ($1k rent vs $70k).
- Recommended offer: $61k (12.0% below list) — sets the bar for market timing.
- Cap rate 14.6% vs local median 6.0% in Muncie — top-decile yield for the area; either an underpriced asset or a hidden risk that comps aren't pricing in. Stress-test before assuming the spread holds.
Location & tenants
- Location reads 80/100 on livability (#18 in IN, #1,654 nationally) — a professional / high-income tenant draw. Strengths: amenities A+, commute A+, cost of living A+; Watch: schools D+, crime F, employment F.
- Muncie Community Schools (urban): math 18% / reading 25% proficiency, ranked #275 of 301 in IN (top 91%) — low school quality limits family demand, transient renter base, plan for 1-2y turnover; 68% free/reduced lunch — lower-income household profile, screen leases tightly.
- Market conditions: Rents rising fast (+7.8%/yr); 112 active listings in the ZIP; 6 comparable units currently listed for rent nearby; rentals lingering (median 44d on market — plan ~5-8 weeks vacancy on turnover, expect pricing pressure); 100% of comp listings sitting > 30 days — soft ceiling on asking rent; 171 units permitted in Delaware County in 2024 (57 in 5+ unit buildings).
- This rent runs 30% of the median local income ($48k/yr) — at the standard rent-burdened threshold; future hikes will face affordability resistance.
Forward outlook
- Local home prices are declining (-3.0%/yr); year-one equity from $481 of loan paydown is wiped out by about $2k of value loss. Plan a longer hold.
- Delaware County population projected at -11% by 2050 — secular population decline; favor cash flow + early exit over multi-decade hold.
- At projected returns (-3.0% appreciation + 7.8% rent growth), your $19k cash investment doubles in ~4 years — after that, you're playing with house money.
Negotiation context
- It's been on market 240 days — a 12% lower offer ($61k) is reasonable based on typical stale-listing flexibility.
Risks & watch-outs
- Watch-outs: built in 1890 — expect roof / HVAC / electrical / plumbing capex.
Questions for the listing agent
- It's been on market 240 days. Have you received any prior offers? Is the seller open to a 12% concession, seller financing, or rate buy-down credit?
- Built in 1890 — when were the roof, HVAC, electrical panel, plumbing, and water heater last replaced?
- Why hasn't it sold? Are there any deal-killer items the seller is aware of (foundation, flood, title, zoning, code violations)?
- Is there a deadline driving the sale (1031 exchange, divorce, estate, relocation)? That informs how much negotiation room exists.
- Schools are D-rated, which usually means shorter tenancies and higher turnover. Who's the typical renter profile here, and what's been the actual vacancy rate?
- Crime grade is F in this area — have there been break-ins, vandalism, or insurance claims at this property in the last 3 years? What carrier currently insures it and at what premium?
- What's the average days-on-market for RENTAL listings here right now (not sales)? A rising rental-DOM trend means longer vacancies and softer asking-rent achievability than the comps imply.
- What's the recent tenant-quality profile in this submarket — average credit score on applications, eviction rate, late-payment / NSF rate, and stable-employment percentage? A property-management company in the area should have these aggregated.
- How much new for-sale + rental construction is in the pipeline within 1–3 miles? Heavy new supply typically softens prices + rents 12–24 months out; constrained supply supports both.
Investment metrics
- 1% rule
- 1.72% ✓
- Cap rate
- 14.59%
- Cash-on-cash
- 29.62%
- DSCR
- 2.32
- GRM
- 4.9
CMA / ARV
- ARV (median comp)
- $58,750
- List price
- $69,500
- Delta
- 18.30%
- Verdict
- OVERPRICED
- Comps
- 20 within 1.0 mi
Show comp detail 10 sales within ~0.75 mi
| Address | Dist | Beds/Ba | Sqft | Sold | Price | $/sf | Match |
|---|---|---|---|---|---|---|---|
| 208 N Meeks Ave | 0.52mi | 2/1.0 | 2,160 (-3%) | 2mo | $127,800 | $59 | 69 |
| 822 W 7th St | 0.36mi | 3/1.0 (+1) | 2,340 (+5%) | 11mo | $45,000 | $19 | 61 |
| 411 - 413 W Adams St | 0.38mi | 3/3.5 (+1) | 2,208 (-1%) | 6mo | $105,000 | $48 | 60 |
| 725 W Charles St | 0.20mi | 3/2.0 (+1) | 2,548 (+14%) | 6mo | $140,000 | $55 | 53 |
| 1616 W White River Blvd | 0.53mi | 3/3.0 (+1) | 2,424 (+9%) | 5mo | $287,000 | $118 | 44 |
| 1702 S Franklin St | 0.71mi | 3/2.0 (+1) | 2,240 (+0%) | 18mo | $28,000 | $13 | 42 |
| 608 W Ashland Ave | 0.74mi | 3/1.5 (+1) | 2,272 (+2%) | 19mo | $170,000 | $75 | 40 |
| 320 W 6th St | 0.47mi | 3/2.0 (+1) | 1,954 (-12%) | 12mo | $129,000 | $66 | 38 |
| 618 W 10th St | 0.58mi | 2/1.0 | 2,448 (+10%) | 23mo | $90,000 | $37 | 38 |
| 1519 W 6th St | 0.55mi | 3/1.5 (+1) | 1,933 (-13%) | 22mo | $70,000 | $36 | 26 |
Match score weights: distance 35% · size 25% · config 20% · recency 20%. Top-matched comps best support the ARV.
Projected returns pro-forma
-3.0% appreciation · 7.8% rent growth · sell at horizon
- IRR
- 29.4%
- Equity multiple
- 2.30×
- Total profit
- $25,379
- Equity at exit
- $10,363
- IRR
- 39.3%
- Equity multiple
- 5.57×
- Total profit
- $88,884
- Equity at exit
- $6,009
Cash invested: $19,460 (down + closing). Projections, not guarantees.
Landlord ↔ Tenant lean methodology
- Overall (STATE)
- 90 Strongly Landlord-Friendly
- State Indiana
- 90 Strongly Landlord-Friendly · R+11
- County
- — inherits STATE
- City
- — inherits STATE
ZIP-level market 47303
- Home prices YoY
- -18.0%
- Rents YoY
- 7.8%
- Active inventory
- 112
- Price-to-rent
- 4.9×
Monthly cashflow live
- Estimated rent
- $1,192 high interval (Pro) →
- Mortgage (P&I)
- −$364
- Tax from tax record
- −$68 /mo · $816/yr
- Insurance
- −$29
- HOA
- −$0
- Vacancy / Maint / Mgmt
- −$250
- Net cashflow
- $480
Break-even live
UW: 25.0% down · 7.5% · 30yr · 1.5% tax · 5.0% vac · 8.0% maint · 8.0% mgmt
Financing live
Cash to close
- Down payment
- $17,375
- Closing costs
- $2,085
- Reserves months
- —
- Total cash needed
- —
Loan-product check · same deal, 3 products live
Conventional
25% down · 7.5% · 30yr
- Down + closing
- —
- Monthly P&I
- —
- Monthly cashflow
- —
- DSCR
- —
- Eligible?
- —
Personal DTI + credit; lowest rate.
DSCR
20% down · 8.5% · 30yr
- Down + closing
- —
- Monthly P&I
- —
- Monthly cashflow
- —
- DSCR
- —
- Eligible?
- —
No personal income docs; deal must DSCR.
Hard money
10% down · 12.0% · 12mo
- Down + closing
- —
- Monthly P&I
- —
- Monthly cashflow
- —
- DSCR
- —
- Eligible?
- —
Short-term bridge; refi at stabilization.
Rent comps 6 comps
| Address | Beds | Baths | Sqft | Rent | $/sqft | DOM | Units | Dist |
|---|---|---|---|---|---|---|---|---|
| 623 W 9th St Muncie, IN | 3.0 | 1.0 | 1574 | $1,499 | $0.95 | 43d | 1 | 0.51mi |
| 605 W 10th St Muncie, IN | 3.0 | 1.0 | 1688 | $1,150 | $0.68 | 43d | 1 | 0.57mi |
| 312 S Calvert St Muncie, IN | 3.0 | 1.0 | 1813 | $1,500 | $0.83 | 43d | 1 | 0.61mi |
| 328 S Talley Ave Muncie, IN | 2.0 | 1.0 | 1770 | $1,400 | $0.79 | 43d | 1 | 0.79mi |
| 816 N New York Ave Muncie, IN | 3.0–4.0 | 1.0 | 1200 | $1,000 | $0.83 | 43d | 10 | 0.93mi |
| 2112 W 11th St Muncie, IN | 3.0 | 2.0 | 1646 | $1,000 | $0.61 | 43d | 1 | 0.97mi |
Listing history 4 events
-
2025-11-19price $69,500 518-char remark
Show marketing remark (518 chars)
Spacious 4-Bedroom Home with Wraparound Porch, front and side. - Selling As-Is. This charming two-story, four-bedroom, two-bath home offers endless potential for the right buyer. While the home needs updates and TLC, it provides opportunity to create your own investment property. The Property features include wrap around front porch, partially fenced yard, detached garage, newer roof (2020), water heater (2022). Selling as-is- perfect for investors, flippers, or DIY buyers. Don't miss out on this opportunity.
-
2025-11-06price $73,500 518-char remark
Show marketing remark (518 chars)
Spacious 4-Bedroom Home with Wraparound Porch, front and side. - Selling As-Is. This charming two-story, four-bedroom, two-bath home offers endless potential for the right buyer. While the home needs updates and TLC, it provides opportunity to create your own investment property. The Property features include wrap around front porch, partially fenced yard, detached garage, newer roof (2020), water heater (2022). Selling as-is- perfect for investors, flippers, or DIY buyers. Don't miss out on this opportunity.
-
2025-10-18price $77,500 518-char remark
Show marketing remark (518 chars)
Spacious 4-Bedroom Home with Wraparound Porch, front and side. - Selling As-Is. This charming two-story, four-bedroom, two-bath home offers endless potential for the right buyer. While the home needs updates and TLC, it provides opportunity to create your own investment property. The Property features include wrap around front porch, partially fenced yard, detached garage, newer roof (2020), water heater (2022). Selling as-is- perfect for investors, flippers, or DIY buyers. Don't miss out on this opportunity.
-
2025-09-25$79,500 Active 518-char remark
Show marketing remark (518 chars)
Spacious 4-Bedroom Home with Wraparound Porch, front and side. - Selling As-Is. This charming two-story, four-bedroom, two-bath home offers endless potential for the right buyer. While the home needs updates and TLC, it provides opportunity to create your own investment property. The Property features include wrap around front porch, partially fenced yard, detached garage, newer roof (2020), water heater (2022). Selling as-is- perfect for investors, flippers, or DIY buyers. Don't miss out on this opportunity.
ⓘ Source: listings_history table (triggers on properties + properties_extension) + one-shot
backfill from property_details.listing_events for pre-trigger history.
Tax reassessment forecast IN · Partial reset (capped growth)
- Current annual tax
- $816 · $68/mo
- Projected year-2 tax
- $816 · $68/mo
- Expected delta
- $0/yr ($0/mo · 0.0%)
ⓘ Screening estimate from a state-policy table — verify with the county assessor before closing.
Climate risk First Street
- Flood 1/10 Low FEMA zone X (unshaded) · 0% chance over 30 yrs
- Wildfire 1/10 Low
- Heat 3/10 Moderate 7 d/yr ≥100°F today · 18 d/yr by 30 yrs out
- Wind 2/10 Low 0% chance of damaging wind over 30 yrs
- Air quality 3/10 Moderate 2 unhealthy d/yr today · 3 by 30 yrs out
Nearby sold comps map
Loading sold comps map…
Walkable amenities ~0.75 mi
Loading nearby amenities…
Taxation est. · year 1
- Rental income
- $14,306
- − Mortgage interest
- −$3,893
- − Property taxes
- −$816
- − Insurance
- −$348
- − Repairs & maintenance
- −$1,145
- − Management
- −$1,145
- − Depreciation
- −$2,022
- Taxable income
- $4,939
- Est. tax owed @ 24.0%
- −$1,185
- After-tax cash flow
- $4,580/yr
For passive investors: Depreciation is non-cash, so a rental often shows a tax loss while cash-flowing — sheltering income. Rental losses are passive: they offset passive income freely, and up to $25,000/yr can offset ordinary (W-2) income if you actively participate and your MAGI is under $100k (phasing out to $0 by $150k); unused losses carry forward. On sale, claimed depreciation is recaptured at up to 25%, and gains may owe capital-gains tax (a 1031 exchange can defer both). Figures are a year-1 estimate at your 24.0% rate — not tax advice; consult a CPA.
Schools (NCES district)
- District
- Muncie Community Schools
- NCES district ID
- 1807320
- Math proficiency
- 18% ▼ -9.00%
- Reading proficiency
- 25% ▼ -4.00%
- Median HH income
- $30,052
- Composite
- 17.22/100
- National rank
- #9099
- State rank
- #275 of 301 in IN
Livability — Muncie
- Score
- 80/100
- State rank
- #18
- US rank
- #1654
Category grades
Schools grade is shown separately in the Schools card above.
Census & demographics
- Census place
- Muncie, IN
- County
- Delaware County · 84,658 people
- City population
- 84,658
- Metro
- Muncie, IN
- Population (ZIP)
- 24,392
- Household income
- $47,674
- Rent vs Own
- Severe rent burden
- 1434.0
Population outlook (Delaware County) Hauer SSP2
- Today (2025)
- 113,036 people
- By 2030
- 111,313 · -1.5%
- By 2040
- 106,432 · -5.8%
- By 2050
- 100,747 · -10.9%
- By 2075
- 91,000 · -19.5%
- By 2100
- 80,687 · -28.6%
Race, ethnicity, and origin ACS 2023
- Neighborhood character
- Predominantly White (82%)
- Race & ethnicity
- White 82% Black 9% Two or more races 5% Hispanic / Latino 3%
- Common ancestry
- Italian 4% Slovak 3% Lithuanian 2%
- Foreign-born
- 2% · Canada
- Languages at home
- 97% English-only · Spanish 1%
Political lean MEDSL · Delaware
- 2024 margin
- R (+15.8) · D 41.2% · R 57.0% · Other 1.8%
- 2008→2024 swing
- -30.8pp toward R · 2008: 15.0pp · 2024: -15.8pp
- All cycles
- 2024: R+15.8 2020: R+13.2 2016: R+13.7 2012: D+3.1 2008: D+15.0
Not yet ingested
- Civics
- —
Market trends
- HPI YoY
- ▼ -50.45%
- Current HPI
- 229.8654
- Rent YoY
- ▲ 7.80%
- Metro
- Muncie, IN
- State GDP YoY
- ▲ 2.90%
- F500 in state
- 18
Industry mix (Fortune 500 HQ in IN)
| Industry | F500 HQs | Revenue |
|---|---|---|
| Industrial Machinery | 2 | $37B |
|
||
| Healthcare | 1 | $177B |
|
||
| Pharmaceuticals | 1 | $45B |
|
||
| Metals / Steel | 1 | $18B |
|
||
| Agriculture | 1 | $17B |
|
||
| Packaging | 1 | $12B |
|
||
Price history
-12.6% since first listed4 events — show timeline
- 2025-11-19 Price Changed $69,500 IRMLS
- 2025-11-06 Price Changed $73,500 IRMLS
- 2025-10-18 Price Changed $77,500 IRMLS
- 2025-09-25 Listed $79,500 IRMLS
Property tax history
-0.3%/yrLatest (2024): $816 · +16.9% YoY. Source: county tax records.
Cash-flow waterfall
monthlySold comps — $/sqft
last 12 mo · ≤1 miLoading sold comps…