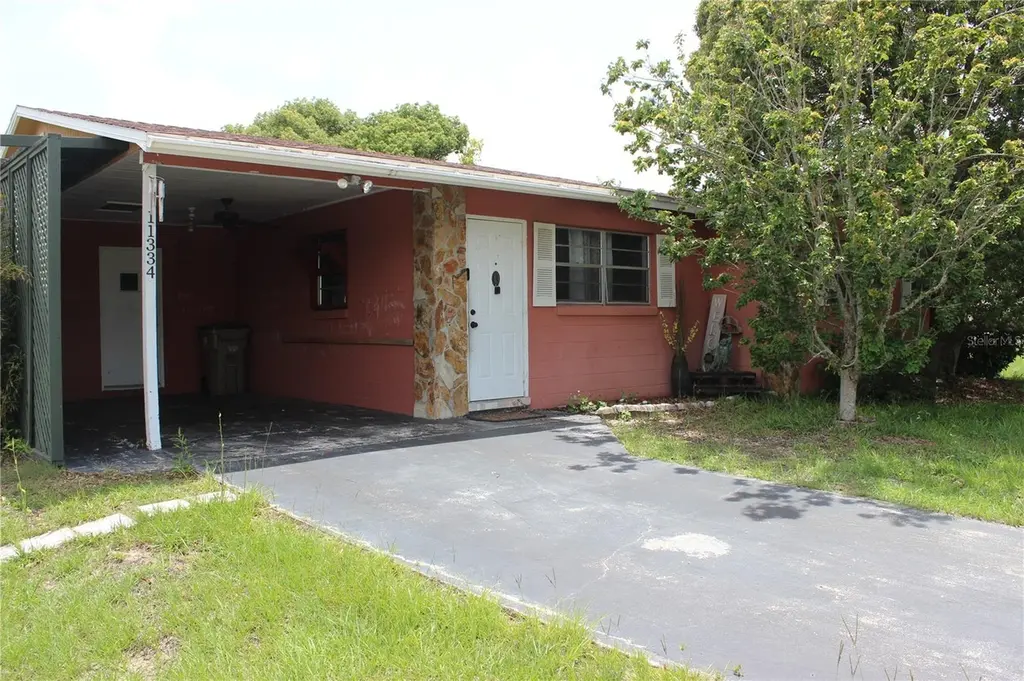
11334 Layton St · Silver Lake, FL
Flood risk 1/10 · Minimal
- FEMA flood zone
- X (unshaded)
- Chance of flooding over 30 yrs
- 0.0%
- Est. flood insurance / yr
- $507 – $1,088
Fire risk 4/10 · Minor
- Est. fire insurance / yr
- $947 – $1,759
Heat risk 9/10 · Severe
- Hot days now (above 107°F)
- 7 days/yr
- Hot days in 30 yrs
- 24 days/yr
Wind risk 9/10 · Severe
- Chance of severe wind over 30 yrs
- 99.0%
Air-quality risk 2/10 · Minimal
- Unhealthy air days now
- 1 days/yr
- Unhealthy air days in 30 yrs
- 1 days/yr
Risk factors via First Street. Map © Google.
Why this score? — see what drove the C- grade
The composite is a weighted blend of 9 inputs, each scored 0–100. Each bar is that input's sub-score; the figure is the points it added to the 100-point composite (weight × sub-score).
- Cash flow +21.0/30.0
- ARV discount +9.1/15.0
- DSCR +6.7/10.0
- 1% rule +5.1/10.0
- Schools +4.2/10.0
- Livability +3.2/5.0
- Rent growth +2.5/5.0
- Condition / age +2.5/5.0
- Appreciation +0.0/10.0
$185,000
🖨 Deal sheet 📄 Offer letter ✓ Due diligence
Listing remarks MLS
Cute 3 bedroom 1 bath home on . 45 acre. Carport and detached garage/workshop with fenced in yard. Sliding glass doors lead you to a screened in porch and then stroll on out to the covered patio that leads you to a peaceful backyard setting. Conveniently located, you'll enjoy easy access to shopping, restaurants, entertainment, schools and hospital. Call to schedule your showing today!
Key facts
- Carport
- Covered patio
- Screened porch
Tags
Property features AI
Finance
- Other: Property zoned R-6; Homestead status indicated
- HOA & community: No HOA/association indicated
Exterior
- Parking: Attached garage (1 car); Carport (1 car)
- Utilities: Public water; Septic tank sewer; Cable available; Electricity connected
- Home design: Single-family residence; One story; Faces north
- Construction: Block construction; Shingle roof; Slab foundation; Built on a lot of about 0.46 acres
- Exterior features: Covered patio/porch; Sliding doors; Paved road frontage; Lot dimensions approximately 100 x 200
Interior
- Kitchen: Microwave; Range; Refrigerator; Water softener
- Bedrooms: 3 bedrooms
- Flooring: Carpet; Laminate
- Bathrooms: 1 full bathroom
- Heating & cooling: Central heating; Central air conditioning
- Interior features: Ceiling fans; Kitchen/family room combo; Thermostat
- Laundry & utility: Electric dryer hookup; Laundry inside
Neighborhood map
What this means for you Summary
Snapshot
- This is a 3-bed/1.0-bath single-family listed at $185k.
Deal economics
- At list price, monthly cash flow is $259 ($3k/yr) — positive.
- The deal already cash-flows at list — no discount required.
- Meets the 1% rule at list price ($2k rent vs $185k).
- Recommended offer: $182k (1.5% below list) — sets the bar for market timing.
- Cap rate 8.0% vs local median 5.1% in Silver Lake — top-decile yield for the area; either an underpriced asset or a hidden risk that comps aren't pricing in. Stress-test before assuming the spread holds.
Location & tenants
- Location reads 65/100 on livability (#644 in FL) — a middle-class / working-renter tenant base. Strengths: crime A+, housing A+, cost of living A; Watch: schools F, amenities F, commute F.
- Lake (suburban): math 49% / reading 50% proficiency, ranked #37 of 73 in FL (top 51%) — families likely to look elsewhere, expect single-tenant / working-renter base with shorter leases.
- Market conditions: 285 active listings in the ZIP; 4 comparable units currently listed for rent nearby; rentals at typical pace (median 24d on market — plan ~3-4 weeks tenant-placement turnaround); 4,799 units permitted in Lake County in 2024 (814 in 5+ unit buildings).
- This rent runs 41% of the median local income ($54k/yr) — at the standard rent-burdened threshold; future hikes will face affordability resistance.
Forward outlook
- Local home prices are declining (-3.0%/yr); year-one equity from $1k of loan paydown is wiped out by about $6k of value loss. Plan a longer hold.
- Lake County population projected at +37% by 2050 — long-run rental-demand tailwind backs the buy-and-hold thesis.
Negotiation context
- It's been on market 17 days — a 2% lower offer ($182k) is reasonable based on typical stale-listing flexibility.
- 2 sale attempts since 5y ago with the ask held roughly flat each time — persistent listings suggest the price (not the market) is what's stuck; bring a comps-based counter.
Risks & watch-outs
- Climate carrying-cost: severe wind risk, 99% chance of damaging wind over 30y; extreme-heat days projected 7→24/yr by 2055 (HVAC capex compounding) — expect insurance premiums to compound above CPI over the hold.
Questions for the listing agent
- Built in 1979 — when were the roof, HVAC, electrical panel, plumbing, and water heater last replaced?
- Is there a deadline driving the sale (1031 exchange, divorce, estate, relocation)? That informs how much negotiation room exists.
- Schools are F-rated, which usually means shorter tenancies and higher turnover. Who's the typical renter profile here, and what's been the actual vacancy rate?
- What's the average days-on-market for RENTAL listings here right now (not sales)? A rising rental-DOM trend means longer vacancies and softer asking-rent achievability than the comps imply.
- What's the recent tenant-quality profile in this submarket — average credit score on applications, eviction rate, late-payment / NSF rate, and stable-employment percentage? A property-management company in the area should have these aggregated.
- How much new for-sale + rental construction is in the pipeline within 1–3 miles? Heavy new supply typically softens prices + rents 12–24 months out; constrained supply supports both.
Investment metrics
- 1% rule
- 1.01% ✓
- Cap rate
- 7.98%
- Cash-on-cash
- 6.01%
- DSCR
- 1.27
- GRM
- 8.3
CMA / ARV
- ARV (on-the-fly)
- $192,000
- Comps found
- 8
Show comp detail 8 sales within ~0.75 mi
| Address | Dist | Beds/Ba | Sqft | Sold | Price | $/sf | Match |
|---|---|---|---|---|---|---|---|
| 34340 Oak Ave | 0.31mi | 2/1.0 (-1) | 962 (-4%) | 2mo | $185,000 | $192 | 72 |
| 34826 Learn Rd | 0.58mi | 2/2.0 (-1) | 972 (-3%) | 2mo | $320,000 | $329 | 57 |
| 11626 Fairmont Ave | 0.34mi | 3/2.0 | 864 (-14%) | 10mo | $55,000 | $64 | 49 |
| 10830 Anna Belle Ave | 0.67mi | 3/2.0 | 1,032 (+3%) | 16mo | $220,000 | $213 | 46 |
| 11331 Northern Ave | 0.57mi | 3/1.0 | 1,108 (+11%) | 15mo | $199,222 | $180 | 43 |
| 11916 Ocklawaha Dr | 0.58mi | 3/2.0 | 1,120 (+12%) | 19mo | $252,000 | $225 | 33 |
| 1033 Scotch Pine Ct | 0.60mi | 2/2.0 (-1) | 1,118 (+12%) | 14mo | $198,000 | $177 | 32 |
| 1441 Ben Hope Dr | 0.74mi | 2/2.0 (-1) | 1,144 (+14%) | 8mo | $210,000 | $184 | 26 |
Match score weights: distance 35% · size 25% · config 20% · recency 20%. Top-matched comps best support the ARV.
Projected returns pro-forma
-3.0% appreciation · 3.0% rent growth · sell at horizon
- IRR
- -7.0%
- Equity multiple
- 0.74×
- Total profit
- $-13,466
- Equity at exit
- $27,584
- IRR
- 2.6%
- Equity multiple
- 1.18×
- Total profit
- $9,499
- Equity at exit
- $15,995
Cash invested: $51,800 (down + closing). Projections, not guarantees.
Landlord ↔ Tenant lean methodology
- Overall (STATE)
- 87 Strongly Landlord-Friendly
- State Florida
- 87 Strongly Landlord-Friendly · R+3
- County
- — inherits STATE
- City
- — inherits STATE
ZIP-level market 34788
- Home prices YoY
- -18.2%
- Active inventory
- 285
- Price-to-rent
- 8.3×
Monthly cashflow live
- Estimated rent
- $1,862 medium interval (Pro) →
- Mortgage (P&I)
- −$970
- Tax from tax record
- −$164 /mo · $1,970/yr
- Insurance
- −$77
- HOA
- −$0
- Vacancy / Maint / Mgmt
- −$391
- Net cashflow
- $259
Break-even live
UW: 25.0% down · 7.5% · 30yr · 1.5% tax · 5.0% vac · 8.0% maint · 8.0% mgmt
Financing live
Cash to close
- Down payment
- $46,250
- Closing costs
- $5,550
- Reserves months
- —
- Total cash needed
- —
Loan-product check · same deal, 3 products live
Conventional
25% down · 7.5% · 30yr
- Down + closing
- —
- Monthly P&I
- —
- Monthly cashflow
- —
- DSCR
- —
- Eligible?
- —
Personal DTI + credit; lowest rate.
DSCR
20% down · 8.5% · 30yr
- Down + closing
- —
- Monthly P&I
- —
- Monthly cashflow
- —
- DSCR
- —
- Eligible?
- —
No personal income docs; deal must DSCR.
Hard money
10% down · 12.0% · 12mo
- Down + closing
- —
- Monthly P&I
- —
- Monthly cashflow
- —
- DSCR
- —
- Eligible?
- —
Short-term bridge; refi at stabilization.
Rent comps 4 comps
| Address | Beds | Baths | Sqft | Rent | $/sqft | DOM | Units | Dist |
|---|---|---|---|---|---|---|---|---|
| 35 Aberdeen Cir Leesburg, FL | 2.0 | 2.0 | 1072 | $1,400 | $1.31 | 24d | 1 | 0.79mi |
| 35229 Orange Grove Ln Leesburg, FL | 2.0 | 1.0 | 1194 | $1,400 | $1.17 | 24d | 1 | 1.17mi |
| 112 Crossways Dr Leesburg, FL | 3.0 | 2.0 | 1200 | $1,800 | $1.50 | 5d | 1 | 1.33mi |
| 147 Woodland Dr Leesburg, FL | 3.0 | 2.0 | 1372 | $1,449 | $1.06 | 24d | 1 | 1.43mi |
Listing history 11 events
-
2026-06-15status $185,000 Pending 17 DOM
-
2026-06-15days on market $185,000 Active 17 DOM
-
2026-06-13days on market $185,000 Active 15 DOM
-
2026-06-09days on market $185,000 Active 11 DOM
-
2026-06-08days on market $185,000 Active 10 DOM
-
2026-06-07days on market $185,000 Active 9 DOM
-
2026-06-04days on market $185,000 Active 6 DOM
-
2026-06-03days on market $185,000 Active 5 DOM
-
2026-06-02days on market $185,000 Active 4 DOM
-
2026-06-01days on market $185,000 Active 3 DOM
-
2026-05-31days on market $185,000 Active 2 DOM
ⓘ Source: listings_history table (triggers on properties + properties_extension) + one-shot
backfill from property_details.listing_events for pre-trigger history.
Tax reassessment forecast FL · Resets to sale price
- Current annual tax
- $1,970 · $164/mo
- Projected year-2 tax
- $1,970 · $164/mo
- Expected delta
- $0/yr ($0/mo · 0.0%)
ⓘ Screening estimate from a state-policy table — verify with the county assessor before closing.
Climate risk First Street
- Flood 1/10 Low FEMA zone X (unshaded) · 0% chance over 30 yrs
- Wildfire 4/10 Moderate
- Heat 9/10 Extreme 7 d/yr ≥107°F today · 24 d/yr by 30 yrs out
- Wind 9/10 Extreme 99% chance of damaging wind over 30 yrs
- Air quality 2/10 Low 1 unhealthy d/yr today · 1 by 30 yrs out
Nearby sold comps map
Loading sold comps map…
Walkable amenities ~0.75 mi
Loading nearby amenities…
Taxation est. · year 1
- Rental income
- $22,343
- − Mortgage interest
- −$10,363
- − Property taxes
- −$1,970
- − Insurance
- −$925
- − Repairs & maintenance
- −$1,787
- − Management
- −$1,787
- − Depreciation
- −$5,382
- Taxable income
- $128
- Est. tax owed @ 24.0%
- −$31
- After-tax cash flow
- $3,083/yr
For passive investors: Depreciation is non-cash, so a rental often shows a tax loss while cash-flowing — sheltering income. Rental losses are passive: they offset passive income freely, and up to $25,000/yr can offset ordinary (W-2) income if you actively participate and your MAGI is under $100k (phasing out to $0 by $150k); unused losses carry forward. On sale, claimed depreciation is recaptured at up to 25%, and gains may owe capital-gains tax (a 1031 exchange can defer both). Figures are a year-1 estimate at your 24.0% rate — not tax advice; consult a CPA.
Schools (NCES district)
- District
- Lake
- NCES district ID
- 1201050
- Math proficiency
- 49% ▼ -7.00%
- Reading proficiency
- 50% ▼ -4.00%
- Median HH income
- $46,632
- Composite
- 42.05/100
- National rank
- #3327
- State rank
- #37 of 73 in FL
Livability — Silver Lake
- Score
- 65/100
- State rank
- #644
- US rank
- #12722
Category grades
Schools grade is shown separately in the Schools card above.
Census & demographics
- County
- Lake County · 364,602 people
- City population
- 21,867
- Metro
- Orlando-Kissimmee-Sanford, FL
- Population (ZIP)
- 22,137
- Household income
- $54,147
- Rent vs Own
- Severe rent burden
- 406.0
Population outlook (Lake County) Hauer SSP2
- Today (2025)
- 386,640 people
- By 2030
- 417,107 · +7.9%
- By 2040
- 476,676 · +23.3%
- By 2050
- 531,296 · +37.4%
- By 2075
- 648,303 · +67.7%
- By 2100
- 698,530 · +80.7%
Race, ethnicity, and origin ACS 2023
- Neighborhood character
- Predominantly White (79%)
- Race & ethnicity
- White 79% Hispanic / Latino 12% Two or more races 7% Black 5% Asian 1%
- Hispanic origin (detail)
- Mexican 3% Puerto Rican 6%
- Common ancestry
- Romanian 4% Lithuanian 3% Slovak 2%
- Foreign-born
- 5% · Canada, South Korea
- Languages at home
- 88% English-only · Spanish 9% German/W. Germanic 1% Tagalog/Filipino 1%
Political lean MEDSL · Lake
- 2024 margin
- Strong R (+24.7) · D 37.3% · R 62.0%
- 2008→2024 swing
- -11.2pp toward R · 2008: -13.5pp · 2024: -24.7pp
- All cycles
- 2024: R+24.7 2020: R+20.0 2016: R+23.1 2012: R+17.1 2008: R+13.5
Not yet ingested
- Civics
- —
Market trends
- HPI YoY
- ▼ -61.07%
- Current HPI
- 273.6616
- Rent YoY
- —
- Metro
- Orlando-Kissimmee-Sanford, FL
- State GDP YoY
- ▲ 3.28%
- F500 in state
- 36
Industry mix (Fortune 500 HQ in FL)
| Industry | F500 HQs | Revenue |
|---|---|---|
| Industrial Technology | 2 | $29B |
|
||
| Insurance | 2 | $17B |
|
||
| Retail | 1 | $60B |
|
||
| Technology Distribution | 1 | $58B |
|
||
| Homebuilding | 1 | $35B |
|
||
| Technology Manufacturing | 1 | $35B |
|
||
Price history
+266.3% since first listed6 events — show timeline
- 2026-05-29 Listed $185,000 Stellar MLS as Distributed by MLS Grid
- 2021-11-23 Sold (Public Records) $165,000 Public Records
- 2021-11-19 Sold (MLS) $165,000 Stellar MLS as Distributed by MLS Grid
- 2021-10-09 Pending — Stellar MLS as Distributed by MLS Grid
- 2021-10-05 Listed $150,000 Stellar MLS as Distributed by MLS Grid
- 1995-02-21 Sold (Public Records) $50,500 Public Records
Property tax history
+16.5%/yrLatest (2025): $1,970 · +2.9% YoY. Source: county tax records.
Cash-flow waterfall
monthlySold comps — $/sqft
last 12 mo · ≤1 miLoading sold comps…