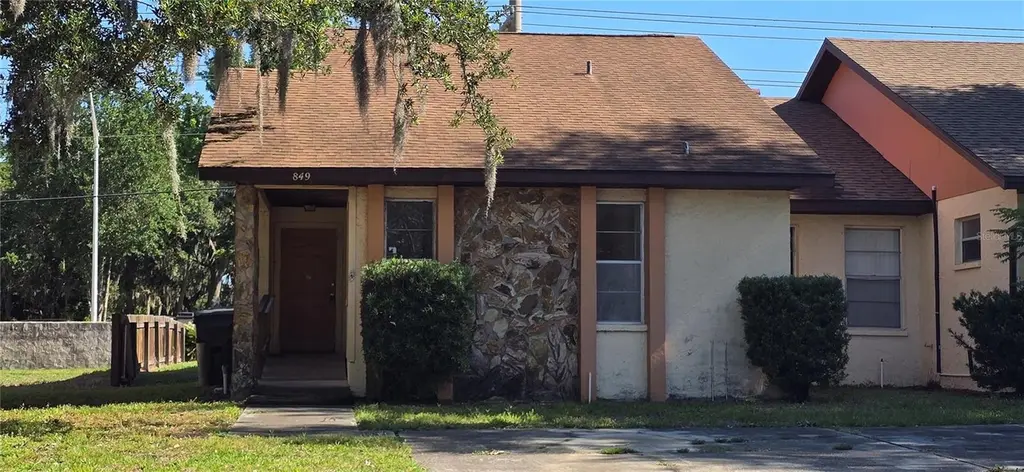
849 Cimarron Ct · Medulla, FL
Flood risk 1/10 · Minimal
- FEMA flood zone
- X (unshaded)
- Chance of flooding over 30 yrs
- 0.0%
- Est. flood insurance / yr
- $507 – $1,088
Fire risk 1/10 · Minimal
- Est. fire insurance / yr
- $947 – $1,759
Heat risk 8/10 · Major
- Hot days now (above 108°F)
- 7 days/yr
- Hot days in 30 yrs
- 24 days/yr
Wind risk 9/10 · Severe
- Chance of severe wind over 30 yrs
- 99.0%
Air-quality risk 2/10 · Minimal
- Unhealthy air days now
- 1 days/yr
- Unhealthy air days in 30 yrs
- 2 days/yr
Risk factors via First Street. Map © Google.
Why this score? — see what drove the C- grade
The composite is a weighted blend of 9 inputs, each scored 0–100. Each bar is that input's sub-score; the figure is the points it added to the 100-point composite (weight × sub-score).
- Cash flow +19.1/30.0
- ARV discount +7.5/15.0
- DSCR +6.0/10.0
- 1% rule +5.5/10.0
- Schools +3.5/10.0
- Livability +3.3/5.0
- Rent growth +3.0/5.0
- Condition / age +2.5/5.0
- Appreciation +0.0/10.0
$150,000
🖨 Deal sheet 📄 Offer letter ✓ Due diligence
Listing remarks
Under contract-accepting backup offers. * * Multiple offers-- highest and best by friday 5/15 at noon * * Great opportunity to make this one your own! It is a fixer upper but its an excellent 1/2 duplex in south Lakeland that has 2 bedrooms and 2.5 baths-- two master suites and one with an updated bathroom. The rest of the home needs flooring, paint and some updates. Roof is 2017 and AC is 2012. It is wheelchair accessible, has a fenced back yard and a rear screened in porch with a storage room. This property also has 2 extended parking spaces that could fit 4 vehicles easily. All information and sizes are believed to be accurate but should be verified by buyer and or buyers agent.
Key facts
- Storage room
- Fenced back yard
- $41 HOA
Tags
Property features AI
Finance
- Other: Property listed as residential half-duplex; Total rooms: 7; Living area reported ~1,079 sq ft (building area ~1,179 sq ft)
- HOA & community: Cimarron Homeowners Association with required annual fee of $500 (about $41.67/month); Pets allowed
Exterior
- Utilities: Public water; Public sewer and septic tank; Electricity connected; Water connected; Cable available
- Home design: Residential half-duplex; One story; South facing; Fixer condition; Accessible entrance; Accessible central living area
- Construction: Block construction; Shingle roof; Slab foundation; Built on a 0.11-acre lot
- Exterior features: Covered rear porch; Screened porch; Front porch; Masonry and wood fencing; Accessible approach with ramp
Interior
- Kitchen: Range; Microwave
- Bedrooms: 2 bedrooms
- Flooring: Concrete; Other
- Bathrooms: 2 full baths; 1 half bath; Accessible full bathroom
- Heating & cooling: Central heating; Central air
- Interior features: Eat-in kitchen; Vaulted ceilings; Walk-in closets; Sliding doors; Storage
- Laundry & utility: Washer; Dryer; Laundry closet; Laundry located in the kitchen
Neighborhood map
What this means for you Summary
Snapshot
- This is a 2-bed/2.0-bath townhouse listed at $150k.
Deal economics
- At list price, monthly cash flow is $159 ($2k/yr) — positive.
- The deal already cash-flows at list — no discount required.
- Meets the 1% rule at list price ($2k rent vs $150k).
Location & tenants
- Location reads 66/100 on livability (#601 in FL) — a middle-class / working-renter tenant base. Strengths: housing A+, cost of living A-, crime B+; Watch: schools D-, amenities F, commute F.
- Polk (suburban): math 39% / reading 43% proficiency, ranked #62 of 73 in FL (top 85%) — families likely to look elsewhere, expect single-tenant / working-renter base with shorter leases.
- Market conditions: Rents rising (+1.8%/yr); 344 active listings in the ZIP; 18 comparable units currently listed for rent nearby; rentals leasing fast (median 3d on market — plan ~1-2 weeks tenant-placement turnaround); solid renter incomes; 10,384 units permitted in Polk County in 2024 (1,716 in 5+ unit buildings).
Forward outlook
- Local home prices are declining (-3.0%/yr); year-one equity from $1k of loan paydown is wiped out by about $4k of value loss. Plan a longer hold.
- Polk County population projected at +33% by 2050 — long-run rental-demand tailwind backs the buy-and-hold thesis.
Negotiation context
- Only 11 days on market — expect competitive offers; lowballing is unlikely to land.
- Current owner paid $55k; list at $150k implies a 171% gain — meaningful room to come down on a strong offer.
Risks & watch-outs
- Climate carrying-cost: severe wind risk, 99% chance of damaging wind over 30y; extreme-heat days projected 7→24/yr by 2055 (HVAC capex compounding) — expect insurance premiums to compound above CPI over the hold.
Questions for the listing agent
- What does the HOA fee cover, when was the last increase, and are there any pending special assessments or reserve-fund shortfalls?
- Is there a deadline driving the sale (1031 exchange, divorce, estate, relocation)? That informs how much negotiation room exists.
- Schools are D-rated, which usually means shorter tenancies and higher turnover. Who's the typical renter profile here, and what's been the actual vacancy rate?
- What's the average days-on-market for RENTAL listings here right now (not sales)? A rising rental-DOM trend means longer vacancies and softer asking-rent achievability than the comps imply.
- What's the recent tenant-quality profile in this submarket — average credit score on applications, eviction rate, late-payment / NSF rate, and stable-employment percentage? A property-management company in the area should have these aggregated.
- How much new for-sale + rental construction is in the pipeline within 1–3 miles? Heavy new supply typically softens prices + rents 12–24 months out; constrained supply supports both.
Investment metrics
- 1% rule
- 1.05% ✓
- Cap rate
- 7.57%
- Cash-on-cash
- 4.55%
- DSCR
- 1.20
- GRM
- 7.9
CMA / ARV
No comps found within radius.
Projected returns pro-forma
-3.0% appreciation · 1.81% rent growth · sell at horizon
- IRR
- -10.6%
- Equity multiple
- 0.62×
- Total profit
- $-15,988
- Equity at exit
- $22,365
- IRR
- -3.1%
- Equity multiple
- 0.81×
- Total profit
- $-8,141
- Equity at exit
- $12,969
Cash invested: $42,000 (down + closing). Projections, not guarantees.
Landlord ↔ Tenant lean methodology
- Overall (STATE)
- 87 Strongly Landlord-Friendly
- State Florida
- 87 Strongly Landlord-Friendly · R+3
- County
- — inherits STATE
- City
- — inherits STATE
ZIP-level market 33813
- Rents YoY
- 1.8%
- Active inventory
- 344
- Price-to-rent
- 7.9×
Monthly cashflow live
- Estimated rent
- $1,581 high interval (Pro) →
- Mortgage (P&I)
- −$787
- Tax from tax record
- −$200 /mo · $2,398/yr
- Insurance
- −$62
- HOA
- −$41
- Vacancy / Maint / Mgmt
- −$332
- Net cashflow
- $159
Break-even live
UW: 25.0% down · 7.5% · 30yr · 1.5% tax · 5.0% vac · 8.0% maint · 8.0% mgmt
Financing live
Cash to close
- Down payment
- $37,500
- Closing costs
- $4,500
- Reserves months
- —
- Total cash needed
- —
Loan-product check · same deal, 3 products live
Conventional
25% down · 7.5% · 30yr
- Down + closing
- —
- Monthly P&I
- —
- Monthly cashflow
- —
- DSCR
- —
- Eligible?
- —
Personal DTI + credit; lowest rate.
DSCR
20% down · 8.5% · 30yr
- Down + closing
- —
- Monthly P&I
- —
- Monthly cashflow
- —
- DSCR
- —
- Eligible?
- —
No personal income docs; deal must DSCR.
Hard money
10% down · 12.0% · 12mo
- Down + closing
- —
- Monthly P&I
- —
- Monthly cashflow
- —
- DSCR
- —
- Eligible?
- —
Short-term bridge; refi at stabilization.
Rent comps 18 comps
| Address | Beds | Baths | Sqft | Rent | $/sqft | DOM | Units | Dist |
|---|---|---|---|---|---|---|---|---|
| 5133 Old Road 37 Mulberry, FL | 2.0 | 2.0 | 1050 | $1,565 | $1.49 | 3d | 1 | 0.26mi |
| 1028 Harden Ct Lakeland, FL | 2.0 | 2.0 | 891 | $1,200 | $1.35 | 23d | 1 | 0.42mi |
| 1115 Dosseywood Ln Lakeland, FL | 2.0 | 2.0 | 1239 | $1,650 | $1.33 | 3d | 1 | 0.51mi |
| 4917 Malibu Ct Lakeland, FL | 2.0 | 1.0 | 822 | $1,195 | $1.45 | 3d | 1 | 0.57mi |
| 1113 Pogonia Dr Lakeland, FL | 2.0 | 2.0 | 1408 | $1,795 | $1.27 | 23d | 1 | 0.59mi |
| 1106 Brook Meadow Dr Lakeland, FL | 3.0 | 2.0 | 1459 | $1,800 | $1.23 | 3d | 1 | 0.59mi |
| 1106 Brook Meadow Dr Lakeland, FL | 3.0 | 2.0 | 1459 | $1,900 | $1.30 | 23d | 1 | 0.59mi |
| 5527 Gaur Ln Lakeland, FL | 2.0 | 2.0 | 942 | $1,550 | $1.65 | 23d | 1 | 0.82mi |
| 1424 Bramblewood Dr Lakeland, FL | 3.0 | 2.0 | 1158 | $1,700 | $1.47 | 14d | 1 | 0.84mi |
| 1448 Marigold Dr Lakeland, FL | 3.0 | 2.0 | 1055 | $1,055 | $1.00 | 3d | 1 | 0.88mi |
| 1089 Old South Dr Lakeland, FL | 2.0 | 1.0 | 764 | $1,225 | $1.60 | 3d | 1 | 1.17mi |
| 4139 Old Road 37 Lakeland, FL | 2.0 | 2.0 | 900 | $1,295 | $1.44 | 3d | 1 | 1.18mi |
| 4139 Old Road 37 Lakeland, FL | 2.0 | 1.0 | 900 | $1,295 | $1.44 | 23d | 1 | 1.18mi |
| 1143 Old South Dr Lakeland, FL | 2.0 | 2.0 | 1008 | $1,299 | $1.29 | 3d | 1 | 1.19mi |
| 1105 Old South Dr Lakeland, FL | 2.0 | 1.0 | 1456 | $1,400 | $0.96 | 23d | 1 | 1.21mi |
| 4407 Highland Ln Unit 4407 Lakeland, FL | 2.0 | 1.0 | 850 | $1,395 | $1.64 | 23d | 1 | 1.22mi |
| 4416 Highland Ln Lakeland, FL | 2.0 | 1.5 | 1062 | $1,500 | $1.41 | 3d | 1 | 1.23mi |
| 901 Patriot Dr Lakeland, FL | 2.0 | 2.0 | 1170 | $1,680 | $1.44 | 3d | 15 | 1.34mi |
HOA detail
- Monthly dues
- $41 · $492/yr
Listing history 3 events
-
2026-05-15status Pending
-
2026-05-05$150,000 Active
-
1995-05-23soldstatus $55,400
ⓘ Source: listings_history table (triggers on properties + properties_extension) + one-shot
backfill from property_details.listing_events for pre-trigger history.
Tax reassessment forecast FL · Resets to sale price
- Current annual tax
- $2,398 · $200/mo
- Projected year-2 tax
- $2,398 · $200/mo
- Expected delta
- $0/yr ($0/mo · 0.0%)
ⓘ Screening estimate from a state-policy table — verify with the county assessor before closing.
Climate risk First Street
- Flood 1/10 Low FEMA zone X (unshaded) · 0% chance over 30 yrs
- Wildfire 1/10 Low
- Heat 8/10 Severe 7 d/yr ≥108°F today · 24 d/yr by 30 yrs out
- Wind 9/10 Extreme 99% chance of damaging wind over 30 yrs
- Air quality 2/10 Low 1 unhealthy d/yr today · 2 by 30 yrs out
Nearby sold comps map
Loading sold comps map…
Walkable amenities ~0.75 mi
Loading nearby amenities…
Taxation est. · year 1
- Rental income
- $18,972
- − Mortgage interest
- −$8,402
- − Property taxes
- −$2,398
- − Insurance
- −$750
- − Repairs & maintenance
- −$1,518
- − Management
- −$1,518
- − HOA
- −$492
- − Depreciation
- −$4,364
- Taxable loss
- −$469
- Est. tax savings @ 24.0%
- +$113
- After-tax cash flow
- $2,022/yr
For passive investors: Depreciation is non-cash, so a rental often shows a tax loss while cash-flowing — sheltering income. Rental losses are passive: they offset passive income freely, and up to $25,000/yr can offset ordinary (W-2) income if you actively participate and your MAGI is under $100k (phasing out to $0 by $150k); unused losses carry forward. On sale, claimed depreciation is recaptured at up to 25%, and gains may owe capital-gains tax (a 1031 exchange can defer both). Figures are a year-1 estimate at your 24.0% rate — not tax advice; consult a CPA.
Schools (NCES district)
- District
- Polk
- NCES district ID
- 1201590
- Math proficiency
- 39% ▼ -11.00%
- Reading proficiency
- 43% ▼ -4.00%
- Median HH income
- $43,979
- Composite
- 34.74/100
- National rank
- #5132
- State rank
- #62 of 73 in FL
Livability — Medulla
- Score
- 66/100
- State rank
- #601
- US rank
- #11528
Category grades
Schools grade is shown separately in the Schools card above.
Census & demographics
- Census place
- Medulla, FL
- County
- Polk County · 740,051 people
- Metro
- Lakeland-Winter Haven, FL
- Population (ZIP)
- 38,674
- Household income
- $99,497
- Rent vs Own
- Severe rent burden
- 778.0
Population outlook (Polk County) Hauer SSP2
- Today (2025)
- 752,975 people
- By 2030
- 804,621 · +6.9%
- By 2040
- 906,117 · +20.3%
- By 2050
- 1,000,476 · +32.9%
- By 2075
- 1,197,520 · +59.0%
- By 2100
- 1,271,518 · +68.9%
Race, ethnicity, and origin ACS 2023
- Neighborhood character
- Predominantly White (70%)
- Race & ethnicity
- White 70% Hispanic / Latino 17% Two or more races 10% Black 5% Asian 3%
- Hispanic origin (detail)
- Mexican 4% Puerto Rican 5% Cuban 3%
- Common ancestry
- Italian 3% Slovak 2% Lithuanian 2%
- Foreign-born
- 10% · Canada, China
- Languages at home
- 85% English-only · Spanish 11% Other Indo-European 2% Chinese 0%
Political lean MEDSL · Polk
- 2024 margin
- Strong R (+20.7) · D 39.2% · R 59.9%
- 2008→2024 swing
- -14.6pp toward R · 2008: -6.1pp · 2024: -20.7pp
- All cycles
- 2024: R+20.7 2020: R+14.4 2016: R+14.1 2012: R+6.8 2008: R+6.1
Not yet ingested
- Civics
- —
Market trends
- HPI YoY
- ▼ -224.20%
- Current HPI
- 296.1207
- Rent YoY
- ▲ 1.81%
- Metro
- Lakeland-Winter Haven, FL
- State GDP YoY
- ▲ 3.28%
- F500 in state
- 36
Industry mix (Fortune 500 HQ in FL)
| Industry | F500 HQs | Revenue |
|---|---|---|
| Industrial Technology | 2 | $29B |
|
||
| Insurance | 2 | $17B |
|
||
| Retail | 1 | $60B |
|
||
| Technology Distribution | 1 | $58B |
|
||
| Homebuilding | 1 | $35B |
|
||
| Technology Manufacturing | 1 | $35B |
|
||
Price history
+170.8% since first listed3 events — show timeline
- 2026-05-15 Pending — Stellar MLS as Distributed by MLS Grid
- 2026-05-05 Listed $150,000 Stellar MLS as Distributed by MLS Grid
- 1995-05-23 Sold (Public Records) $55,400 Public Records
Property tax history
+39.5%/yrLatest (2025): $2,398 · +92.2% YoY. Source: county tax records.
Cash-flow waterfall
monthlySold comps — $/sqft
last 12 mo · ≤1 miLoading sold comps…