336 E Alluvial Ave #98 · Fresno, CA
Flood risk 1/10 · Minimal
- FEMA flood zone
- X (unshaded)
- Chance of flooding over 30 yrs
- 0.0%
- Est. flood insurance / yr
- $507 – $1,088
Fire risk 6/10 · Moderate
- Est. fire insurance / yr
- $659 – $1,223
Heat risk 8/10 · Major
- Hot days now (above 105°F)
- 7 days/yr
- Hot days in 30 yrs
- 17 days/yr
Wind risk 1/10 · Minimal
- Chance of severe wind over 30 yrs
- —
Air-quality risk 10/10 · Severe
- Unhealthy air days now
- 48 days/yr
- Unhealthy air days in 30 yrs
- 50 days/yr
Risk factors via First Street. Map © Google.
Why this score? — see what drove the C+ grade
The composite is a weighted blend of 9 inputs, each scored 0–100. Each bar is that input's sub-score; the figure is the points it added to the 100-point composite (weight × sub-score).
- Cash flow +28.5/30.0
- DSCR +10.0/10.0
- 1% rule +7.9/10.0
- Schools +5.9/10.0
- Condition / age +4.0/5.0
- Livability +3.1/5.0
- Rent growth +3.0/5.0
- ARV discount +0.0/15.0
- Appreciation +0.0/10.0
$166,000
🖨 Deal sheet 📄 Offer letter ✓ Due diligence
Listing remarks MLS
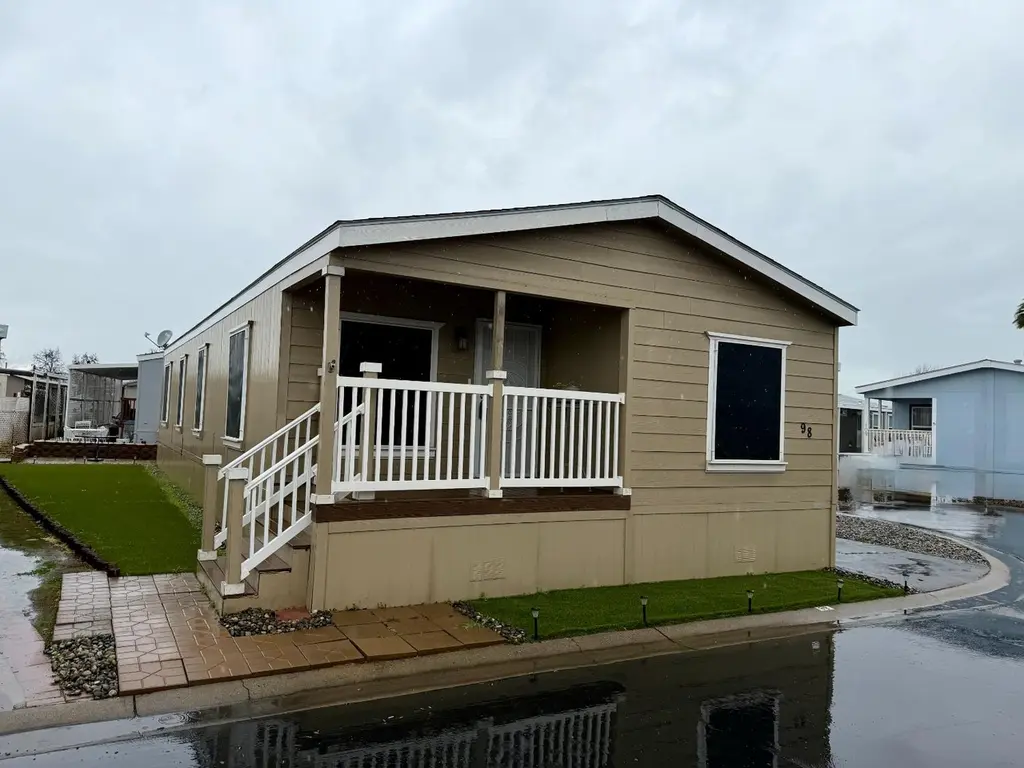
Located in the desirable San Joaquin Village Mobile Home Park across from Kaiser Permanente and minutes from River Park Shopping Center, this 2017-built manufactured home offers 1,288 sq. ft. of well-designed living space with 3 bedrooms and 2 full baths.The open layout features a spacious kitchen with island, extra storage, and pantry cabinet, plus a welcoming family room with a large electric freestanding fireplace (remote controlled) and space for a big-screen TV. Ceiling fans throughout, indoor laundry with storage, interior blinds with exterior privacy screens, and security doors on both entries add comfort and peace of mind.Enjoy low-maintenance landscaping with synthetic grass and rock, plus a 10x10 Tuff Shed for added storage. Move-in ready in a prime Fresno location!--
Key facts
- Dryer
- Lg washer
- Community pool
Tags
Neighborhood map
What this means for you Summary
Snapshot
- This is a 3-bed/2.0-bath manufactured listed at $166k. Condition is rated good.
Deal economics
- At list price, monthly cash flow is $541 ($6k/yr) — positive.
- The deal already cash-flows at list — no discount required.
- Meets the 1% rule at list price ($2k rent vs $166k).
- Recommended offer: $146k (12.0% below list) — sets the bar for market timing.
- Cap rate 10.2% vs local median 3.7% in Fresno — top-decile yield for the area; either an underpriced asset or a hidden risk that comps aren't pricing in. Stress-test before assuming the spread holds.
Location & tenants
- Location reads 62/100 on livability (#469 in CA) — a middle-class / working-renter tenant base. Strengths: commute A+, housing A+; Watch: amenities D+, employment D+, schools D.
- Clovis Unified (suburban): math 58% / reading 72% proficiency, ranked #152 of 1,400 in CA (top 11%) — acceptable for families but not a draw, mixed tenant base, ~2y average lease.
- Market conditions: Rents rising (+1.9%/yr); 176 active listings in the ZIP; 17 comparable units currently listed for rent nearby; rentals at typical pace (median 16d on market — plan ~3-4 weeks tenant-placement turnaround); solid renter incomes; 2,426 units permitted in Fresno County in 2024 (296 in 5+ unit buildings).
Forward outlook
- Local home prices are declining (-3.0%/yr); year-one equity from $1k of loan paydown is wiped out by about $5k of value loss. Plan a longer hold.
- Fresno County population projected at +11% by 2050 — modest demand growth; plan on rents tracking national, not racing it.
- At projected returns (-3.0% appreciation + 1.9% rent growth), your $46k cash investment doubles in ~10 years — after that, you're playing with house money.
Negotiation context
- It's been on market 122 days — a 12% lower offer ($146k) is reasonable based on typical stale-listing flexibility.
Risks & watch-outs
- Climate carrying-cost: major wildfire risk; extreme-heat days projected 7→17/yr by 2055 (HVAC capex compounding) — expect insurance premiums to compound above CPI over the hold.
Questions for the listing agent
- It's been on market 122 days. Have you received any prior offers? Is the seller open to a 12% concession, seller financing, or rate buy-down credit?
- Why hasn't it sold? Are there any deal-killer items the seller is aware of (foundation, flood, title, zoning, code violations)?
- Is there a deadline driving the sale (1031 exchange, divorce, estate, relocation)? That informs how much negotiation room exists.
- Schools are D-rated, which usually means shorter tenancies and higher turnover. Who's the typical renter profile here, and what's been the actual vacancy rate?
- Crime grade is F in this area — have there been break-ins, vandalism, or insurance claims at this property in the last 3 years? What carrier currently insures it and at what premium?
- What's the average days-on-market for RENTAL listings here right now (not sales)? A rising rental-DOM trend means longer vacancies and softer asking-rent achievability than the comps imply.
- What's the recent tenant-quality profile in this submarket — average credit score on applications, eviction rate, late-payment / NSF rate, and stable-employment percentage? A property-management company in the area should have these aggregated.
- How much new for-sale + rental construction is in the pipeline within 1–3 miles? Heavy new supply typically softens prices + rents 12–24 months out; constrained supply supports both.
Investment metrics
- 1% rule
- 1.29% ✓
- Cap rate
- 10.21%
- Cash-on-cash
- 13.98%
- DSCR
- 1.62
- GRM
- 6.5
CMA / ARV
- ARV (median comp)
- $117,500
- List price
- $166,000
- Delta
- 41.28%
- Verdict
- OVERPRICED
- Comps
- 14 within 1.0 mi
Show comp detail 12 sales within ~0.75 mi
| Address | Dist | Beds/Ba | Sqft | Sold | Price | $/sf | Match |
|---|---|---|---|---|---|---|---|
| 336 E Alluvial Ave #126 | 0.00mi | 4/2.0 (+1) | 1,344 (+4%) | 4mo | $65,000 | $48 | 85 |
| 336 E Alluvial Ave #161 | 0.00mi | 3/2.0 | 1,248 (-3%) | 13mo | $116,000 | $93 | 84 |
| 336 E Alluvial Ave #144 | 0.05mi | 3/2.0 | 1,394 (+8%) | 4mo | $200,000 | $143 | 80 |
| 336 E Alluvial #79 #79 | 0.00mi | 4/2.0 (+1) | 1,344 (+4%) | 12mo | $103,000 | $77 | 78 |
| 336 E Alluvial #79 #79 | 0.00mi | 4/2.0 (+1) | 1,344 (+4%) | 12mo | $103,000 | $77 | 78 |
| 336 E Alluvial #167 | 0.05mi | 3/2.0 | 1,440 (+12%) | 4mo | $90,000 | $63 | 75 |
| 336 E Alluvial Ave Spc 4 | 0.00mi | 2/2.0 (-1) | 1,440 (+12%) | 2mo | $110,000 | $76 | 74 |
| 336 E Alluvial Ave Spc 4 | 0.00mi | 2/2.0 (-1) | 1,440 (+12%) | 2mo | $110,000 | $76 | 74 |
| 336 E Alluvial #166 | 0.07mi | 3/2.0 | 1,440 (+12%) | 4mo | $131,500 | $91 | 74 |
| 336 E Alluvial Ave #67 | 0.00mi | 3/2.0 | 1,440 (+12%) | 12mo | $128,000 | $89 | 71 |
| 7676 N Fresno St #111 | 0.23mi | 2/2.0 (-1) | 1,248 (-3%) | 14mo | $116,000 | $93 | 67 |
| 7676 N Fresno St #75 | 0.23mi | 2/2.0 (-1) | 1,392 (+8%) | 19mo | $121,000 | $87 | 55 |
Match score weights: distance 35% · size 25% · config 20% · recency 20%. Top-matched comps best support the ARV.
Projected returns pro-forma
-3.0% appreciation · 1.91% rent growth · sell at horizon
- IRR
- 3.0%
- Equity multiple
- 1.11×
- Total profit
- $5,294
- Equity at exit
- $24,751
- IRR
- 11.5%
- Equity multiple
- 1.86×
- Total profit
- $39,830
- Equity at exit
- $14,353
Cash invested: $46,480 (down + closing). Projections, not guarantees.
Landlord ↔ Tenant lean methodology
- Overall (STATE)
- 18 Strongly Tenant-Friendly
- State California
- 18 Strongly Tenant-Friendly · D+13
- County
- — inherits STATE
- City
- — inherits STATE
ZIP-level market 93720
- Rents YoY
- 1.9%
- Active inventory
- 176
- Price-to-rent
- 6.5×
Monthly cashflow live
- Estimated rent
- $2,137 high interval (Pro) →
- Mortgage (P&I)
- −$871
- Tax est. 1.5%
- −$208 /mo · $2,490/yr
- Insurance
- −$69
- HOA
- −$0
- Vacancy / Maint / Mgmt
- −$449
- Net cashflow
- $541
Break-even live
UW: 25.0% down · 7.5% · 30yr · 1.5% tax · 5.0% vac · 8.0% maint · 8.0% mgmt
Financing live
Cash to close
- Down payment
- $41,500
- Closing costs
- $4,980
- Reserves months
- —
- Total cash needed
- —
Loan-product check · same deal, 3 products live
Conventional
25% down · 7.5% · 30yr
- Down + closing
- —
- Monthly P&I
- —
- Monthly cashflow
- —
- DSCR
- —
- Eligible?
- —
Personal DTI + credit; lowest rate.
DSCR
20% down · 8.5% · 30yr
- Down + closing
- —
- Monthly P&I
- —
- Monthly cashflow
- —
- DSCR
- —
- Eligible?
- —
No personal income docs; deal must DSCR.
Hard money
10% down · 12.0% · 12mo
- Down + closing
- —
- Monthly P&I
- —
- Monthly cashflow
- —
- DSCR
- —
- Eligible?
- —
Short-term bridge; refi at stabilization.
Rent comps 17 comps
| Address | Beds | Baths | Sqft | Rent | $/sqft | DOM | Units | Dist |
|---|---|---|---|---|---|---|---|---|
| 7579 N Angus St Unit 101 Fresno, CA | 2.0 | 2.0 | 1245 | $1,825 | $1.47 | 23d | 1 | 0.14mi |
| 7580 N Angus St Fresno, CA | 2.0 | 2.0 | 1350 | $1,900 | $1.41 | 43d | 1 | 0.15mi |
| 7722 N Angus St Fresno, CA | 1.0–2.0 | 1.0–2.0 | 820 | $1,575 | $1.92 | 3d | 1 | 0.30mi |
| 7511 N First St Fresno, CA | 1.0–3.0 | 1.0–2.5 | 1078 | $2,350 | $2.18 | 1d | 21 | 0.31mi |
| 7675 N First St Fresno, CA | 1.0–2.0 | 1.0–2.0 | 989 | $1,830 | $1.85 | 43d | 1 | 0.39mi |
| 875 E Cromwell Ave Fresno, CA | 3.0 | 2.0 | 1472 | $2,800 | $1.90 | 14d | 1 | 0.69mi |
| 8109 N 5th St Fresno, CA | 3.0 | 2.0 | 1750 | $2,350 | $1.34 | 2d | 1 | 0.86mi |
| 1050 E Fallbrook Ave Fresno, CA | 3.0 | 2.0 | 1457 | $2,750 | $1.89 | 23d | 1 | 0.92mi |
| 373 W Nees Ave Fresno, CA | 1.0–2.0 | 1.0–2.0 | 867 | $1,855 | $2.14 | 2d | 1 | 0.99mi |
| 6515 N Orchard St Fresno, CA | 3.0 | 2.0 | 1500 | $2,300 | $1.53 | 15d | 1 | 0.99mi |
| 445 W Nees Ave Fresno, CA | 1.0–2.0 | 1.0–2.0 | 847 | $1,820 | $2.15 | 1d | 10 | 1.12mi |
| 8476 N Del Mar Ave Fresno, CA | 4.0 | 2.0 | 1797 | $10,000 | $5.56 | 23d | 1 | 1.13mi |
| 8440 N Millbrook Ave Fresno, CA | 1.0–2.0 | 1.5–2.0 | 1002 | $2,000 | $2.00 | 43d | 1 | 1.28mi |
| 91 W Sierra Ave Fresno, CA | 3.0 | 1.5 | 1291 | $2,500 | $1.94 | 15d | 1 | 1.28mi |
| 8153 N Cedar Ave #212 Fresno, CA | 2.0 | 2.0 | 1141 | $1,750 | $1.53 | 23d | 1 | 1.40mi |
| 7350 N Cedar Ave Fresno, CA | 2.0 | 1.0 | 915 | $1,816 | $1.98 | 1d | 2 | 1.44mi |
| 135 E Stuart Ave Fresno, CA | 3.0 | 1.0 | 1120 | $1,995 | $1.78 | 3d | 1 | 1.46mi |
Listing history 18 events
-
2026-06-18days on market $166,000 Active 122 DOM
-
2026-06-17days on market $166,000 Active 121 DOM
-
2026-06-16days on market $166,000 Active 120 DOM
-
2026-06-15price $166,000 Active 119 DOM
-
2026-06-15days on market $175,000 Active 119 DOM
-
2026-06-13days on market $175,000 Active 117 DOM
-
2026-06-13days on market $175,000 Active 116 DOM
-
2026-06-10days on market $175,000 Active 114 DOM
-
2026-06-09days on market $175,000 Active 113 DOM
-
2026-06-08days on market $175,000 Active 112 DOM
-
2026-06-07pricedays on market $175,000 Active 111 DOM
-
2026-06-05days on market $182,500 Active 108 DOM
-
2026-06-03days on market $182,500 Active 107 DOM
-
2026-06-02days on market $182,500 Active 106 DOM
-
2026-06-01days on market $182,500 Active 105 DOM
-
2026-05-31days on market $182,500 Active 104 DOM
-
2026-04-10price $182,500 788-char remark
Show marketing remark (788 chars)
Located in the desirable San Joaquin Village Mobile Home Park across from Kaiser Permanente and minutes from River Park Shopping Center, this 2017-built manufactured home offers 1,288 sq. ft. of well-designed living space with 3 bedrooms and 2 full baths.The open layout features a spacious kitchen with island, extra storage, and pantry cabinet, plus a welcoming family room with a large electric freestanding fireplace (remote controlled) and space for a big-screen TV. Ceiling fans throughout, indoor laundry with storage, interior blinds with exterior privacy screens, and security doors on both entries add comfort and peace of mind.Enjoy low-maintenance landscaping with synthetic grass and rock, plus a 10x10 Tuff Shed for added storage. Move-in ready in a prime Fresno location!--
-
2026-02-16$200,000 Active 788-char remark
Show marketing remark (788 chars)
Located in the desirable San Joaquin Village Mobile Home Park across from Kaiser Permanente and minutes from River Park Shopping Center, this 2017-built manufactured home offers 1,288 sq. ft. of well-designed living space with 3 bedrooms and 2 full baths.The open layout features a spacious kitchen with island, extra storage, and pantry cabinet, plus a welcoming family room with a large electric freestanding fireplace (remote controlled) and space for a big-screen TV. Ceiling fans throughout, indoor laundry with storage, interior blinds with exterior privacy screens, and security doors on both entries add comfort and peace of mind.Enjoy low-maintenance landscaping with synthetic grass and rock, plus a 10x10 Tuff Shed for added storage. Move-in ready in a prime Fresno location!--
ⓘ Source: listings_history table (triggers on properties + properties_extension) + one-shot
backfill from property_details.listing_events for pre-trigger history.
Climate risk First Street
- Flood 1/10 Low FEMA zone X (unshaded) · 0% chance over 30 yrs
- Wildfire 6/10 Major
- Heat 8/10 Severe 7 d/yr ≥105°F today · 17 d/yr by 30 yrs out
- Wind 1/10 Low
- Air quality 10/10 Extreme 48 unhealthy d/yr today · 50 by 30 yrs out
Nearby sold comps map
Loading sold comps map…
Walkable amenities ~0.75 mi
Loading nearby amenities…
Taxation est. · year 1
- Rental income
- $25,649
- − Mortgage interest
- −$9,299
- − Property taxes
- −$2,490
- − Insurance
- −$830
- − Repairs & maintenance
- −$2,052
- − Management
- −$2,052
- − Depreciation
- −$4,829
- Taxable income
- $4,097
- Est. tax owed @ 24.0%
- −$983
- After-tax cash flow
- $5,513/yr
For passive investors: Depreciation is non-cash, so a rental often shows a tax loss while cash-flowing — sheltering income. Rental losses are passive: they offset passive income freely, and up to $25,000/yr can offset ordinary (W-2) income if you actively participate and your MAGI is under $100k (phasing out to $0 by $150k); unused losses carry forward. On sale, claimed depreciation is recaptured at up to 25%, and gains may owe capital-gains tax (a 1031 exchange can defer both). Figures are a year-1 estimate at your 24.0% rate — not tax advice; consult a CPA.
Condition & rehab AI · 12 photos
This 2017-built manufactured home in San Joaquin Village Mobile Home Park is in good condition with a good condition score of 80. It has a good kitchen, bathrooms, exterior, flooring, and systems. The home is move-in ready with minor maintenance items to address. The highest-ROI updates would be painting the interior walls, replacing outdoor light fixtures, and replacing the blinds.
Value-add opportunities
- Both Paint interior walls — Fresh paint can enhance the home's curb appeal and interior aesthetics.
- Both Replace outdoor light fixtures — Upgrading the outdoor lighting can improve the home's curb appeal and safety.
- Both Replace blinds — Clean and updated blinds can improve the home's curb appeal and interior aesthetics.
Renovation cost estimate screening
Value-add ROI direction
- Both Paint interior walls — Fresh paint can enhance the home's curb appeal and interior aesthetics. ↑
- Both Replace outdoor light fixtures — Upgrading the outdoor lighting can improve the home's curb appeal and safety. ↑
- Both Replace blinds — Clean and updated blinds can improve the home's curb appeal and interior aesthetics. ↑
ⓘ Cost ranges are severity-bucket heuristics (US national rule-of-thumb). Get contractor quotes + a written scope before underwriting a rehab budget.
Schools (NCES district)
- District
- Clovis Unified
- NCES district ID
- 0609030
- Math proficiency
- 58% ▲ 1.00%
- Reading proficiency
- 72% ▲ 2.00%
- Median HH income
- $71,950
- Composite
- 58.7/100
- National rank
- #2003
- State rank
- #152 of 1400 in CA
Livability — Fresno
- Score
- 62/100
- State rank
- #469
- US rank
- #15907
Category grades
Schools grade is shown separately in the Schools card above.
Census & demographics
- Census place
- Fresno, CA
- County
- Fresno County · 834,801 people
- City population
- 593,114
- Metro
- Fresno, CA
- Population (ZIP)
- 50,089
- Household income
- $105,050
- Rent vs Own
- Severe rent burden
- 1796.0
Population outlook (Fresno County) Hauer SSP2
- Today (2025)
- 1,042,971 people
- By 2030
- 1,072,198 · +2.8%
- By 2040
- 1,122,408 · +7.6%
- By 2050
- 1,157,251 · +11.0%
- By 2075
- 1,182,575 · +13.4%
- By 2100
- 1,105,899 · +6.0%
Race, ethnicity, and origin ACS 2023
- Neighborhood character
- Diverse neighborhood (Simpson 0.67)
- Race & ethnicity
- White 48% Hispanic / Latino 28% Two or more races 16% Asian 16% Black 3%
- Hispanic origin (detail)
- Mexican 24%
- Common ancestry
- Russian 2% Slovak 1% Italian 1%
- Foreign-born
- 17% · Canada, China, Vietnam
- Languages at home
- 73% English-only · Spanish 10% Other Indo-European 6% Tagalog/Filipino 2%
Political lean MEDSL · Fresno
- 2024 margin
- Toss-up / Even · D 46.5% · R 50.9% · Other 2.6%
- 2008→2024 swing
- -6.5pp toward R · 2008: 2.1pp · 2024: -4.4pp
- All cycles
- 2024: R+4.4 2020: D+7.8 2016: D+3.9 2012: R+2.9 2008: D+2.1
Not yet ingested
- Civics
- —
Market trends
- HPI YoY
- ▼ -278.23%
- Current HPI
- 332.618
- Rent YoY
- ▲ 1.91%
- Metro
- Fresno, CA
- State GDP YoY
- ▲ 3.21%
- F500 in state
- 116
Industry mix (Fortune 500 HQ in CA)
| Industry | F500 HQs | Revenue |
|---|---|---|
| Technology | 27 | $1,492B |
|
||
| Financial Services | 3 | $174B |
|
||
| Retail | 3 | $44B |
|
||
| Insurance | 3 | $26B |
|
||
| Media / Entertainment | 2 | $115B |
|
||
| Pharmaceuticals / Biotech | 2 | $62B |
|
||
Price history
-8.8% since first listed2 events — show timeline
- 2026-04-10 Price Changed $182,500 FRESNOMLS
- 2026-02-16 Listed $200,000 FRESNOMLS
Cash-flow waterfall
monthlySold comps — $/sqft
last 12 mo · ≤1 miLoading sold comps…