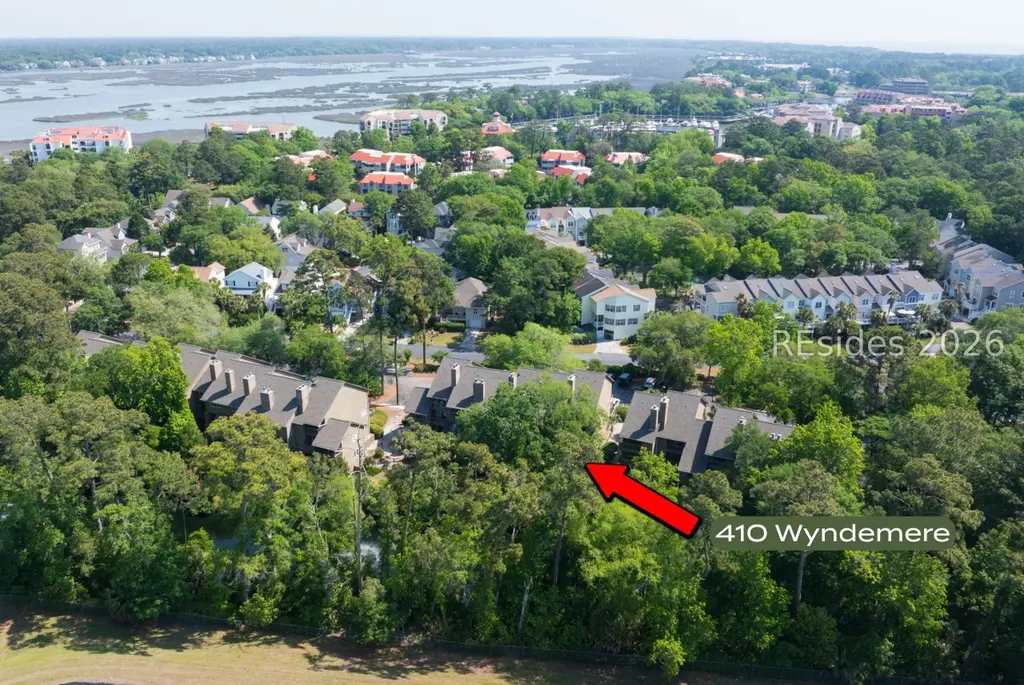
50 Yacht Cove Dr #410 · Hilton Head Island, SC
Flood risk No data
- FEMA flood zone
- —
- Chance of flooding over 30 yrs
- —
- Est. flood insurance / yr
- —
Fire risk No data
- Est. fire insurance / yr
- —
Heat risk No data
- Hot days now (above threshold)
- —
- Hot days in 30 yrs
- —
Wind risk No data
- Chance of severe wind over 30 yrs
- —
Air-quality risk No data
- Unhealthy air days now
- —
- Unhealthy air days in 30 yrs
- —
Risk factors via First Street. Map © Google.
Why this score? — see what drove the C+ grade
The composite is a weighted blend of 9 inputs, each scored 0–100. Each bar is that input's sub-score; the figure is the points it added to the 100-point composite (weight × sub-score).
- Cash flow +17.1/30.0
- ARV discount +14.4/15.0
- Appreciation +6.6/10.0
- DSCR +5.3/10.0
- Schools +4.1/10.0
- 1% rule +3.6/10.0
- Rent growth +3.3/5.0
- Livability +3.2/5.0
- Condition / age +2.5/5.0
$349,900
🖨 Deal sheet 📄 Offer letter ✓ Due diligence
Listing remarks MLS
JUST COMPLETELY RENOVATED, PRICED TO SELL, AND READY FOR IMMEDIATE OCCUPANCY. NEW CARPET, PAINT, FIXTURES AND MORE! This is the obvious value in Wyndemere!
Key facts
- Lagoon front retreat
- Private deck
- Community pool
Tags
Property features AI
Finance
- Other: Pets allowed (dogs OK; owner approval; limits on number and size)
- HOA & community: Association management; Common area maintenance; Grounds maintenance; Structure maintenance; Pest control; Sewer included; Trash included; Water included; Flood insurance included; Clubhouse; Pool; Trails
Exterior
- Parking: Assigned parking
- Security: Closed-circuit cameras; Security guard; Fire sprinkler system; Smoke detectors
- Utilities: Public water
- Home design: Condominium (unit); Balcony/porch entry
- Construction: Asphalt roof
- Exterior features: Balcony; Front porch; Rear porch; Patio; Community pool; Has view
Interior
- Kitchen: Dishwasher; Microwave; Oven; Range; Refrigerator
- Flooring: Luxury vinyl plank
- Bathrooms: 2 full bathrooms
- Heating & cooling: Central heating (electric, heat pump); Central cooling (electric, heat pump)
- Interior features: Ceiling fans; Smooth ceilings; Cable TV; Window treatments; Entrance foyer; Furnished
- Laundry & utility: Washer; Dryer
Neighborhood map
What this means for you Summary
Snapshot
- This is a 2-bed/2.0-bath condo listed at $350k.
Deal economics
- At list price, monthly cash flow is $241 ($3k/yr) — positive.
- The deal already cash-flows at list — no discount required.
- To meet the 1% rule (rent ≥ 1% of price), the offer needs to be $300k (14.3% below list).
- Recommended offer: $300k (14.3% below list) — sets the bar for 1% rule.
- Cap rate 7.1% vs local median 3.0% in Hilton Head Island — top-decile yield for the area; either an underpriced asset or a hidden risk that comps aren't pricing in. Stress-test before assuming the spread holds.
Location & tenants
- Location reads 64/100 on livability (#157 in SC) — a middle-class / working-renter tenant base. Strengths: employment A+, crime A-; Watch: amenities F, commute F, cost of living F.
- Beaufort 01 (town): math 42% / reading 51% proficiency, ranked #17 of 80 in SC (top 21%) — families likely to look elsewhere, expect single-tenant / working-renter base with shorter leases.
- Market conditions: Rents rising (+3.2%/yr); 838 active listings in the ZIP; 1 comparable units currently listed for rent nearby; solid renter incomes; 1,824 units permitted in Beaufort County in 2024 (618 in 5+ unit buildings).
- This rent runs 37% of the median local income ($98k/yr) — at the standard rent-burdened threshold; future hikes will face affordability resistance.
Forward outlook
- In year one you build about $14k of equity ($2k loan paydown + $11k appreciation (3.2% local appreciation)).
- Beaufort County population projected at +30% by 2050 — long-run rental-demand tailwind backs the buy-and-hold thesis.
- At projected returns (3.2% appreciation + 3.2% rent growth), your $98k cash investment doubles in ~6 years — after that, you're playing with house money.
- By year 3, paydown + projected appreciation supports a ~$34k cash-out refi (75% LTV) — recoverable capital for the next deal without selling this one.
Negotiation context
- It's been on market 54 days — a 3% lower offer ($339k) is reasonable based on typical stale-listing flexibility.
- 2 sale attempts since 20y ago with the ask held roughly flat each time — persistent listings suggest the price (not the market) is what's stuck; bring a comps-based counter.
- Current owner paid $135k; list at $350k implies a 159% gain — meaningful room to come down on a strong offer.
Questions for the listing agent
- It's been on market 54 days. Have you received any prior offers? Is the seller open to a 14% concession, seller financing, or rate buy-down credit?
- Any open or pending special assessments — roof, HVAC, plumbing, elevator, façade? What's the per-unit balance and payoff schedule, and is the seller paying it off at close or rolling it to the buyer?
- Is there a deadline driving the sale (1031 exchange, divorce, estate, relocation)? That informs how much negotiation room exists.
- Schools are B-rated — typically a magnet for longer-tenancy family renters. What's the average tenant stay here, and is there a school-zone premium baked into asking?
- What's the average days-on-market for RENTAL listings here right now (not sales)? A rising rental-DOM trend means longer vacancies and softer asking-rent achievability than the comps imply.
- What's the recent tenant-quality profile in this submarket — average credit score on applications, eviction rate, late-payment / NSF rate, and stable-employment percentage? A property-management company in the area should have these aggregated.
- How much new apartment / multifamily construction is in the pipeline within 1–3 miles? Heavy new supply (>2% of stock underway) typically softens rents 12–24 months out; light construction supports rent growth.
Investment metrics
- 1% rule
- 0.86% ✗
- Cap rate
- 7.12%
- Cash-on-cash
- 2.95%
- DSCR
- 1.13
- GRM
- 9.7
CMA / ARV
- ARV (median comp)
- $413,241
- List price
- $349,900
- Delta
- -15.33%
- Verdict
- UNDERPRICED
- Comps
- 20 within 1.0 mi
Projected returns pro-forma
3.21% appreciation · 3.23% rent growth · sell at horizon
- IRR
- 10.9%
- Equity multiple
- 1.63×
- Total profit
- $61,908
- Equity at exit
- $161,433
- IRR
- 13.1%
- Equity multiple
- 2.99×
- Total profit
- $195,016
- Equity at exit
- $252,024
Cash invested: $97,972 (down + closing). Projections, not guarantees.
Landlord ↔ Tenant lean methodology
- Overall (STATE)
- 90 Strongly Landlord-Friendly
- State South Carolina
- 90 Strongly Landlord-Friendly · R+6
- County
- — inherits STATE
- City
- — inherits STATE
ZIP-level market 29928
- Home prices YoY
- 1.3%
- Rents YoY
- 3.2%
- Active inventory
- 838
- Price-to-rent
- 9.7×
Monthly cashflow live
- Estimated rent
- $2,998 medium interval (Pro) →
- Mortgage (P&I)
- −$1,835
- Tax from tax record
- −$147 /mo · $1,763/yr
- Insurance
- −$146
- HOA
- −$0
- Vacancy / Maint / Mgmt
- −$630
- Net cashflow
- $241
Break-even live
UW: 25.0% down · 7.5% · 30yr · 1.5% tax · 5.0% vac · 8.0% maint · 8.0% mgmt
Financing live
Cash to close
- Down payment
- $87,475
- Closing costs
- $10,497
- Reserves months
- —
- Total cash needed
- —
Loan-product check · same deal, 3 products live
Conventional
25% down · 7.5% · 30yr
- Down + closing
- —
- Monthly P&I
- —
- Monthly cashflow
- —
- DSCR
- —
- Eligible?
- —
Personal DTI + credit; lowest rate.
DSCR
20% down · 8.5% · 30yr
- Down + closing
- —
- Monthly P&I
- —
- Monthly cashflow
- —
- DSCR
- —
- Eligible?
- —
No personal income docs; deal must DSCR.
Hard money
10% down · 12.0% · 12mo
- Down + closing
- —
- Monthly P&I
- —
- Monthly cashflow
- —
- DSCR
- —
- Eligible?
- —
Short-term bridge; refi at stabilization.
Rent comps 1 comps
| Address | Beds | Baths | Sqft | Rent | $/sqft | DOM | Units | Dist |
|---|---|---|---|---|---|---|---|---|
| 125 Shipyard Dr #148 Hilton Head Island, SC | 3.0 | 3.0 | 1400 | $3,200 | $2.29 | 43d | 1 | 1.48mi |
HOA detail condo
- Monthly dues
- $0 · $0/yr
- Assessments
- None detected in remarks — confirm with the listing agent.
Listing history 23 events
-
2026-06-18days on market $349,900 Active 54 DOM
-
2026-06-17days on market $349,900 Active 53 DOM
-
2026-06-16days on market $349,900 Active 52 DOM
-
2026-06-15days on market $349,900 Active 51 DOM
-
2026-06-14days on market $349,900 Active 49 DOM
-
2026-06-13days on market $349,900 Active 48 DOM
-
2026-06-10days on market $349,900 Active 46 DOM
-
2026-06-09days on market $349,900 Active 45 DOM
-
2026-06-08days on market $349,900 Active 44 DOM
-
2026-06-07days on market $349,900 Active 43 DOM
-
2026-06-05days on market $349,900 Active 40 DOM
-
2026-06-03days on market $349,900 Active 39 DOM
-
2026-06-02days on market $349,900 Active 38 DOM
-
2026-06-01days on market $349,900 Active 37 DOM
-
2026-05-31days on market $349,900 Active 36 DOM
-
2026-04-25$349,900 Active 1221-char remark
-
2008-07-29soldstatus $135,000
-
2008-07-25soldstatus $135,000 156-char remark
Show marketing remark (156 chars)
JUST COMPLETELY RENOVATED, PRICED TO SELL, AND READY FOR IMMEDIATE OCCUPANCY. NEW CARPET, PAINT, FIXTURES AND MORE! This is the obvious value in Wyndemere!
-
2008-07-25soldstatus $135,000
Show marketing remark (156 chars)
JUST COMPLETELY RENOVATED, PRICED TO SELL, AND READY FOR IMMEDIATE OCCUPANCY. NEW CARPET, PAINT, FIXTURES AND MORE! This is the obvious value in Wyndemere!
-
2006-10-31$165,000 156-char remark
Show marketing remark (156 chars)
JUST COMPLETELY RENOVATED, PRICED TO SELL, AND READY FOR IMMEDIATE OCCUPANCY. NEW CARPET, PAINT, FIXTURES AND MORE! This is the obvious value in Wyndemere!
-
1995-01-25soldstatus $76,000
-
1987-04-01soldstatus $122,000
-
1987-04-01soldstatus $91,900
ⓘ Source: listings_history table (triggers on properties + properties_extension) + one-shot
backfill from property_details.listing_events for pre-trigger history.
Tax reassessment forecast SC · Resets to sale price
- Current annual tax
- $1,763 · $147/mo
- Projected year-2 tax
- $1,994 · $166/mo
- Expected delta
- +$231/yr (+$19/mo · 13.1%)
ⓘ Screening estimate from a state-policy table — verify with the county assessor before closing.
Nearby sold comps map
Loading sold comps map…
Walkable amenities ~0.75 mi
Loading nearby amenities…
Taxation est. · year 1
- Rental income
- $35,977
- − Mortgage interest
- −$19,600
- − Property taxes
- −$1,763
- − Insurance
- −$1,750
- − Repairs & maintenance
- −$2,878
- − Management
- −$2,878
- − Depreciation
- −$10,179
- Taxable loss
- −$3,071
- Est. tax savings @ 24.0%
- +$737
- After-tax cash flow
- $3,627/yr
For passive investors: Depreciation is non-cash, so a rental often shows a tax loss while cash-flowing — sheltering income. Rental losses are passive: they offset passive income freely, and up to $25,000/yr can offset ordinary (W-2) income if you actively participate and your MAGI is under $100k (phasing out to $0 by $150k); unused losses carry forward. On sale, claimed depreciation is recaptured at up to 25%, and gains may owe capital-gains tax (a 1031 exchange can defer both). Figures are a year-1 estimate at your 24.0% rate — not tax advice; consult a CPA.
Schools (NCES district)
- District
- Beaufort 01
- NCES district ID
- 4501110
- Math proficiency
- 42% ▼ -8.00%
- Reading proficiency
- 51% ▲ 2.00%
- Median HH income
- $57,430
- Composite
- 40.56/100
- National rank
- #3699
- State rank
- #17 of 80 in SC
Livability — Hilton Head Island
- Score
- 64/100
- State rank
- #157
- US rank
- #14648
Category grades
Schools grade is shown separately in the Schools card above.
Census & demographics
- Census place
- Hilton Head Island, SC
- County
- Beaufort County · 163,770 people
- City population
- 40,243
- Metro
- Hilton Head Island-Bluffton, SC
- Population (ZIP)
- 15,785
- Household income
- $97,576
- Rent vs Own
- Severe rent burden
- 216.0
Population outlook (Beaufort County) Hauer SSP2
- Today (2025)
- 211,915 people
- By 2030
- 227,272 · +7.2%
- By 2040
- 253,861 · +19.8%
- By 2050
- 275,126 · +29.8%
- By 2075
- 311,022 · +46.8%
- By 2100
- 321,286 · +51.6%
Race, ethnicity, and origin ACS 2023
- Neighborhood character
- Predominantly White (87%)
- Race & ethnicity
- White 87% Hispanic / Latino 6% Two or more races 2% Black 2% Asian 1%
- Hispanic origin (detail)
- Mexican 3%
- Common ancestry
- Lithuanian 4% Slovak 4% Romanian 4%
- Foreign-born
- 9% · Canada, China
- Languages at home
- 91% English-only · Spanish 5% French/Haitian/Cajun 1% Chinese 1%
Political lean MEDSL · Beaufort
- 2024 margin
- R (+14.5) · D 42.1% · R 56.6% · Other 1.2%
- 2008→2024 swing
- -3.7pp toward R · 2008: -10.8pp · 2024: -14.5pp
- All cycles
- 2024: R+14.5 2020: R+10.0 2016: R+14.3 2012: R+17.5 2008: R+10.8
Not yet ingested
- Civics
- —
Market trends
- HPI YoY
- ▲ 3.21%
- Current HPI
- 243.4136
- Rent YoY
- ▲ 3.23%
- Metro
- Hilton Head Island-Bluffton, SC
- State GDP YoY
- ▲ 4.51%
- F500 in state
- 2
Industry mix (Fortune 500 HQ in SC)
| Industry | F500 HQs | Revenue |
|---|---|---|
| Packaging | 1 | $7B |
|
||
Price history
+186.8% since first listed8 events — show timeline
- 2026-04-25 Listed $349,900 RSMLS
- 2008-07-29 Sold (Public Records) $135,000 Public Records
- 2008-07-25 Sold (Public Records) $135,000 Public Records
- 2008-07-25 Sold (MLS) $135,000 RSMLS
- 2006-10-31 Listed $165,000 RSMLS
- 1995-01-25 Sold (Public Records) $76,000 Public Records
- 1987-04-01 Sold (Public Records) $91,900 Public Records
- 1987-04-01 Sold (Public Records) $122,000 Public Records
Property tax history
+4.4%/yrLatest (2025): $1,763 · +1.3% YoY. Source: county tax records.
Cash-flow waterfall
monthlySold comps — $/sqft
last 12 mo · ≤1 miLoading sold comps…