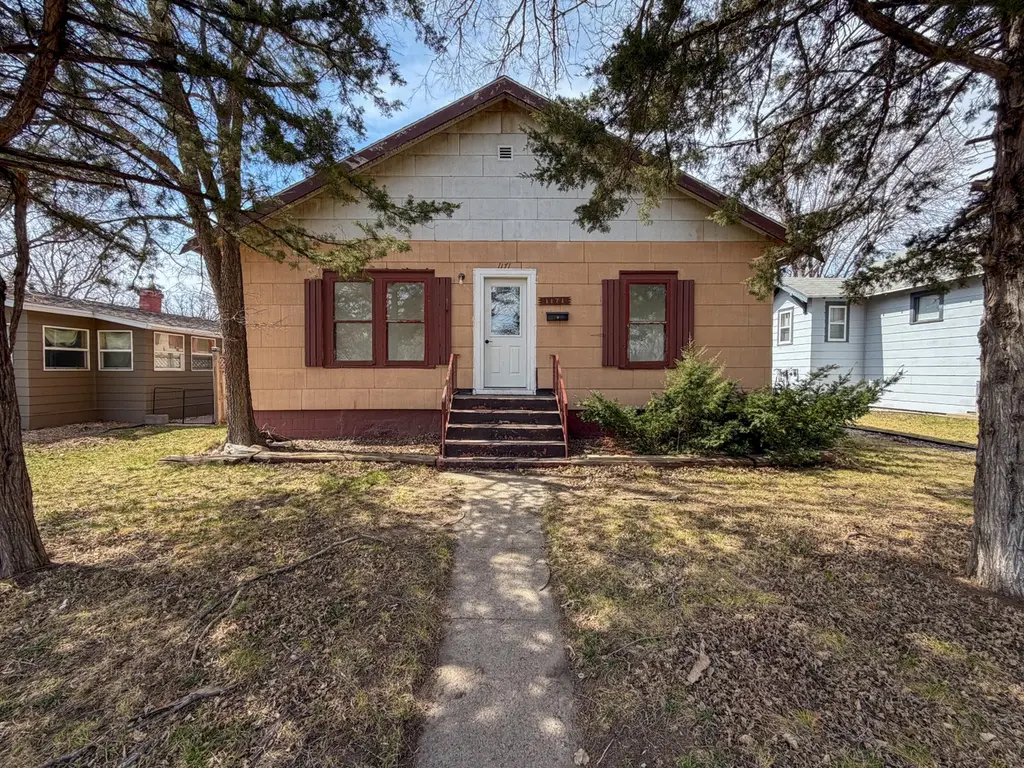
1171 Frank Ave SE · Huron, SD
Flood risk 1/10 · Minimal
- FEMA flood zone
- X (unshaded)
- Chance of flooding over 30 yrs
- 0.0%
- Est. flood insurance / yr
- $473 – $860
Fire risk 4/10 · Minor
- Est. fire insurance / yr
- $1,342 – $2,492
Heat risk 3/10 · Minor
- Hot days now (above 100°F)
- 7 days/yr
- Hot days in 30 yrs
- 14 days/yr
Wind risk 2/10 · Minimal
- Chance of severe wind over 30 yrs
- —
Air-quality risk 2/10 · Minimal
- Unhealthy air days now
- 1 days/yr
- Unhealthy air days in 30 yrs
- 1 days/yr
Risk factors via First Street. Map © Google.
Why this score? — see what drove the B- grade
The composite is a weighted blend of 9 inputs, each scored 0–100. Each bar is that input's sub-score; the figure is the points it added to the 100-point composite (weight × sub-score).
- Cash flow +30.0/30.0
- 1% rule +10.0/10.0
- DSCR +10.0/10.0
- ARV discount +7.5/15.0
- Livability +3.6/5.0
- Schools +3.1/10.0
- Rent growth +2.5/5.0
- Condition / age +2.5/5.0
- Appreciation +0.0/10.0
$85,000
🖨 Deal sheet 📄 Offer letter ✓ Due diligence
Listing remarks MLS
3-bedroom, 1-bath home located on Frank Ave, which is a designated emergency snow route. This property features off-street parking and has been updated with a newer roof, brand-new flooring, and fresh interior paint throughout. A great opportunity for homeowners or investors looking for an affordable, move in ready home!
Key facts
- Brand-new flooring
- Newer roof
- Fresh interior paint
Tags
Neighborhood map
What this means for you Summary
Snapshot
- This is a 3-bed/1.0-bath other listed at $85k.
Deal economics
- At list price, monthly cash flow is $511 ($6k/yr) — positive.
- The deal already cash-flows at list — no discount required.
- Meets the 1% rule at list price ($1k rent vs $85k).
- Recommended offer: $84k (1.5% below list) — sets the bar for market timing.
- Cap rate 13.5% vs local median 4.0% in Huron — top-decile yield for the area; either an underpriced asset or a hidden risk that comps aren't pricing in. Stress-test before assuming the spread holds.
Location & tenants
- Location reads 72/100 on livability (#48 in SD) — a middle-class / working-renter tenant base. Strengths: cost of living A+, housing A+; Watch: employment C-, health & safety C-, schools D-.
- Huron School District 02-2 (town): math 30% / reading 44% proficiency, ranked #55 of 59 in SD (top 93%) — families likely to look elsewhere, expect single-tenant / working-renter base with shorter leases.
- Market conditions: 149 active listings in the ZIP; 30 units permitted in Beadle County in 2024 (6 in 5+ unit buildings).
Forward outlook
- Local home prices are declining (-3.0%/yr); year-one equity from $588 of loan paydown is wiped out by about $3k of value loss. Plan a longer hold.
- Beadle County population projected at +39% by 2050 — long-run rental-demand tailwind backs the buy-and-hold thesis.
- At projected returns (-3.0% appreciation + 3.0% rent growth), your $24k cash investment doubles in ~5 years — after that, you're playing with house money.
Negotiation context
- It's been on market 30 days — a 2% lower offer ($84k) is reasonable based on typical stale-listing flexibility.
- 2 sale attempts since 4y ago with the ask held roughly flat each time — persistent listings suggest the price (not the market) is what's stuck; bring a comps-based counter.
- Current owner paid $60k; 42% above their basis — modest negotiation headroom, anchor on the comps not their cost.
Risks & watch-outs
- Watch-outs: built in 1925 — expect roof / HVAC / electrical / plumbing capex.
Questions for the listing agent
- Built in 1925 — when were the roof, HVAC, electrical panel, plumbing, and water heater last replaced?
- Is there a deadline driving the sale (1031 exchange, divorce, estate, relocation)? That informs how much negotiation room exists.
- Schools are D-rated, which usually means shorter tenancies and higher turnover. Who's the typical renter profile here, and what's been the actual vacancy rate?
- What's the average days-on-market for RENTAL listings here right now (not sales)? A rising rental-DOM trend means longer vacancies and softer asking-rent achievability than the comps imply.
- What's the recent tenant-quality profile in this submarket — average credit score on applications, eviction rate, late-payment / NSF rate, and stable-employment percentage? A property-management company in the area should have these aggregated.
- How much new for-sale + rental construction is in the pipeline within 1–3 miles? Heavy new supply typically softens prices + rents 12–24 months out; constrained supply supports both.
Investment metrics
- 1% rule
- 1.60% ✓
- Cap rate
- 13.51%
- Cash-on-cash
- 25.77%
- DSCR
- 2.15
- GRM
- 5.2
CMA / ARV
No comps found within radius.
Projected returns pro-forma
-3.0% appreciation · 3.0% rent growth · sell at horizon
- IRR
- 19.4%
- Equity multiple
- 1.79×
- Total profit
- $18,785
- Equity at exit
- $12,674
- IRR
- 27.7%
- Equity multiple
- 3.45×
- Total profit
- $58,302
- Equity at exit
- $7,349
Cash invested: $23,800 (down + closing). Projections, not guarantees.
Landlord ↔ Tenant lean methodology
- Overall (STATE)
- 83 Strongly Landlord-Friendly
- State South Dakota
- 83 Strongly Landlord-Friendly · R+16
- County
- — inherits STATE
- City
- — inherits STATE
ZIP-level market 57350
- Active inventory
- 149
- Price-to-rent
- 5.2×
Monthly cashflow live
- Estimated rent
- $1,363 medium interval (Pro) →
- Mortgage (P&I)
- −$446
- Tax from tax record
- −$84 /mo · $1,012/yr
- Insurance
- −$35
- HOA
- −$0
- Vacancy / Maint / Mgmt
- −$286
- Net cashflow
- $511
Break-even live
UW: 25.0% down · 7.5% · 30yr · 1.5% tax · 5.0% vac · 8.0% maint · 8.0% mgmt
Financing live
Cash to close
- Down payment
- $21,250
- Closing costs
- $2,550
- Reserves months
- —
- Total cash needed
- —
Loan-product check · same deal, 3 products live
Conventional
25% down · 7.5% · 30yr
- Down + closing
- —
- Monthly P&I
- —
- Monthly cashflow
- —
- DSCR
- —
- Eligible?
- —
Personal DTI + credit; lowest rate.
DSCR
20% down · 8.5% · 30yr
- Down + closing
- —
- Monthly P&I
- —
- Monthly cashflow
- —
- DSCR
- —
- Eligible?
- —
No personal income docs; deal must DSCR.
Hard money
10% down · 12.0% · 12mo
- Down + closing
- —
- Monthly P&I
- —
- Monthly cashflow
- —
- DSCR
- —
- Eligible?
- —
Short-term bridge; refi at stabilization.
Listing history 5 events
-
2026-05-08status Pending 322-char remark
Show marketing remark (322 chars)
3-bedroom, 1-bath home located on Frank Ave, which is a designated emergency snow route. This property features off-street parking and has been updated with a newer roof, brand-new flooring, and fresh interior paint throughout. A great opportunity for homeowners or investors looking for an affordable, move in ready home!
-
2026-04-08$85,000 Active 322-char remark
Show marketing remark (322 chars)
3-bedroom, 1-bath home located on Frank Ave, which is a designated emergency snow route. This property features off-street parking and has been updated with a newer roof, brand-new flooring, and fresh interior paint throughout. A great opportunity for homeowners or investors looking for an affordable, move in ready home!
-
2022-09-29soldstatus $60,000
-
2022-09-28soldstatus 211-char remark
Show marketing remark (211 chars)
This three-bedroom, one-bathroom home is now for sale! You'll love the spacious main floor as well as the wide-open basement. Large yard with alley parking and for under $80,000. Call today before it slips away.
-
2022-04-25$72,000 211-char remark
Show marketing remark (211 chars)
This three-bedroom, one-bathroom home is now for sale! You'll love the spacious main floor as well as the wide-open basement. Large yard with alley parking and for under $80,000. Call today before it slips away.
ⓘ Source: listings_history table (triggers on properties + properties_extension) + one-shot
backfill from property_details.listing_events for pre-trigger history.
Tax reassessment forecast SD · Resets to sale price
- Current annual tax
- $1,012 · $84/mo
- Projected year-2 tax
- $1,114 · $93/mo
- Expected delta
- +$101/yr (+$8/mo · 10.0%)
ⓘ Screening estimate from a state-policy table — verify with the county assessor before closing.
Climate risk First Street
- Flood 1/10 Low FEMA zone X (unshaded) · 0% chance over 30 yrs
- Wildfire 4/10 Moderate
- Heat 3/10 Moderate 7 d/yr ≥100°F today · 14 d/yr by 30 yrs out
- Wind 2/10 Low
- Air quality 2/10 Low 1 unhealthy d/yr today · 1 by 30 yrs out
Nearby sold comps map
Loading sold comps map…
Walkable amenities ~0.75 mi
Loading nearby amenities…
Taxation est. · year 1
- Rental income
- $16,354
- − Mortgage interest
- −$4,761
- − Property taxes
- −$1,012
- − Insurance
- −$425
- − Repairs & maintenance
- −$1,308
- − Management
- −$1,308
- − Depreciation
- −$2,473
- Taxable income
- $5,066
- Est. tax owed @ 24.0%
- −$1,216
- After-tax cash flow
- $4,917/yr
For passive investors: Depreciation is non-cash, so a rental often shows a tax loss while cash-flowing — sheltering income. Rental losses are passive: they offset passive income freely, and up to $25,000/yr can offset ordinary (W-2) income if you actively participate and your MAGI is under $100k (phasing out to $0 by $150k); unused losses carry forward. On sale, claimed depreciation is recaptured at up to 25%, and gains may owe capital-gains tax (a 1031 exchange can defer both). Figures are a year-1 estimate at your 24.0% rate — not tax advice; consult a CPA.
Schools (NCES district)
- District
- Huron School District 02-2
- NCES district ID
- 4635480
- Math proficiency
- 30% ▼ -7.00%
- Reading proficiency
- 44% ▼ -2.00%
- Median HH income
- $43,613
- Composite
- 31.35/100
- National rank
- #5998
- State rank
- #55 of 59 in SD
Livability — Huron
- Score
- 72/100
- State rank
- #48
- US rank
- #6463
Category grades
Schools grade is shown separately in the Schools card above.
Census & demographics
- Census place
- Huron, SD
- Population (ZIP)
- 16,148
Population outlook (Beadle County) Hauer SSP2
- Today (2025)
- 20,094 people
- By 2030
- 21,218 · +5.6%
- By 2040
- 24,042 · +19.6%
- By 2050
- 27,931 · +39.0%
- By 2075
- 43,296 · +115.5%
- By 2100
- 65,888 · +227.9%
Race, ethnicity, and origin ACS 2023
- Neighborhood character
- Majority White (65%)
- Race & ethnicity
- White 65% Hispanic / Latino 16% Asian 11% Two or more races 7% Pacific Islander 2% Native American 1% Black 1%
- Hispanic origin (detail)
- Mexican 7% Puerto Rican 2%
- Common ancestry
- Portuguese 8% Iranian 4% Lithuanian 2%
- Foreign-born
- 15% · Canada, Philippines, Vietnam
- Languages at home
- 80% English-only · Spanish 9% Other Asian/Pacific 7% Vietnamese 2%
Political lean MEDSL · Beadle
- 2024 margin
- Solid R (+40.1) · D 28.8% · R 68.8% · Other 2.4%
- 2008→2024 swing
- -32.8pp toward R · 2008: -7.3pp · 2024: -40.1pp
- All cycles
- 2024: R+40.1 2020: R+38.1 2016: R+37.6 2012: R+18.6 2008: R+7.3
Not yet ingested
- Civics
- —
Market trends
- HPI YoY
- ▼ -116.91%
- Current HPI
- 141.3376
- Rent YoY
- —
- Metro
- —
- State GDP YoY
- ▲ 0.70%
- F500 in state
- 2
Industry mix (Fortune 500 HQ in SD)
| Industry | F500 HQs | Revenue |
|---|---|---|
| Utilities | 1 | $1B |
|
||
Price history
+18.1% since first listed5 events — show timeline
- 2026-05-08 Pending — HBOR
- 2026-04-08 Listed $85,000 HBOR
- 2022-09-29 Sold (Public Records) $60,000 Public Records
- 2022-09-28 Sold (MLS) — HBOR
- 2022-04-25 Listed $72,000 HBOR
Property tax history
+1.4%/yrLatest (2026): $1,012 · +1.4% YoY. Source: county tax records.
Cash-flow waterfall
monthlySold comps — $/sqft
last 12 mo · ≤1 miLoading sold comps…