14777 Palm #102 · Desert Hot Springs, CA
Flood risk 1/10 · Minimal
- FEMA flood zone
- X (shaded)
- Chance of flooding over 30 yrs
- 0.0%
- Est. flood insurance / yr
- $507 – $1,088
Fire risk 5/10 · Moderate
- Est. fire insurance / yr
- $659 – $1,223
Heat risk 9/10 · Severe
- Hot days now (above 111°F)
- 7 days/yr
- Hot days in 30 yrs
- 18 days/yr
Wind risk 1/10 · Minimal
- Chance of severe wind over 30 yrs
- —
Air-quality risk 5/10 · Moderate
- Unhealthy air days now
- 8 days/yr
- Unhealthy air days in 30 yrs
- 11 days/yr
Risk factors via First Street. Map © Google.
Why this score? — see what drove the C grade
The composite is a weighted blend of 9 inputs, each scored 0–100. Each bar is that input's sub-score; the figure is the points it added to the 100-point composite (weight × sub-score).
- Cash flow +22.6/30.0
- ARV discount +8.0/15.0
- DSCR +7.3/10.0
- 1% rule +6.8/10.0
- Rent growth +3.4/5.0
- Schools +2.7/10.0
- Livability +2.5/5.0
- Condition / age +2.5/5.0
- Appreciation +0.0/10.0
$210,000
🖨 Deal sheet 📄 Offer letter ✓ Due diligence
Listing remarks MLS
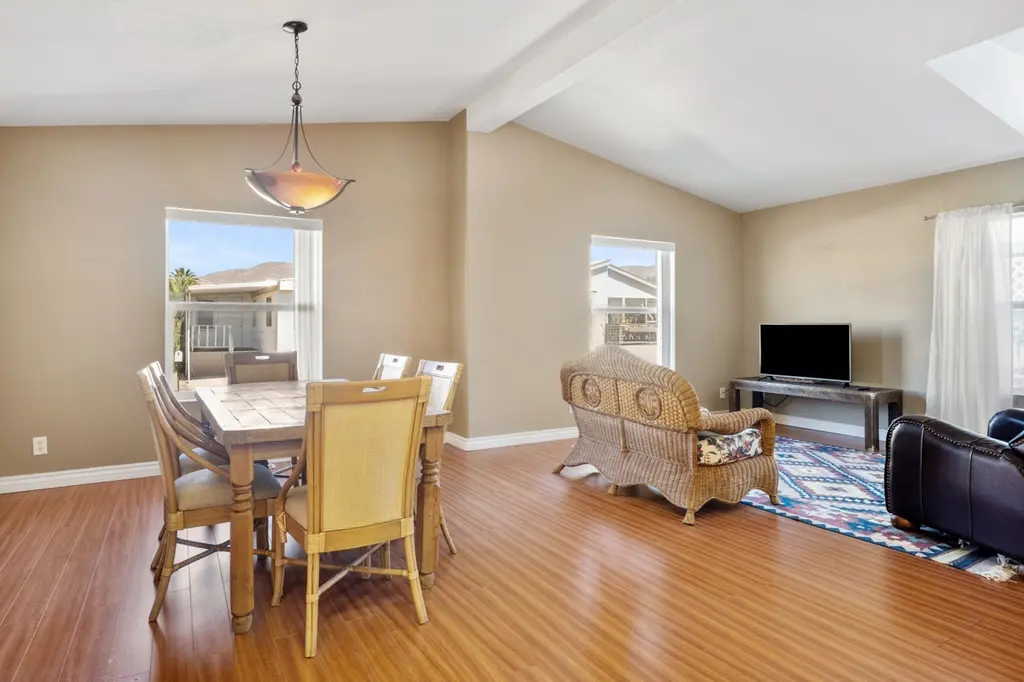
Welcome to Skys Haven, a desirable 55+ gated community in Desert Hot Springs offering comfort, convenience, and stunning mountain views. One of the standout features of this property is that you own the land—no space rent—providing long-term value and peace of mind. This well-maintained home features three bedrooms and two bathrooms, along with the convenience of indoor laundry. Covered carport spaces help protect your vehicles from the elements, while central heating and air conditioning ensure year-round comfort. Residents of Skys Haven enjoy resort-style amenities designed to keep you active and social, including three sparkling pools, relaxing hot tubs, a fitness room, sauna, shuffleboard courts, and a welcoming clubhouse complete with a kitchen—perfect for gatherings and community events. Ideally located near shopping, dining, casinos, entertainment venues, Palm Springs, and with easy access to the I-10 freeway, this home offers both tranquility and accessibility. A must-see opportunity to enjoy the best of desert living!
Key facts
- Gated community
- Relaxing hot tubs
- Covered carport
Tags
Neighborhood map
What this means for you Summary
Snapshot
- This is a 3-bed/2.0-bath manufactured listed at $210k.
Deal economics
- At list price, monthly cash flow is $359 ($4k/yr) — positive.
- The deal already cash-flows at list — no discount required.
- Meets the 1% rule at list price ($2k rent vs $210k).
- Recommended offer: $197k (6.0% below list) — sets the bar for market timing.
- Cap rate 8.3% vs local median 4.0% in Desert Hot Springs — top-decile yield for the area; either an underpriced asset or a hidden risk that comps aren't pricing in. Stress-test before assuming the spread holds.
Location & tenants
- Location reads 49/100 on livability (#1,149 in CA) — a working-class tenant base; expect higher turnover. Strengths: housing B+; Watch: crime D+, schools F, amenities F.
- Palm Springs Unified (suburban): math 21% / reading 42% proficiency, ranked #328 of 517 in CA (top 63%) — families likely to look elsewhere, expect single-tenant / working-renter base with shorter leases; 73% free/reduced lunch — lower-income household profile, screen leases tightly.
- Market conditions: Rents rising (+3.7%/yr); 515 active listings in the ZIP; 18 comparable units currently listed for rent nearby; rentals lingering (median 44d on market — plan ~5-8 weeks vacancy on turnover, expect pricing pressure); 61% of comp listings sitting > 30 days — soft ceiling on asking rent; 9,195 units permitted in Riverside County in 2024 (1,512 in 5+ unit buildings).
- At $2,485/mo this rent would consume 55% of the median local household income ($54k/yr) (locally 2095% of renters already pay >50% of income on rent) — very limited rent-growth headroom before tenants either downsize or default.
Forward outlook
- Local home prices are declining (-3.0%/yr); year-one equity from $1k of loan paydown is wiped out by about $6k of value loss. Plan a longer hold.
- Riverside County population projected at +22% by 2050 — long-run rental-demand tailwind backs the buy-and-hold thesis.
Negotiation context
- It's been on market 90 days — a 6% lower offer ($197k) is reasonable based on typical stale-listing flexibility.
- 8 sale attempts since 17y ago with the ask held roughly flat each time — persistent listings suggest the price (not the market) is what's stuck; bring a comps-based counter.
Risks & watch-outs
- Climate carrying-cost: moderate wildfire risk; extreme-heat days projected 7→18/yr by 2055 (HVAC capex compounding) — expect insurance premiums to compound above CPI over the hold.
Questions for the listing agent
- It's been on market 90 days. Have you received any prior offers? Is the seller open to a 6% concession, seller financing, or rate buy-down credit?
- What does the HOA fee cover, when was the last increase, and are there any pending special assessments or reserve-fund shortfalls?
- Why hasn't it sold? Are there any deal-killer items the seller is aware of (foundation, flood, title, zoning, code violations)?
- Is there a deadline driving the sale (1031 exchange, divorce, estate, relocation)? That informs how much negotiation room exists.
- Schools are F-rated, which usually means shorter tenancies and higher turnover. Who's the typical renter profile here, and what's been the actual vacancy rate?
- Crime grade is D in this area — have there been break-ins, vandalism, or insurance claims at this property in the last 3 years? What carrier currently insures it and at what premium?
- What's the average days-on-market for RENTAL listings here right now (not sales)? A rising rental-DOM trend means longer vacancies and softer asking-rent achievability than the comps imply.
- What's the recent tenant-quality profile in this submarket — average credit score on applications, eviction rate, late-payment / NSF rate, and stable-employment percentage? A property-management company in the area should have these aggregated.
- How much new for-sale + rental construction is in the pipeline within 1–3 miles? Heavy new supply typically softens prices + rents 12–24 months out; constrained supply supports both.
Investment metrics
- 1% rule
- 1.18% ✓
- Cap rate
- 8.34%
- Cash-on-cash
- 7.32%
- DSCR
- 1.33
- GRM
- 7.0
CMA / ARV
- ARV (median comp)
- $212,412
- List price
- $210,000
- Delta
- -1.14%
- Verdict
- FAIR
- Comps
- 20 within 1.0 mi
Show comp detail 12 sales within ~0.75 mi
| Address | Dist | Beds/Ba | Sqft | Sold | Price | $/sf | Match |
|---|---|---|---|---|---|---|---|
| 14777 Palm Dr #186 | 0.09mi | 3/2.0 | 1,440 (0%) | 2mo | $245,000 | $170 | 94 |
| 15300 Palm Dr #35 | 0.48mi | 2/2.0 (-1) | 1,430 (-1%) | 5mo | $105,000 | $73 | 68 |
| 15300 Palm Dr #255 | 0.44mi | 3/2.0 | 1,345 (-7%) | 2mo | $203,500 | $151 | 67 |
| 14777 Palm Dr #15 | 0.17mi | 2/2.0 (-1) | 1,260 (-12%) | 3mo | $180,000 | $143 | 64 |
| 15300 Palm Dr #119 | 0.47mi | 3/2.0 | 1,344 (-7%) | 4mo | $220,000 | $164 | 64 |
| 15300 Palm Dr #242 | 0.34mi | 2/2.0 (-1) | 1,552 (+8%) | 3mo | $212,750 | $137 | 63 |
| 15300 Palm Dr #146 | 0.48mi | 3/2.0 | 1,539 (+7%) | 5mo | $218,000 | $142 | 62 |
| 15300 Palm Dr #30 | 0.39mi | 3/2.0 | 1,248 (-13%) | 3mo | $200,000 | $160 | 57 |
| 15300 Palm Dr #161 | 0.57mi | 2/2.0 (-1) | 1,333 (-7%) | 1mo | $233,000 | $175 | 55 |
| 15300 Palm Dr #209 | 0.57mi | 2/2.0 (-1) | 1,335 (-7%) | 3mo | $161,000 | $121 | 54 |
| 15300 Palm Dr #138 | 0.54mi | 2/2.0 (-1) | 1,323 (-8%) | 3mo | $237,000 | $179 | 53 |
| 15300 Palm Dr #22 | 0.52mi | 2/2.0 (-1) | 1,272 (-12%) | 5mo | $219,000 | $172 | 47 |
Match score weights: distance 35% · size 25% · config 20% · recency 20%. Top-matched comps best support the ARV.
Projected returns pro-forma
-3.0% appreciation · 3.66% rent growth · sell at horizon
- IRR
- -4.2%
- Equity multiple
- 0.84×
- Total profit
- $-9,380
- Equity at exit
- $31,312
- IRR
- 6.3%
- Equity multiple
- 1.49×
- Total profit
- $28,705
- Equity at exit
- $18,157
Cash invested: $58,800 (down + closing). Projections, not guarantees.
Landlord ↔ Tenant lean methodology
- Overall (STATE)
- 18 Strongly Tenant-Friendly
- State California
- 18 Strongly Tenant-Friendly · D+13
- County
- — inherits STATE
- City
- — inherits STATE
ZIP-level market 92240
- Home prices YoY
- -19.6%
- Rents YoY
- 3.7%
- Active inventory
- 515
- Price-to-rent
- 7.0×
Monthly cashflow live
- Estimated rent
- $2,485 high interval (Pro) →
- Mortgage (P&I)
- −$1,101
- Tax from tax record
- −$200 /mo · $2,403/yr
- Insurance
- −$88
- HOA
- −$215
- Vacancy / Maint / Mgmt
- −$522
- Net cashflow
- $359
Break-even live
UW: 25.0% down · 7.5% · 30yr · 1.5% tax · 5.0% vac · 8.0% maint · 8.0% mgmt
Financing live
Cash to close
- Down payment
- $52,500
- Closing costs
- $6,300
- Reserves months
- —
- Total cash needed
- —
Loan-product check · same deal, 3 products live
Conventional
25% down · 7.5% · 30yr
- Down + closing
- —
- Monthly P&I
- —
- Monthly cashflow
- —
- DSCR
- —
- Eligible?
- —
Personal DTI + credit; lowest rate.
DSCR
20% down · 8.5% · 30yr
- Down + closing
- —
- Monthly P&I
- —
- Monthly cashflow
- —
- DSCR
- —
- Eligible?
- —
No personal income docs; deal must DSCR.
Hard money
10% down · 12.0% · 12mo
- Down + closing
- —
- Monthly P&I
- —
- Monthly cashflow
- —
- DSCR
- —
- Eligible?
- —
Short-term bridge; refi at stabilization.
Rent comps 18 comps
| Address | Beds | Baths | Sqft | Rent | $/sqft | DOM | Units | Dist |
|---|---|---|---|---|---|---|---|---|
| 14777 Palm Dr Desert Hot Springs, CA | 4.0 | 2.0 | 1573 | $1,995 | $1.27 | 43d | 1 | 0.19mi |
| 13987 El Cajon Dr Desert Hot Springs, CA | 3.0 | 2.0 | 1215 | $2,600 | $2.14 | 7d | 1 | 0.42mi |
| 13950 West Dr Unit B Desert Hot Springs, CA | 2.0 | 2.0 | 1008 | $1,600 | $1.59 | 1d | 1 | 0.48mi |
| 15300 Palm Dr Desert Hot Springs, CA | 3.0 | 2.0 | 1458 | $2,800 | $1.92 | 43d | 1 | 0.51mi |
| 13715 El Rio Ln Desert Hot Springs, CA | 3.0 | 2.0 | 1318 | $2,600 | $1.97 | 7d | 1 | 0.70mi |
| 66629 Joseph Way Unit B Desert Hot Springs, CA | 4.0 | 2.0 | 1200 | $2,900 | $2.42 | 24d | 1 | 0.71mi |
| 13244 El Cajon Dr Desert Hot Springs, CA | 4.0 | 0.5 | 1320 | $3,200 | $2.42 | 43d | 1 | 0.79mi |
| 13322 El Rio Ln Desert Hot Springs, CA | 3.0 | 2.0 | 1215 | $2,750 | $2.26 | 43d | 1 | 0.85mi |
| 15123 Avenida Ramada Desert Hot Springs, CA | 4.0 | 2.0 | 1745 | $3,200 | $1.83 | 18d | 1 | 0.86mi |
| 16111 Avenida Ramada Desert Hot Springs, CA | 4.0 | 2.0 | 1773 | $3,000 | $1.69 | 43d | 1 | 1.03mi |
| 66444 Desert View Ave Unit B Desert Hot Springs, CA | 3.0 | 2.0 | 1294 | $2,275 | $1.76 | 43d | 1 | 1.20mi |
| 15490 Avenida Rambla Desert Hot Springs, CA | 3.0 | 2.0 | 1088 | $2,600 | $2.39 | 43d | 1 | 1.25mi |
| 15490 Avenue Rambla Unit NA Desert Hot Springs, CA | 3.0 | 2.0 | 1088 | $2,600 | $2.39 | 24d | 1 | 1.25mi |
| 66824 Estrella Ave Desert Hot Springs, CA | 3.0 | 1.0 | 1700 | $2,300 | $1.35 | 23d | 1 | 1.26mi |
| 66369 Buena Vista Ave Apt A Desert Hot Springs, CA | 3.0 | 2.0 | 931 | $1,499 | $1.61 | 43d | 1 | 1.27mi |
| 65565 Acoma Ave #49 Desert Hot Springs, CA | 3.0 | 2.0 | 1396 | $2,300 | $1.65 | 43d | 1 | 1.34mi |
| 16087 Bubbling Wells Rd Desert Hot Springs, CA | 3.0 | 2.0 | 1850 | $5,000 | $2.70 | 43d | 1 | 1.37mi |
| 13175 Little Morongo Rd Desert Hot Springs, CA | 4.0 | 2.5 | 1056 | $1,995 | $1.89 | 43d | 1 | 1.50mi |
HOA detail
- Monthly dues
- $215 · $2,580/yr
- Likely covers
- poolsecurity
Listing history 44 events
-
2026-06-18days on market $210,000 Active 90 DOM
-
2026-06-17days on market $210,000 Active 89 DOM
-
2026-06-16days on market $210,000 Active 88 DOM
-
2026-06-15days on market $210,000 Active 87 DOM
-
2026-06-13days on market $210,000 Active 85 DOM
-
2026-06-13days on market $210,000 Active 84 DOM
-
2026-06-09days on market $210,000 Active 81 DOM
-
2026-06-08days on market $210,000 Active 80 DOM
-
2026-06-07days on market $210,000 Active 79 DOM
-
2026-06-04days on market $210,000 Active 76 DOM
-
2026-06-03days on market $210,000 Active 75 DOM
-
2026-06-02days on market $210,000 Active 74 DOM
-
2026-06-01days on market $210,000 Active 73 DOM
-
2026-05-31days on market $210,000 Active 72 DOM
-
2026-03-20$210,000 Active 1060-char remark
Show marketing remark (1060 chars)
Welcome to Skys Haven, a desirable 55+ gated community in Desert Hot Springs offering comfort, convenience, and stunning mountain views. One of the standout features of this property is that you own the land—no space rent—providing long-term value and peace of mind. This well-maintained home features three bedrooms and two bathrooms, along with the convenience of indoor laundry. Covered carport spaces help protect your vehicles from the elements, while central heating and air conditioning ensure year-round comfort. Residents of Skys Haven enjoy resort-style amenities designed to keep you active and social, including three sparkling pools, relaxing hot tubs, a fitness room, sauna, shuffleboard courts, and a welcoming clubhouse complete with a kitchen—perfect for gatherings and community events. Ideally located near shopping, dining, casinos, entertainment venues, Palm Springs, and with easy access to the I-10 freeway, this home offers both tranquility and accessibility. A must-see opportunity to enjoy the best of desert living!
-
2026-02-02historical
-
2025-12-01$210,000 Active
-
2025-09-14historical
-
2025-06-04price $218,000
-
2025-05-08price $223,000
-
2025-03-13$233,000 Active
-
2022-04-01soldstatus $192,500 Closed Sale
-
2022-03-11status Pending Sale
-
2022-02-10historical Active Under Contract
-
2022-01-20$203,000 Active
-
2015-01-06soldstatus $61,000 Closed
-
2015-01-06soldstatus $61,000 Closed
-
2015-01-06soldstatus $61,000
-
2014-10-02status Pending
-
2014-10-01$65,000 Active
-
2011-11-18soldstatus $34,500 Closed
-
2011-10-17status Pending
-
2011-09-23price $34,500
-
2011-08-09price $38,900
-
2011-07-13$44,900 Active
-
2011-07-10historical
-
2011-06-15price $54,900
-
2011-05-19price $71,000
-
2011-04-18price $78,900
-
2011-02-27$86,900 Active
-
2010-05-15historical
-
2009-11-21$128,000 Active
-
2005-12-30soldstatus $155,000
-
2005-06-08soldstatus $100,000
ⓘ Source: listings_history table (triggers on properties + properties_extension) + one-shot
backfill from property_details.listing_events for pre-trigger history.
Tax reassessment forecast CA · Resets to sale price
- Current annual tax
- $2,403 · $200/mo
- Projected year-2 tax
- $2,403 · $200/mo
- Expected delta
- $0/yr ($0/mo · 0.0%)
ⓘ Screening estimate from a state-policy table — verify with the county assessor before closing.
Climate risk First Street
- Flood 1/10 Low FEMA zone X (shaded) · 0% chance over 30 yrs
- Wildfire 5/10 Major
- Heat 9/10 Extreme 7 d/yr ≥111°F today · 18 d/yr by 30 yrs out
- Wind 1/10 Low
- Air quality 5/10 Major 8 unhealthy d/yr today · 11 by 30 yrs out
Nearby sold comps map
Loading sold comps map…
Walkable amenities ~0.75 mi
Loading nearby amenities…
Taxation est. · year 1
- Rental income
- $29,816
- − Mortgage interest
- −$11,763
- − Property taxes
- −$2,403
- − Insurance
- −$1,050
- − Repairs & maintenance
- −$2,385
- − Management
- −$2,385
- − HOA
- −$2,580
- − Depreciation
- −$6,109
- Taxable income
- $1,140
- Est. tax owed @ 24.0%
- −$274
- After-tax cash flow
- $4,033/yr
For passive investors: Depreciation is non-cash, so a rental often shows a tax loss while cash-flowing — sheltering income. Rental losses are passive: they offset passive income freely, and up to $25,000/yr can offset ordinary (W-2) income if you actively participate and your MAGI is under $100k (phasing out to $0 by $150k); unused losses carry forward. On sale, claimed depreciation is recaptured at up to 25%, and gains may owe capital-gains tax (a 1031 exchange can defer both). Figures are a year-1 estimate at your 24.0% rate — not tax advice; consult a CPA.
Schools (NCES district)
- District
- Palm Springs Unified
- NCES district ID
- 0629550
- Math proficiency
- 21% ▼ -7.00%
- Reading proficiency
- 42% ▬ 0.00%
- Median HH income
- $43,638
- Composite
- 26.76/100
- National rank
- #7131
- State rank
- #328 of 517 in CA
Livability — Desert Hot Springs
- Score
- 49/100
- State rank
- #1149
- US rank
- #25774
Category grades
Schools grade is shown separately in the Schools card above.
Census & demographics
- Census place
- Desert Hot Springs, CA
- County
- Riverside County · 2,287,001 people
- City population
- 41,615
- Metro
- Riverside-San Bernardino-Ontario, CA
- Population (ZIP)
- 41,615
- Household income
- $54,023
- Rent vs Own
- Severe rent burden
- 2095.0
Population outlook (Riverside County) Hauer SSP2
- Today (2025)
- 2,664,475 people
- By 2030
- 2,802,692 · +5.2%
- By 2040
- 3,050,904 · +14.5%
- By 2050
- 3,256,783 · +22.2%
- By 2075
- 3,655,058 · +37.2%
- By 2100
- 3,766,594 · +41.4%
Race, ethnicity, and origin ACS 2023
- Neighborhood character
- Majority Hispanic (64%)
- Race & ethnicity
- Hispanic / Latino 64% Two or more races 27% White 23% Black 7% Native American 2% Asian 2%
- Hispanic origin (detail)
- Mexican 53%
- Common ancestry
- Lithuanian 1% Romanian 1% Italian 1%
- Foreign-born
- 27% · Canada, Vietnam
- Languages at home
- 47% English-only · Spanish 50% Russian/Polish/Slavic 1%
Political lean MEDSL · Riverside
- 2024 margin
- Toss-up / Even · D 48.0% · R 49.3% · Other 2.6%
- 2008→2024 swing
- -3.6pp toward R · 2008: 2.3pp · 2024: -1.3pp
- All cycles
- 2024: R+1.3 2020: D+8.0 2016: D+4.3 2012: R+0.4 2008: D+2.3
Not yet ingested
- Civics
- —
Market trends
- HPI YoY
- ▼ -102.10%
- Current HPI
- 418.4691
- Rent YoY
- ▲ 3.66%
- Metro
- Riverside-San Bernardino-Ontario, CA
- State GDP YoY
- ▲ 3.21%
- F500 in state
- 116
Industry mix (Fortune 500 HQ in CA)
| Industry | F500 HQs | Revenue |
|---|---|---|
| Technology | 27 | $1,492B |
|
||
| Financial Services | 3 | $174B |
|
||
| Retail | 3 | $44B |
|
||
| Insurance | 3 | $26B |
|
||
| Media / Entertainment | 2 | $115B |
|
||
| Pharmaceuticals / Biotech | 2 | $62B |
|
||
Price history
+110.0% since first listed30 events — show timeline
- 2026-03-20 Listed $210,000 CRMLS
- 2026-02-02 Listing Removed — GPSMLS
- 2025-12-01 Listed $210,000 GPSMLS
- 2025-09-14 Listing Removed — GPSMLS
- 2025-06-04 Price Changed $218,000 GPSMLS
- 2025-05-08 Price Changed $223,000 GPSMLS
- 2025-03-13 Listed $233,000 GPSMLS
- 2022-04-01 Sold (MLS) $192,500 CRMLS
- 2022-03-11 Pending — CRMLS
- 2022-02-10 Contingent — CRMLS
- 2022-01-20 Listed $203,000 CRMLS
- 2015-01-06 Sold (Public Records) $61,000 Public Records
- 2015-01-06 Sold (MLS) $61,000 GPSMLS
- 2015-01-06 Sold (MLS) $61,000 GPSMLS
- 2014-10-02 Pending — GPSMLS
- 2014-10-01 Listed $65,000 GPSMLS
- 2011-11-18 Sold (MLS) $34,500 CRMLS
- 2011-10-17 Pending — CRMLS
- 2011-09-23 Price Changed $34,500 CRMLS
- 2011-08-09 Price Changed $38,900 CRMLS
- 2011-07-13 Listed $44,900 CRMLS
- 2011-07-10 Listing Removed — GPSMLS
- 2011-06-15 Price Changed $54,900 GPSMLS
- 2011-05-19 Price Changed $71,000 GPSMLS
- 2011-04-18 Price Changed $78,900 GPSMLS
- 2011-02-27 Listed $86,900 GPSMLS
- 2010-05-15 Listing Removed — GPSMLS
- 2009-11-21 Listed $128,000 GPSMLS
- 2005-12-30 Sold (Public Records) $155,000 Public Records
- 2005-06-08 Sold (Public Records) $100,000 Public Records
Property tax history
+2.7%/yrLatest (2025): $2,403 · -2.4% YoY. Source: county tax records.
Cash-flow waterfall
monthlySold comps — $/sqft
last 12 mo · ≤1 miLoading sold comps…