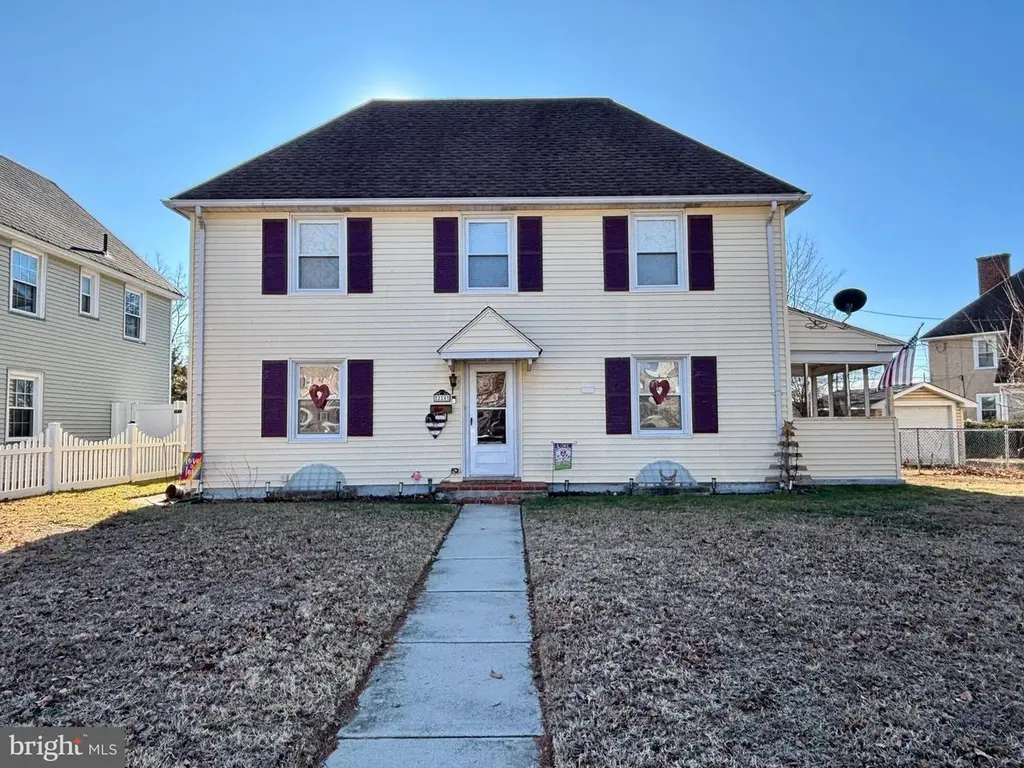
228 Christiana St · Brooklawn, NJ
Flood risk 1/10 · Minimal
- FEMA flood zone
- X (unshaded)
- Chance of flooding over 30 yrs
- 0.0%
- Est. flood insurance / yr
- $507 – $1,088
Fire risk 1/10 · Minimal
- Est. fire insurance / yr
- $526 – $976
Heat risk 7/10 · Major
- Hot days now (above 103°F)
- 7 days/yr
- Hot days in 30 yrs
- 15 days/yr
Wind risk 6/10 · Moderate
- Chance of severe wind over 30 yrs
- 38.0%
Air-quality risk 4/10 · Minor
- Unhealthy air days now
- 5 days/yr
- Unhealthy air days in 30 yrs
- 6 days/yr
Risk factors via First Street. Map © Google.
Why this score? — see what drove the D+ grade
The composite is a weighted blend of 9 inputs, each scored 0–100. Each bar is that input's sub-score; the figure is the points it added to the 100-point composite (weight × sub-score).
- ARV discount +15.0/15.0
- Cash flow +13.7/30.0
- DSCR +4.1/10.0
- 1% rule +3.8/10.0
- Condition / age +3.8/5.0
- Schools +3.5/10.0
- Livability +3.2/5.0
- Rent growth +2.5/5.0
- Appreciation +0.0/10.0
$285,000
🖨 Deal sheet (PDF) 📄 Offer letter ✓ Due diligence
Listing remarks
Welcome to this adorable 4 bedroom 1 bathroom nearly 1,600 Square Foot Single Family detached home in the heart of charming Brooklawn NJ! This home is in really good condition and is perfect for any type of home Buyer. More details & photos to come - stay tuned! ---- Property is owned by the municipality and will be sold via in-person Public Auction. Traditional submission of offers will not be accepted at this time. Borough of Brooklawn will offer for sale by open public auction to the highest responsible bidder, at the time and place set forth below. ---- Auction Date & Time: Friday, June 5th at 4 pm (sharp!) Location of Auction: Brooklawn Municipal Building, 301 Christiana
Key facts
- 9,635 sq ft lot
- Built 1918
- Listed 44 days
Property features AI
Exterior
- Parking: On-street parking
- Utilities: Public water; Public sewer
- Home design: Detached single-family home; Above-grade finished area approximately 1,598 (assessor)
- Construction: Frame construction; Block foundation; Above-grade and below-grade structures
- Exterior features: Lot approximately 66 x 146 feet; No tidal water
Interior
- Bedrooms: Four bedrooms on the first upper level
- Bathrooms: One full bathroom (all upper levels)
- Heating & cooling: Forced air heating (natural gas); Central air conditioning (natural gas); Natural gas hot water
- Interior features: Full basement
Neighborhood map
What this means for you Summary
Snapshot
- This is a 4-bed/1.0-bath single-family listed at $285k. Condition is rated good.
Deal economics
- At list price, monthly cash flow is $21 ($254/yr) — positive.
- The deal already cash-flows at list — no discount required.
- To meet the 1% rule (rent ≥ 1% of price), the offer needs to be $252k (11.6% below list).
- Recommended offer: $252k (11.6% below list) — sets the bar for 1% rule.
Location & tenants
- Location reads 64/100 on livability (#419 in NJ) — a middle-class / working-renter tenant base. Strengths: housing B+; Watch: amenities D+, employment D+, crime F.
- Brooklawn Public School District (suburban): math 29% / reading 43% proficiency, ranked #518 of 612 in NJ (top 85%) — families likely to look elsewhere, expect single-tenant / working-renter base with shorter leases.
- Zoned schools: Alice Costello Elementary School (math 12% / reading 37%, grade F, #878 of 1,303 statewide, top 70%, 279 students, 64% FRL) — zoned schools average 64% FRL vs 45% district-wide (19 pts higher); higher-poverty schools than district average — tighter screening recommended.
- Market conditions: 92 active listings in the ZIP; 9 comparable units currently listed for rent nearby; rentals at typical pace (median 21d on market — plan ~3-4 weeks tenant-placement turnaround); 1,018 units permitted in Camden County in 2024 (509 in 5+ unit buildings).
- At $2,520/mo this rent would consume 48% of the median local household income ($63k/yr) (locally 431% of renters already pay >50% of income on rent) — very limited rent-growth headroom before tenants either downsize or default.
Forward outlook
- Local home prices are declining (-3.0%/yr); year-one equity from $2k of loan paydown is wiped out by about $9k of value loss. Plan a longer hold.
- Camden County population projected to shrink 8% by 2050 — rents likely to lag national; underwrite the cash flow, not the appreciation.
Negotiation context
- It's been on market 45 days — a 3% lower offer ($276k) is reasonable based on typical stale-listing flexibility.
Risks & watch-outs
- Watch-outs: built in 1918 — expect roof / HVAC / electrical / plumbing capex.
- Climate carrying-cost: major wind risk, 38% chance of damaging wind over 30y; extreme-heat days projected 7→15/yr by 2055 (HVAC capex compounding) — expect insurance premiums to compound above CPI over the hold.
Questions for the listing agent
- It's been on market 45 days. Have you received any prior offers? Is the seller open to a 12% concession, seller financing, or rate buy-down credit?
- Built in 1918 — when were the roof, HVAC, electrical panel, plumbing, and water heater last replaced?
- Is there a deadline driving the sale (1031 exchange, divorce, estate, relocation)? That informs how much negotiation room exists.
- Schools are D-rated, which usually means shorter tenancies and higher turnover. Who's the typical renter profile here, and what's been the actual vacancy rate?
- Crime grade is F in this area — have there been break-ins, vandalism, or insurance claims at this property in the last 3 years? What carrier currently insures it and at what premium?
- The area grade is low — what's the realistic commute time and amenity access for the typical tenant pool here? Any planned neighborhood developments (good or bad) we should know about?
- What's the average days-on-market for RENTAL listings here right now (not sales)? A rising rental-DOM trend means longer vacancies and softer asking-rent achievability than the comps imply.
- What's the recent tenant-quality profile in this submarket — average credit score on applications, eviction rate, late-payment / NSF rate, and stable-employment percentage? A property-management company in the area should have these aggregated.
- How much new for-sale + rental construction is in the pipeline within 1–3 miles? Heavy new supply typically softens prices + rents 12–24 months out; constrained supply supports both.
Investment metrics
- 1% rule
- 0.88% ✗
- Cap rate
- 6.38%
- Cash-on-cash
- 0.32%
- DSCR
- 1.01
- GRM
- 9.4
CMA / ARV
- ARV (on-the-fly)
- $373,932
- Comps found
- 12
Show comp detail 12 sales within ~0.75 mi
| Address | Dist | Beds/Ba | Sqft | Sold | Price | $/sf | Match |
|---|---|---|---|---|---|---|---|
| 202 Chestnut St | 0.28mi | 4/2.0 | 1,552 (-3%) | 3mo | $375,000 | $242 | 76 |
| 210 Mcclelland Ave | 0.20mi | 4/1.5 | 1,512 (-5%) | 10mo | $360,000 | $238 | 71 |
| 1149 Sheridan Ave | 0.26mi | 4/1.5 | 1,512 (-5%) | 11mo | $355,000 | $235 | 68 |
| 105 5th St | 0.22mi | 3/1.0 (-1) | 1,500 (-6%) | 15mo | $300,000 | $200 | 62 |
| 313 Summit Ave | 0.56mi | 3/1.0 (-1) | 1,682 (+5%) | 1mo | $325,000 | $193 | 59 |
| 248 Park Dr | 0.34mi | 3/2.0 (-1) | 1,466 (-8%) | 15mo | $343,000 | $234 | 49 |
| 13 Park Dr | 0.45mi | 4/2.0 | 1,836 (+15%) | 2mo | $329,900 | $180 | 48 |
| 32 E Thompson Ave | 0.63mi | 4/2.5 | 1,559 (-2%) | 16mo | $315,000 | $202 | 48 |
| 324 Mercer Ave | 0.61mi | 4/1.5 | 1,408 (-12%) | 3mo | $352,000 | $250 | 47 |
| 15 Koehler St | 0.70mi | 3/1.0 (-1) | 1,440 (-10%) | 4mo | $165,000 | $115 | 43 |
| 324 Summit Ave | 0.60mi | 3/1.5 (-1) | 1,396 (-13%) | 6mo | $250,000 | $179 | 39 |
| 245 Bergen Ave | 0.53mi | 3/2.5 (-1) | 1,788 (+12%) | 9mo | $430,000 | $240 | 37 |
Match score weights: distance 35% · size 25% · config 20% · recency 20%. Top-matched comps best support the ARV.
Projected returns pro-forma
-3.0% appreciation · 3.0% rent growth · sell at horizon
- IRR
- -15.8%
- Equity multiple
- 0.44×
- Total profit
- $-44,794
- Equity at exit
- $42,494
- IRR
- -7.3%
- Equity multiple
- 0.53×
- Total profit
- $-37,113
- Equity at exit
- $24,642
Cash invested: $79,800 (down + closing). Projections, not guarantees.
Landlord ↔ Tenant lean methodology
- Overall (STATE)
- 21 Tenant-Leaning
- State New Jersey
- 21 Tenant-Leaning · D+6
- County
- — inherits STATE
- City
- — inherits STATE
ZIP-level market 08030
- Home prices YoY
- -27.9%
- Active inventory
- 92
- Price-to-rent
- 9.4×
Monthly cashflow live
- Estimated rent
- $2,520 high interval (Pro) →
- Mortgage (P&I)
- −$1,495
- Tax est. 1.5%
- −$356 /mo · $4,275/yr
- Insurance
- −$119
- HOA
- −$0
- Vacancy / Maint / Mgmt
- −$529
- Net cashflow
- $21
Break-even live
Sensitivity live
| Price | -10% $218 | -5% $120 | +0% $21 | +5% $-77 | +10% $-176 |
|---|---|---|---|---|---|
| Rent | -10% $-178 | -5% $-78 | +0% $21 | +5% $121 | +10% $220 |
| Rate | -1.0pp $165 | -0.5pp $94 | base $21 | +0.5pp $-53 | +1.0pp $-128 |
UW: 25.0% down · 7.5% · 30yr · 1.5% tax · 5.0% vac · 8.0% maint · 8.0% mgmt
Financing live
Cash to close
- Down payment
- $71,250
- Closing costs
- $8,550
- Reserves months
- —
- Total cash needed
- —
Loan-product check · same deal, 3 products live
Conventional
25% down · 7.5% · 30yr
- Down + closing
- —
- Monthly P&I
- —
- Monthly cashflow
- —
- DSCR
- —
- Eligible?
- —
Personal DTI + credit; lowest rate.
DSCR
20% down · 8.5% · 30yr
- Down + closing
- —
- Monthly P&I
- —
- Monthly cashflow
- —
- DSCR
- —
- Eligible?
- —
No personal income docs; deal must DSCR.
Hard money
10% down · 12.0% · 12mo
- Down + closing
- —
- Monthly P&I
- —
- Monthly cashflow
- —
- DSCR
- —
- Eligible?
- —
Short-term bridge; refi at stabilization.
Rent comps 9 comps
| Address | Beds | Baths | Sqft | Rent | $/sqft | DOM | Units | Dist |
|---|---|---|---|---|---|---|---|---|
| 13 Pine St Westville, NJ | 3.0 | 1.0 | 1300 | $2,000 | $1.54 | 0d | 1 | 0.60mi |
| 18 Pine St Westville, NJ | 4.0 | 2.5 | 1800 | $2,950 | $1.64 | 0d | 1 | 0.62mi |
| 227 S Broadway Gloucester City, NJ | 3.0 | 1.0 | 1123 | $1,775 | $1.58 | 26d | 1 | 1.03mi |
| 840 Cumberland St Unit 2 Gloucester City, NJ | 3.0 | 1.0 | 1642 | $2,200 | $1.34 | 26d | 1 | 1.10mi |
| 604 Hunter St Gloucester City, NJ | 3.0 | 1.0 | 1066 | $1,900 | $1.78 | 6d | 1 | 1.11mi |
| 602 Powell St Gloucester City, NJ | 3.0 | 1.0 | 1170 | $1,850 | $1.58 | 26d | 1 | 1.14mi |
| 231 3rd St Gloucester City, NJ | 3.0 | 2.0 | 1376 | $2,150 | $1.56 | 26d | 1 | 1.32mi |
| 534 Bergen St Gloucester City, NJ | 3.0 | 1.0 | 1246 | $2,000 | $1.61 | 20d | 1 | 1.34mi |
| 322 Nicholson Rd Gloucester City, NJ | 4.0 | 2.0 | 1968 | $3,700 | $1.88 | 0d | 1 | 1.39mi |
Listing history 13 events
-
2026-06-15days on market $285,000 Active 45 DOM
-
2026-06-13days on market $285,000 Active 43 DOM
-
2026-06-13days on market $285,000 Active 42 DOM
-
2026-06-09days on market $285,000 Active 39 DOM
-
2026-06-08days on market $285,000 Active 38 DOM
-
2026-06-07days on market $285,000 Active 37 DOM
-
2026-06-04days on market $285,000 Active 34 DOM
-
2026-06-03days on market $285,000 Active 33 DOM
-
2026-06-02days on market $285,000 Active 32 DOM
-
2026-06-01days on market $285,000 Active 31 DOM
-
2026-05-31days on market $285,000 Active 30 DOM
-
2026-05-02$285,000 Active
-
2026-04-28historical $285,000
ⓘ Source: listings_history table (triggers on properties + properties_extension) + one-shot
backfill from property_details.listing_events for pre-trigger history.
Climate risk First Street
- Flood 1/10 Low FEMA zone X (unshaded) · 0% chance over 30 yrs
- Wildfire 1/10 Low
- Heat 7/10 Severe 7 d/yr ≥103°F today · 15 d/yr by 30 yrs out
- Wind 6/10 Major 38% chance of damaging wind over 30 yrs
- Air quality 4/10 Moderate 5 unhealthy d/yr today · 6 by 30 yrs out
Nearby sold comps map
Loading sold comps map…
Walkable amenities ~0.75 mi
Loading nearby amenities…
Taxation est. · year 1
- Rental income
- $30,240
- − Mortgage interest
- −$15,964
- − Property taxes
- −$4,275
- − Insurance
- −$1,425
- − Repairs & maintenance
- −$2,419
- − Management
- −$2,419
- − Depreciation
- −$8,291
- Taxable loss
- −$4,554
- Est. tax savings @ 24.0%
- +$1,093
- After-tax cash flow
- $1,347/yr
For passive investors: Depreciation is non-cash, so a rental often shows a tax loss while cash-flowing — sheltering income. Rental losses are passive: they offset passive income freely, and up to $25,000/yr can offset ordinary (W-2) income if you actively participate and your MAGI is under $100k (phasing out to $0 by $150k); unused losses carry forward. On sale, claimed depreciation is recaptured at up to 25%, and gains may owe capital-gains tax (a 1031 exchange can defer both). Figures are a year-1 estimate at your 24.0% rate — not tax advice; consult a CPA.
Condition & rehab AI · 6 photos
This nearly 1,600 square foot single-family home in Brooklawn, NJ is in good condition and ready for a new owner. It offers a good investment opportunity with potential for both resale and rental value through cosmetic updates and improvements.
Value-add opportunities
- Both Painting the exterior — Fresh paint can enhance curb appeal and the home's value.
- Both Landscaping improvements — A well-maintained yard can increase both resale and rental value.
- Resale Interior updates — Updating the interior can attract more buyers and increase the home's value.
- Both HVAC maintenance — A functioning HVAC system is essential for comfort and can improve both resale and rental value.
- Resale Kitchen and bathroom updates — Updating these spaces can attract more buyers and increase the home's value.
- Both Roof inspection — A roof inspection can ensure the roof is in good condition and can improve both resale and rental value.
Renovation cost estimate screening
Value-add ROI direction
- Both Painting the exterior — Fresh paint can enhance curb appeal and the home's value. ↑
- Both Landscaping improvements — A well-maintained yard can increase both resale and rental value. ↑
- Resale Interior updates — Updating the interior can attract more buyers and increase the home's value. ↑
- Both HVAC maintenance — A functioning HVAC system is essential for comfort and can improve both resale and rental value. ↑
- Resale Kitchen and bathroom updates — Updating these spaces can attract more buyers and increase the home's value. ↑
- Both Roof inspection — A roof inspection can ensure the roof is in good condition and can improve both resale and rental value. ↑
ⓘ Cost ranges are severity-bucket heuristics (US national rule-of-thumb). Get contractor quotes + a written scope before underwriting a rehab budget.
Schools (NCES district)
- District
- Brooklawn Public School District
- NCES district ID
- 3402370
- Math proficiency
- 29% ▲ 4.00%
- Reading proficiency
- 43% ▲ 8.00%
- Median HH income
- $59,313
- Composite
- 34.63/100
- National rank
- #10075
- State rank
- #518 of 612 in NJ
Livability — Brooklawn
- Score
- 64/100
- State rank
- #419
- US rank
- #14719
Category grades
Schools grade is shown separately in the Schools card above.
Census & demographics
- Census place
- Brooklawn, NJ
- County
- Camden County · 407,624 people
- Metro
- Philadelphia-Camden-Wilmington, PA-NJ-DE-MD
- Population (ZIP)
- 13,217
- Household income
- $63,384
- Rent vs Own
- Severe rent burden
- 431.0
Population outlook (Camden County) Hauer SSP2
- Today (2025)
- 507,964 people
- By 2030
- 502,182 · -1.1%
- By 2040
- 485,602 · -4.4%
- By 2050
- 465,630 · -8.3%
- By 2075
- 419,986 · -17.3%
- By 2100
- 369,492 · -27.3%
Race, ethnicity, and origin ACS 2023
- Neighborhood character
- Predominantly White (68%)
- Race & ethnicity
- White 68% Hispanic / Latino 18% Black 7% Asian 5% Two or more races 5%
- Hispanic origin (detail)
- Mexican 4% Puerto Rican 10%
- Common ancestry
- Romanian 4% Lithuanian 3% Hispanic 2%
- Foreign-born
- 8% · Canada, Jamaica, China
- Languages at home
- 81% English-only · Spanish 13% Other Indo-European 4% Arabic 1%
Political lean MEDSL · Camden
- 2024 margin
- Strong D (+27.4) · D 63.0% · R 35.5% · Other 1.5%
- 2008→2024 swing
- -8.8pp toward R · 2008: 36.2pp · 2024: 27.4pp
- All cycles
- 2024: D+27.4 2020: D+33.5 2016: D+32.4 2012: D+36.6 2008: D+36.2
Not yet ingested
- Civics
- —
Market trends
- HPI YoY
- ▼ -115.59%
- Current HPI
- 298.9139
- Rent YoY
- —
- Metro
- Philadelphia-Camden-Wilmington, PA-NJ-DE-MD
- State GDP YoY
- ▲ 2.05%
- F500 in state
- 34
Industry mix (Fortune 500 HQ in NJ)
| Industry | F500 HQs | Revenue |
|---|---|---|
| Consumer Goods | 3 | $31B |
|
||
| Pharmaceuticals | 2 | $153B |
|
||
| Technology | 2 | $21B |
|
||
| Insurance | 2 | $20B |
|
||
| Healthcare | 2 | $19B |
|
||
| Financial Services | 1 | $70B |
|
||
Price history
+0.0% since first listed2 events — show timeline
- 2026-05-02 Listed $285,000 BRIGHT MLS
- 2026-04-28 Coming Soon $285,000 BRIGHT MLS
Cash-flow waterfall
monthlySold comps — $/sqft
last 12 mo · ≤1 miLoading sold comps…