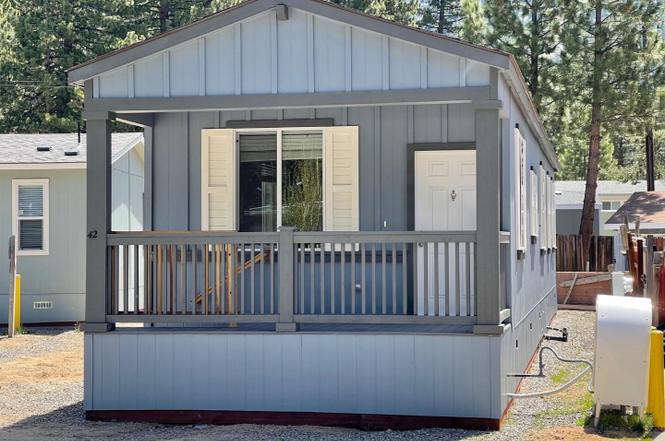
3740 Blackwood Rd #42 · South Lake Tahoe, CA
Flood risk 6/10 · Moderate
- FEMA flood zone
- X (unshaded)
- Chance of flooding over 30 yrs
- 0.69%
- Est. flood insurance / yr
- $507 – $1,088
Fire risk 5/10 · Moderate
- Est. fire insurance / yr
- $659 – $1,223
Heat risk 1/10 · Minimal
- Hot days now (above 81°F)
- 7 days/yr
- Hot days in 30 yrs
- 17 days/yr
Wind risk 1/10 · Minimal
- Chance of severe wind over 30 yrs
- —
Air-quality risk 7/10 · Major
- Unhealthy air days now
- 13 days/yr
- Unhealthy air days in 30 yrs
- 15 days/yr
Risk factors via First Street. Map © Google.
Why this score? — see what drove the B- grade
The composite is a weighted blend of 9 inputs, each scored 0–100. Each bar is that input's sub-score; the figure is the points it added to the 100-point composite (weight × sub-score).
- Cash flow +30.0/30.0
- DSCR +10.0/10.0
- 1% rule +9.3/10.0
- ARV discount +4.1/15.0
- Schools +3.5/10.0
- Rent growth +3.4/5.0
- Livability +3.2/5.0
- Condition / age +2.5/5.0
- Appreciation +0.0/10.0
$149,990
🖨 Deal sheet 📄 Offer letter ✓ Due diligence
Listing remarks
✨ In the Heart of South Lake Tahoe! Welcome to Heavenly Valley Estates an all-ages, vibrant community perfectly located near restaurants, shops, world-class skiing, and the lake! This 2021 home offers 2 bedrooms, 1 bath, and features our sleek black appliance package, modern finishes, and move-in ready comfort, this home is your gateway to the South Lake Tahoe lifestyle. 🏡 Why rent when you can own? Affordable financing options available (on approved credit) with low down payments and flexible monthly terms. 💰 Special Offer: Close by the end of September to lock in the best pricing in town! Live in a community full of pride and surrounded by the stunning beauty of the Sierra Nevada M
Key facts
- Built 2021
- Listed 190 days
Neighborhood map
What this means for you Summary
Snapshot
- This is a 2-bed/1.0-bath manufactured listed at $150k.
Deal economics
- At list price, monthly cash flow is $652 ($8k/yr) — positive.
- The deal already cash-flows at list — no discount required.
- Meets the 1% rule at list price ($2k rent vs $150k).
- Recommended offer: $132k (12.0% below list) — sets the bar for market timing.
- Cap rate 11.5% vs local median 2.5% in South Lake Tahoe — top-decile yield for the area; either an underpriced asset or a hidden risk that comps aren't pricing in. Stress-test before assuming the spread holds.
Location & tenants
- Location reads 65/100 on livability (#371 in CA) — a middle-class / working-renter tenant base. Strengths: health & safety A+; Watch: schools D-, crime F, commute F.
- Lake Tahoe Unified (town): math 33% / reading 43% proficiency, ranked #786 of 1,400 in CA (top 56%) — families likely to look elsewhere, expect single-tenant / working-renter base with shorter leases.
- Market conditions: Rents rising (+3.6%/yr); 307 active listings in the ZIP; 25 comparable units currently listed for rent nearby; rentals at typical pace (median 18d on market — plan ~3-4 weeks tenant-placement turnaround); solid renter incomes; 437 units permitted in El Dorado County in 2024 (0 in 5+ unit buildings).
Forward outlook
- Local home prices are declining (-3.0%/yr); year-one equity from $1k of loan paydown is wiped out by about $4k of value loss. Plan a longer hold.
- El Dorado County population projected to shrink 3% by 2050 — rents likely to lag national; underwrite the cash flow, not the appreciation.
- At projected returns (-3.0% appreciation + 3.6% rent growth), your $42k cash investment doubles in ~7 years — after that, you're playing with house money.
Negotiation context
- It's been on market 190 days — a 12% lower offer ($132k) is reasonable based on typical stale-listing flexibility.
Risks & watch-outs
- Climate carrying-cost: major flood risk; moderate wildfire risk — expect insurance premiums to compound above CPI over the hold.
Questions for the listing agent
- It's been on market 190 days. Have you received any prior offers? Is the seller open to a 12% concession, seller financing, or rate buy-down credit?
- Why hasn't it sold? Are there any deal-killer items the seller is aware of (foundation, flood, title, zoning, code violations)?
- Is there a deadline driving the sale (1031 exchange, divorce, estate, relocation)? That informs how much negotiation room exists.
- Schools are D-rated, which usually means shorter tenancies and higher turnover. Who's the typical renter profile here, and what's been the actual vacancy rate?
- Crime grade is F in this area — have there been break-ins, vandalism, or insurance claims at this property in the last 3 years? What carrier currently insures it and at what premium?
- What's the average days-on-market for RENTAL listings here right now (not sales)? A rising rental-DOM trend means longer vacancies and softer asking-rent achievability than the comps imply.
- What's the recent tenant-quality profile in this submarket — average credit score on applications, eviction rate, late-payment / NSF rate, and stable-employment percentage? A property-management company in the area should have these aggregated.
- How much new for-sale + rental construction is in the pipeline within 1–3 miles? Heavy new supply typically softens prices + rents 12–24 months out; constrained supply supports both.
Investment metrics
- 1% rule
- 1.43% ✓
- Cap rate
- 11.51%
- Cash-on-cash
- 18.63%
- DSCR
- 1.83
- GRM
- 5.8
CMA / ARV
- ARV (on-the-fly)
- $139,500
- Comps found
- 4
Show comp detail 4 sales within ~0.75 mi
| Address | Dist | Beds/Ba | Sqft | Sold | Price | $/sf | Match |
|---|---|---|---|---|---|---|---|
| 3740 Blackwood Rd #42 | 0.00mi | 2/1.0 | 900 (0%) | 0mo | $140,000 | $156 | 100 |
| 3740 Blackwood Rd #40 | 0.00mi | 3/2.0 (+1) | 900 (0%) | 9mo | $120,000 | $133 | 83 |
| 3740 Blackwood Rd #52 | 0.04mi | 3/2.0 (+1) | 840 (-7%) | 2mo | $130,000 | $155 | 76 |
| 3740 Blackwood Rd #22 | 0.00mi | 3/2.0 (+1) | 768 (-15%) | 9mo | $40,000 | $52 | 59 |
Match score weights: distance 35% · size 25% · config 20% · recency 20%. Top-matched comps best support the ARV.
Projected returns pro-forma
-3.0% appreciation · 3.56% rent growth · sell at horizon
- IRR
- 11.0%
- Equity multiple
- 1.44×
- Total profit
- $18,463
- Equity at exit
- $22,364
- IRR
- 20.5%
- Equity multiple
- 2.78×
- Total profit
- $74,703
- Equity at exit
- $12,968
Cash invested: $41,997 (down + closing). Projections, not guarantees.
Landlord ↔ Tenant lean methodology
- Overall (STATE)
- 18 Strongly Tenant-Friendly
- State California
- 18 Strongly Tenant-Friendly · D+13
- County
- — inherits STATE
- City
- — inherits STATE
ZIP-level market 96150
- Rents YoY
- 3.6%
- Active inventory
- 307
- Price-to-rent
- 5.8×
Monthly cashflow live
- Estimated rent
- $2,137 high interval (Pro) →
- Mortgage (P&I)
- −$787
- Tax est. 1.5%
- −$187 /mo · $2,250/yr
- Insurance
- −$62
- HOA
- −$0
- Vacancy / Maint / Mgmt
- −$449
- Net cashflow
- $652
Break-even live
UW: 25.0% down · 7.5% · 30yr · 1.5% tax · 5.0% vac · 8.0% maint · 8.0% mgmt
Financing live
Cash to close
- Down payment
- $37,498
- Closing costs
- $4,500
- Reserves months
- —
- Total cash needed
- —
Loan-product check · same deal, 3 products live
Conventional
25% down · 7.5% · 30yr
- Down + closing
- —
- Monthly P&I
- —
- Monthly cashflow
- —
- DSCR
- —
- Eligible?
- —
Personal DTI + credit; lowest rate.
DSCR
20% down · 8.5% · 30yr
- Down + closing
- —
- Monthly P&I
- —
- Monthly cashflow
- —
- DSCR
- —
- Eligible?
- —
No personal income docs; deal must DSCR.
Hard money
10% down · 12.0% · 12mo
- Down + closing
- —
- Monthly P&I
- —
- Monthly cashflow
- —
- DSCR
- —
- Eligible?
- —
Short-term bridge; refi at stabilization.
Rent comps 25 comps
| Address | Beds | Baths | Sqft | Rent | $/sqft | DOM | Units | Dist |
|---|---|---|---|---|---|---|---|---|
| 3624 Terry Ln Unit 26 South Lake Tahoe, CA | 2.0 | 1.0 | 728 | $1,895 | $2.60 | 16d | 1 | 0.18mi |
| 1232 Ski Run Blvd South Lake Tahoe, CA | 1.0 | 1.0 | 700 | $1,500 | $2.14 | 2d | 1 | 0.19mi |
| 3668 Spruce Ave Unit 21 South Lake Tahoe, CA | 1.0 | 1.0 | 595 | $1,449 | $2.44 | 44d | 1 | 0.32mi |
| 3671 Spruce Ave Unit 5 South Lake Tahoe, CA | 1.0 | 1.0 | 636 | $1,725 | $2.71 | 3d | 1 | 0.34mi |
| 3671 Spruce Ave Unit 1 South Lake Tahoe, CA | 1.0 | 1.0 | 650 | $1,750 | $2.69 | 44d | 1 | 0.34mi |
| 3720 Ruby Way Unit 2 South Lake Tahoe, CA | 2.0 | 1.0 | 950 | $2,300 | $2.42 | 44d | 1 | 0.38mi |
| 1116 Herbert Ave South Lake Tahoe, CA | 3.0 | 1.0 | 896 | $2,495 | $2.78 | 44d | 1 | 0.44mi |
| 1439 Ski Run Blvd Unit E1 South Lake Tahoe, CA | 3.0 | 2.0 | 1060 | $2,500 | $2.36 | 20d | 1 | 0.48mi |
| 1439 Ski Run Blvd Unit D-2 South Lake Tahoe, CA | 2.0 | 1.5 | 1000 | $2,200 | $2.20 | 18d | 1 | 0.48mi |
| 1439 Ski Run Blvd Unit H1 South Lake Tahoe, CA | 3.0 | 1.5 | 1060 | $3,250 | $3.07 | 23d | 1 | 0.49mi |
| 3679 Alder Ave South Lake Tahoe, CA | 2.0 | 2.0 | 683 | $2,200 | $3.22 | 3d | 1 | 0.53mi |
| 3780 Stewart Way Unit 6 South Lake Tahoe, CA | 2.0 | 1.0 | 616 | $2,500 | $4.06 | 12d | 1 | 0.54mi |
| 3716 Pioneer Trl Unit 4 South Lake Tahoe, CA | 2.0 | 1.0 | 900 | $2,100 | $2.33 | 44d | 1 | 0.57mi |
| 3361 Heavenly Valley Rd South Lake Tahoe, CA | 3.0 | 2.0 | 1092 | $3,600 | $3.30 | 44d | 1 | 0.77mi |
| 3815 Forest Ave Unit A South Lake Tahoe, CA | 2.0 | 1.5 | 1000 | $2,450 | $2.45 | 23d | 1 | 0.78mi |
| 3841 Pentagon Rd Unit 3 South Lake Tahoe, CA | 2.0 | 1.0 | 900 | $1,700 | $1.89 | 18d | 1 | 0.87mi |
| 1070 Echo Rd Unit EME6 South Lake Tahoe, CA | 2.0 | 1.0 | 850 | $1,795 | $2.11 | 15d | 1 | 1.08mi |
| 1037 Echo Rd Unit 3 South Lake Tahoe, CA | 1.0 | 1.0 | 545 | $1,875 | $3.44 | 4d | 1 | 1.10mi |
| 1037 Echo Rd Unit 4 South Lake Tahoe, CA | 1.0 | 1.0 | 545 | $1,975 | $3.62 | 18d | 1 | 1.10mi |
| 1037 Fern Rd South Lake Tahoe, CA | 2.0 | 1.5 | 1080 | $2,400 | $2.22 | 44d | 1 | 1.15mi |
| 3993 Manzanita Ave Unit 8 South Lake Tahoe, CA | 1.0 | 1.0 | 700 | $1,595 | $2.28 | 15d | 1 | 1.22mi |
| 966 Modesto Ave South Lake Tahoe, CA | 1.0–2.0 | 1.0 | 450 | $1,590 | $3.53 | 2d | 2 | 1.26mi |
| 946 Modesto Ave Unit 4 South Lake Tahoe, CA | 1.0 | 1.0 | 600 | $1,695 | $2.83 | 44d | 1 | 1.30mi |
| 945 Alameda Ave South Lake Tahoe, CA | 3.0 | 1.0 | 1008 | $2,700 | $2.68 | 44d | 1 | 1.34mi |
| 881 Modesto Ave Unit 6 South Lake Tahoe, CA | 1.0 | 1.0 | 670 | $1,450 | $2.16 | 4d | 1 | 1.46mi |
Climate risk First Street
- Flood 6/10 Major FEMA zone X (unshaded) · 69% chance over 30 yrs
- Wildfire 5/10 Major
- Heat 1/10 Low 7 d/yr ≥81°F today · 17 d/yr by 30 yrs out
- Wind 1/10 Low
- Air quality 7/10 Severe 13 unhealthy d/yr today · 15 by 30 yrs out
Nearby sold comps map
Loading sold comps map…
Walkable amenities ~0.75 mi
Loading nearby amenities…
Taxation est. · year 1
- Rental income
- $25,648
- − Mortgage interest
- −$8,402
- − Property taxes
- −$2,250
- − Insurance
- −$750
- − Repairs & maintenance
- −$2,052
- − Management
- −$2,052
- − Depreciation
- −$4,363
- Taxable income
- $5,780
- Est. tax owed @ 24.0%
- −$1,387
- After-tax cash flow
- $6,436/yr
For passive investors: Depreciation is non-cash, so a rental often shows a tax loss while cash-flowing — sheltering income. Rental losses are passive: they offset passive income freely, and up to $25,000/yr can offset ordinary (W-2) income if you actively participate and your MAGI is under $100k (phasing out to $0 by $150k); unused losses carry forward. On sale, claimed depreciation is recaptured at up to 25%, and gains may owe capital-gains tax (a 1031 exchange can defer both). Figures are a year-1 estimate at your 24.0% rate — not tax advice; consult a CPA.
Schools (NCES district)
- District
- Lake Tahoe Unified
- NCES district ID
- 0620640
- Math proficiency
- 33% ▼ -1.00%
- Reading proficiency
- 43% ▲ 1.00%
- Median HH income
- $49,114
- Composite
- 35.24/100
- National rank
- #9844
- State rank
- #786 of 1400 in CA
Livability — South Lake Tahoe
- Score
- 65/100
- State rank
- #371
- US rank
- #12667
Category grades
Schools grade is shown separately in the Schools card above.
Census & demographics
- Census place
- South Lake Tahoe, CA
- County
- El Dorado County · 144,198 people
- City population
- 29,646
- Metro
- Sacramento-Roseville-Folsom, CA
- Population (ZIP)
- 29,646
- Household income
- $92,517
- Rent vs Own
- Severe rent burden
- 1109.0
Population outlook (El Dorado County) Hauer SSP2
- Today (2025)
- 191,666 people
- By 2030
- 193,662 · +1.0%
- By 2040
- 192,583 · +0.5%
- By 2050
- 185,904 · -3.0%
- By 2075
- 169,543 · -11.5%
- By 2100
- 139,623 · -27.2%
Race, ethnicity, and origin ACS 2023
- Neighborhood character
- Majority White (64%)
- Race & ethnicity
- White 64% Hispanic / Latino 24% Two or more races 11% Asian 5%
- Hispanic origin (detail)
- Mexican 19%
- Common ancestry
- Lithuanian 3% Slovak 3% Romanian 2%
- Foreign-born
- 17% · Canada, China, South Korea
- Languages at home
- 76% English-only · Spanish 17% Tagalog/Filipino 2% Other Asian/Pacific 1%
Political lean MEDSL · El Dorado
- 2024 margin
- R (+12.0) · D 42.6% · R 54.6% · Other 2.8%
- 2008→2024 swing
- -1.5pp toward R · 2008: -10.5pp · 2024: -12.0pp
- All cycles
- 2024: R+12.0 2020: R+8.8 2016: R+13.9 2012: R+18.2 2008: R+10.5
Not yet ingested
- Civics
- —
Market trends
- HPI YoY
- ▼ -571.55%
- Current HPI
- 316.6411
- Rent YoY
- ▲ 3.56%
- Metro
- Sacramento-Roseville-Folsom, CA
- State GDP YoY
- ▲ 3.21%
- F500 in state
- 116
Industry mix (Fortune 500 HQ in CA)
| Industry | F500 HQs | Revenue |
|---|---|---|
| Technology | 27 | $1,492B |
|
||
| Financial Services | 3 | $174B |
|
||
| Retail | 3 | $44B |
|
||
| Insurance | 3 | $26B |
|
||
| Media / Entertainment | 2 | $115B |
|
||
| Pharmaceuticals / Biotech | 2 | $62B |
|
||
Cash-flow waterfall
monthlySold comps — $/sqft
last 12 mo · ≤1 miLoading sold comps…