 Multi-family
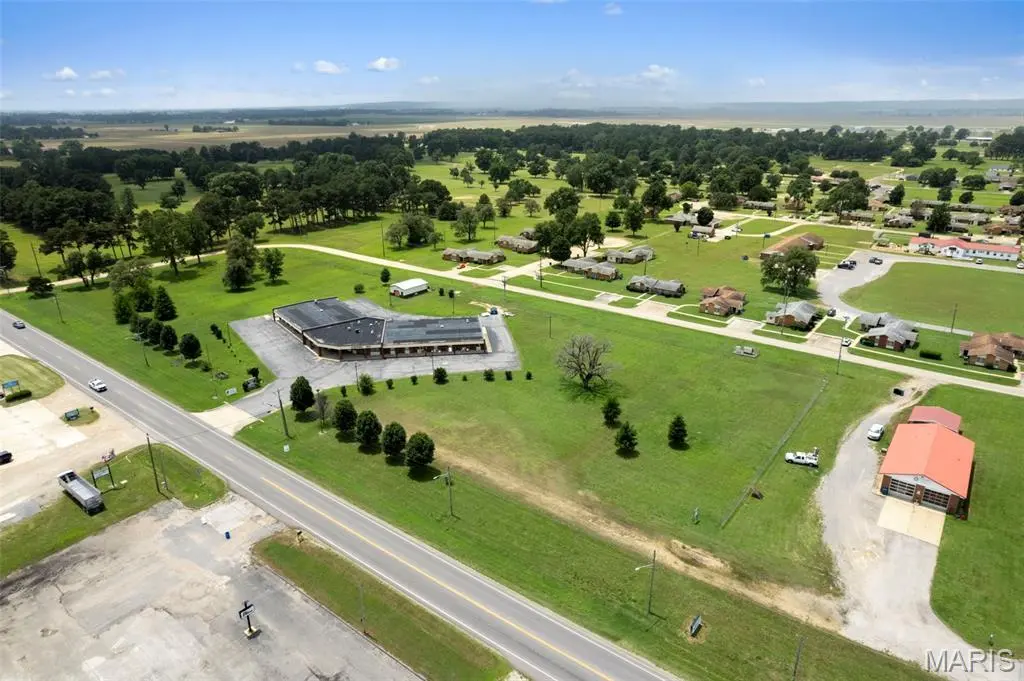
2889 N Douglas · Malden, MO
Flood risk No data
- FEMA flood zone
- —
- Chance of flooding over 30 yrs
- —
- Est. flood insurance / yr
- —
Fire risk No data
- Est. fire insurance / yr
- —
Heat risk No data
- Hot days now (above threshold)
- —
- Hot days in 30 yrs
- —
Wind risk No data
- Chance of severe wind over 30 yrs
- —
Air-quality risk No data
- Unhealthy air days now
- —
- Unhealthy air days in 30 yrs
- —
Risk factors via First Street. Map © Google.
Why this score? — see what drove the B- grade
The composite is a weighted blend of 9 inputs, each scored 0–100. Each bar is that input's sub-score; the figure is the points it added to the 100-point composite (weight × sub-score).
- Cash flow +29.0/30.0
- DSCR +10.0/10.0
- 1% rule +8.1/10.0
- ARV discount +7.5/15.0
- Appreciation +6.6/10.0
- Livability +3.0/5.0
- Rent growth +2.5/5.0
- Schools +2.0/10.0
- Condition / age +1.0/5.0
$399,000
🖨 Deal sheet 📄 Offer letter ✓ Due diligence
Multi-family units
County records classify this as Multi-Family (5+ Unit). Listing-text estimate: 1 unit. estimate disagrees with records
5+ unit building — per-unit beds/baths from public records are typically unavailable; the breakdown below (if shown) is an estimate from the listing text.
Key facts
- Built 1988
- Listed 7 days
Property features AI
Finance
- Other: Multiple outbuildings: storage, utility building, workshop; Road frontage on highway with asphalt road surface; Above-grade finished area approximately 14,277 (source: assessor)
- Financial info: No auction; tax information not included per instructions
- HOA & community: Community amenities include airport/runway, fitness center, golf and park
Exterior
- Parking: Asphalt parking surface
- Security: Carbon monoxide detectors; Fire alarm; Fire sprinkler system
- Utilities: Public water; Sewer connected; Electricity connected (220 volts); Natural gas connected; Phone connected
- Home design: Residential income property; 5-family (five or more) apartment building; Private ownership; Entry/ground-level foundation: slab
- Construction: Brick, stucco and other construction materials
- Exterior features: Covered patio/porch; Awnings; Partially fenced
Interior
- Kitchen: Other appliances
- Bedrooms: No main or upper level bedrooms listed
- Flooring: Laminate
- Bathrooms: No main or upper level bathrooms listed
- Heating & cooling: Natural gas heating; Central air; Wall/window air conditioning units
- Interior features: Laminate flooring; Other kitchen appliances
- Laundry & utility: Laundry on 2nd floor
Neighborhood map
What this means for you Summary
Snapshot
- This is a multifamily listed at $399k. Condition is rated poor.
Deal economics
- At list price, monthly cash flow is $1k ($16k/yr) — positive.
- The deal already cash-flows at list — no discount required.
- Meets the 1% rule at list price ($5k rent vs $399k).
- Cap rate 10.4% vs local median 7.3% in Malden — top-decile yield for the area; either an underpriced asset or a hidden risk that comps aren't pricing in. Stress-test before assuming the spread holds.
Location & tenants
- Location reads 59/100 on livability (#572 in MO) — a working-class tenant base; expect higher turnover. Strengths: cost of living A+, housing A+; Watch: health & safety C-, crime F, amenities F.
- Malden R-I (town): math 19% / reading 31% proficiency, ranked #294 of 324 in MO (top 91%) — low school quality limits family demand, transient renter base, plan for 1-2y turnover; 63% free/reduced lunch — lower-income household profile, screen leases tightly.
- Zoned schools: Malden Lower Elem. (math 23% / reading 35%, grade F, #842 of 1,115 statewide, top 76%, 454 students, 100% FRL); Malden High (math 12% / reading 27%, grade F, #478 of 521 statewide, top 92%, 425 students, 100% FRL) — zoned schools average 100% FRL vs 63% district-wide (37 pts higher); higher-poverty schools than district average — tighter screening recommended.
- Market conditions: 35 active listings in the ZIP; 30 units permitted in Dunklin County in 2024 (0 in 5+ unit buildings).
Forward outlook
- In year one you build about $16k of equity ($3k loan paydown + $13k appreciation (3.3% local appreciation)).
- Dunklin County population projected at -22% by 2050 — secular population decline; favor cash flow + early exit over multi-decade hold.
- At projected returns (3.3% appreciation + 3.0% rent growth), your $112k cash investment doubles in ~4 years — after that, you're playing with house money.
- By year 3, paydown + projected appreciation supports a ~$39k cash-out refi (75% LTV) — recoverable capital for the next deal without selling this one.
Negotiation context
- Only 8 days on market — expect competitive offers; lowballing is unlikely to land.
Questions for the listing agent
- Have any recent inspections been done? Can we get a copy of the seller's disclosures and any deferred-maintenance estimates?
- Is there a deadline driving the sale (1031 exchange, divorce, estate, relocation)? That informs how much negotiation room exists.
- Schools are F-rated, which usually means shorter tenancies and higher turnover. Who's the typical renter profile here, and what's been the actual vacancy rate?
- Crime grade is F in this area — have there been break-ins, vandalism, or insurance claims at this property in the last 3 years? What carrier currently insures it and at what premium?
- What's the average days-on-market for RENTAL listings here right now (not sales)? A rising rental-DOM trend means longer vacancies and softer asking-rent achievability than the comps imply.
- What's the recent tenant-quality profile in this submarket — average credit score on applications, eviction rate, late-payment / NSF rate, and stable-employment percentage? A property-management company in the area should have these aggregated.
- How much new apartment / multifamily construction is in the pipeline within 1–3 miles? Heavy new supply (>2% of stock underway) typically softens rents 12–24 months out; light construction supports rent growth.
Investment metrics
- 1% rule
- 1.31% ✓
- Cap rate
- 10.39%
- Cash-on-cash
- 14.62%
- DSCR
- 1.65
- GRM
- 6.4
CMA / ARV
No comps found within radius.
Projected returns pro-forma
3.26% appreciation · 3.0% rent growth · sell at horizon
- IRR
- 21.8%
- Equity multiple
- 2.26×
- Total profit
- $140,300
- Equity at exit
- $185,239
- IRR
- 22.6%
- Equity multiple
- 4.32×
- Total profit
- $371,430
- Equity at exit
- $290,094
Cash invested: $111,720 (down + closing). Projections, not guarantees.
Landlord ↔ Tenant lean methodology
- Overall (STATE)
- 81 Strongly Landlord-Friendly
- State Missouri
- 81 Strongly Landlord-Friendly · R+10
- County
- — inherits STATE
- City
- — inherits STATE
ZIP-level market 63863
- Home prices YoY
- 2.9%
- Active inventory
- 35
- Price-to-rent
- 31.9×
Monthly cashflow live
- Estimated rent
- $5,213 medium interval (Pro) →
- Mortgage (P&I)
- −$2,092
- Tax est. 1.5%
- −$499 /mo · $5,985/yr
- Insurance
- −$166
- HOA
- −$0
- Vacancy / Maint / Mgmt
- −$1,095
- Net cashflow
- $1,361
Break-even live
5-unit breakdown (identical units grouped — click to expand)
| Units | Beds | Baths | Est. rent |
|---|---|---|---|
| 5× units | 2 | 1.5 | $5,215 |
| #1 | 2 | 1.5 | $1,043 |
| #2 | 2 | 1.5 | $1,043 |
| #3 | 2 | 1.5 | $1,043 |
| #4 | 2 | 1.5 | $1,043 |
| #5 | 2 | 1.5 | $1,043 |
| Total (5 units) | $5,213 | ||
UW: 25.0% down · 7.5% · 30yr · 1.5% tax · 5.0% vac · 8.0% maint · 8.0% mgmt
Financing live
Cash to close
- Down payment
- $99,750
- Closing costs
- $11,970
- Reserves months
- —
- Total cash needed
- —
Loan-product check · same deal, 3 products live
Conventional
25% down · 7.5% · 30yr
- Down + closing
- —
- Monthly P&I
- —
- Monthly cashflow
- —
- DSCR
- —
- Eligible?
- —
Personal DTI + credit; lowest rate.
DSCR
20% down · 8.5% · 30yr
- Down + closing
- —
- Monthly P&I
- —
- Monthly cashflow
- —
- DSCR
- —
- Eligible?
- —
No personal income docs; deal must DSCR.
Hard money
10% down · 12.0% · 12mo
- Down + closing
- —
- Monthly P&I
- —
- Monthly cashflow
- —
- DSCR
- —
- Eligible?
- —
Short-term bridge; refi at stabilization.
Listing history 6 events
-
2026-06-18days on market $399,000 Active 8 DOM
-
2026-06-17days on market $399,000 Active 7 DOM
-
2026-06-16days on market $399,000 Active 6 DOM
-
2026-06-15days on market $399,000 Active 5 DOM
-
2026-06-13days on market $399,000 Active 3 DOM
-
2026-06-12$399,000 Active 2 DOM
ⓘ Source: listings_history table (triggers on properties + properties_extension) + one-shot
backfill from property_details.listing_events for pre-trigger history.
Nearby sold comps map
Loading sold comps map…
Walkable amenities ~0.75 mi
Loading nearby amenities…
Taxation est. · year 1
- Rental income
- $62,556
- − Mortgage interest
- −$22,350
- − Property taxes
- −$5,985
- − Insurance
- −$1,995
- − Repairs & maintenance
- −$5,004
- − Management
- −$5,004
- − Depreciation
- −$11,607
- Taxable income
- $10,610
- Est. tax owed @ 24.0%
- −$2,546
- After-tax cash flow
- $13,784/yr
For passive investors: Depreciation is non-cash, so a rental often shows a tax loss while cash-flowing — sheltering income. Rental losses are passive: they offset passive income freely, and up to $25,000/yr can offset ordinary (W-2) income if you actively participate and your MAGI is under $100k (phasing out to $0 by $150k); unused losses carry forward. On sale, claimed depreciation is recaptured at up to 25%, and gains may owe capital-gains tax (a 1031 exchange can defer both). Figures are a year-1 estimate at your 24.0% rate — not tax advice; consult a CPA.
Condition & rehab AI · 12 photos
This multi-family property requires extensive repairs and maintenance to bring it up to a livable condition. Significant investments in the roof, exterior, flooring, and landscaping are necessary to increase its resale and rental value.
Repairs flagged
- Major roof — Signs of significant damage
- Major exterior — Structural damage visible
- Major flooring — Worn and possibly damaged
- Major interior walls/paint — Worn and possibly damaged
- Major HVAC/mechanicals — Not visible, but likely outdated
- Major landscaping — Overgrown and unkempt
Value-add opportunities
- Both roof replacement — Critical to safety and appearance
- Both exterior repairs — Improves safety and appearance
- Both flooring replacement — Improves safety and appearance
- Both paint job — Improves safety and appearance
- Both HVAC replacement — Improves comfort and energy efficiency
- Both landscaping — Improves curb appeal and safety
Renovation cost estimate screening
| Repair item | Severity | Est. cost |
|---|---|---|
| roof · Signs of significant damage | Major | $15,000–50,000 |
| exterior · Structural damage visible | Major | $15,000–50,000 |
| flooring · Worn and possibly damaged | Major | $15,000–50,000 |
| interior walls/paint · Worn and possibly damaged | Major | $15,000–50,000 |
| HVAC/mechanicals · Not visible, but likely outdated | Major | $15,000–50,000 |
| landscaping · Overgrown and unkempt | Major | $15,000–50,000 |
| Total estimated repair cost · 6 items | $90,000–300,000 |
Value-add ROI direction
- Both roof replacement — Critical to safety and appearance ↑
- Both exterior repairs — Improves safety and appearance ↑
- Both flooring replacement — Improves safety and appearance ↑
- Both paint job — Improves safety and appearance ↑
- Both HVAC replacement — Improves comfort and energy efficiency ↑
- Both landscaping — Improves curb appeal and safety ↑
ⓘ Cost ranges are severity-bucket heuristics (US national rule-of-thumb). Get contractor quotes + a written scope before underwriting a rehab budget.
Schools (NCES district)
- District
- Malden R-I
- NCES district ID
- 2919890
- Math proficiency
- 19% ▼ -13.00%
- Reading proficiency
- 31% ▼ -3.00%
- Median HH income
- $29,537
- Composite
- 20.06/100
- National rank
- #8656
- State rank
- #294 of 324 in MO
Livability — Malden
- Score
- 59/100
- State rank
- #572
- US rank
- #20610
Category grades
Schools grade is shown separately in the Schools card above.
Census & demographics
- Census place
- Malden, MO
- City population
- 5,348
- Population (ZIP)
- 5,348
Population outlook (Dunklin County) Hauer SSP2
- Today (2025)
- 28,599 people
- By 2030
- 27,230 · -4.8%
- By 2040
- 24,696 · -13.6%
- By 2050
- 22,402 · -21.7%
- By 2075
- 17,776 · -37.8%
- By 2100
- 13,890 · -51.4%
Race, ethnicity, and origin ACS 2023
- Neighborhood character
- Predominantly White (79%)
- Race & ethnicity
- White 79% Black 11% Two or more races 6% Hispanic / Latino 3%
- Common ancestry
- Italian 3% Slovak 2% Serbian 2%
- Foreign-born
- 2% · Canada
- Languages at home
- 97% English-only · Spanish 3% Other Indo-European 1%
Political lean MEDSL · Dunklin
- 2024 margin
- Solid R (+61.8) · D 18.8% · R 80.5%
- 2008→2024 swing
- -40.5pp toward R · 2008: -21.3pp · 2024: -61.8pp
- All cycles
- 2024: R+61.8 2020: R+57.0 2016: R+53.6 2012: R+30.2 2008: R+21.3
Not yet ingested
- Civics
- —
Market trends
- HPI YoY
- ▲ 3.26%
- Current HPI
- 116.067
- Rent YoY
- —
- Metro
- —
- State GDP YoY
- ▲ 1.84%
- F500 in state
- 20
Industry mix (Fortune 500 HQ in MO)
| Industry | F500 HQs | Revenue |
|---|---|---|
| Healthcare | 1 | $163B |
|
||
| Insurance | 1 | $21B |
|
||
| Industrial Technology | 1 | $17B |
|
||
| Retail | 1 | $16B |
|
||
| Industrial Distribution | 1 | $10B |
|
||
| Utilities | 1 | $9B |
|
||
Price history
1 event — show timeline
- 2026-06-10 Listed $399,000 MARIS as Distributed by MLS Grid
Cash-flow waterfall
monthlySold comps — $/sqft
last 12 mo · ≤1 miLoading sold comps…