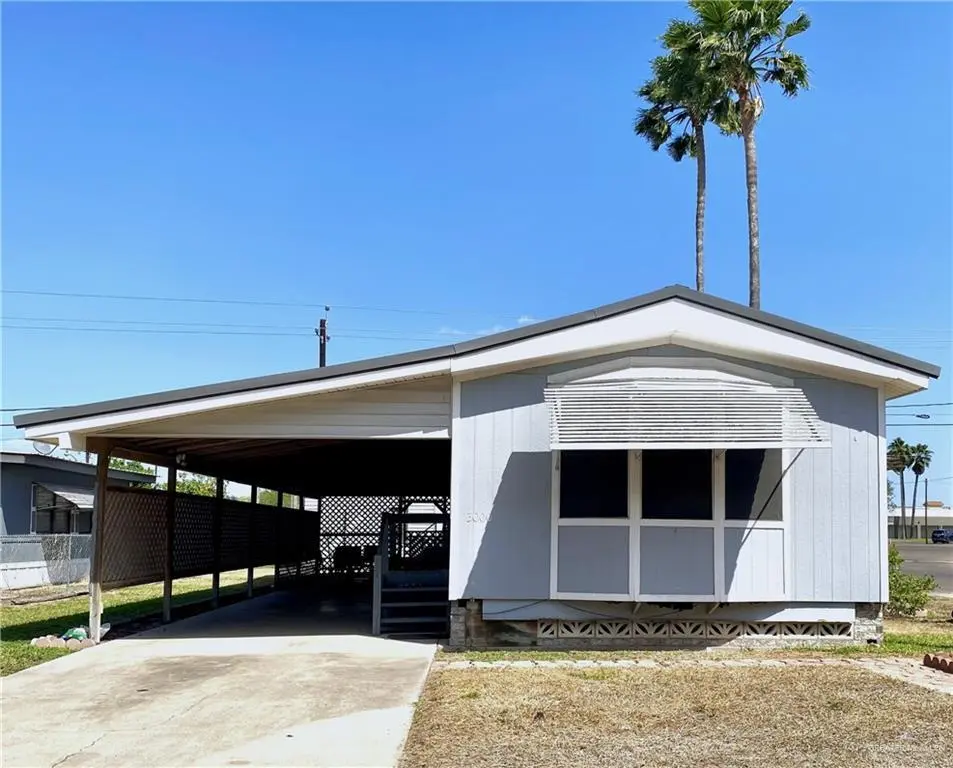
3000 Spur Dr Unit J9 · Mission, TX
Flood risk 7/10 · Major
- FEMA flood zone
- X
- Chance of flooding over 30 yrs
- 0.96%
- Est. flood insurance / yr
- $507 – $1,088
Fire risk 1/10 · Minimal
- Est. fire insurance / yr
- $1,222 – $2,270
Heat risk 9/10 · Severe
- Hot days now (above 111°F)
- 7 days/yr
- Hot days in 30 yrs
- 21 days/yr
Wind risk 8/10 · Major
- Chance of severe wind over 30 yrs
- 99.0%
Air-quality risk 2/10 · Minimal
- Unhealthy air days now
- 1 days/yr
- Unhealthy air days in 30 yrs
- 2 days/yr
Risk factors via First Street. Map © Google.
Why this score? — see what drove the B grade
The composite is a weighted blend of 9 inputs, each scored 0–100. Each bar is that input's sub-score; the figure is the points it added to the 100-point composite (weight × sub-score).
- Cash flow +30.0/30.0
- ARV discount +12.5/15.0
- 1% rule +10.0/10.0
- DSCR +10.0/10.0
- Livability +3.8/5.0
- Rent growth +2.5/5.0
- Condition / age +2.5/5.0
- Schools +1.7/10.0
- Appreciation +0.0/10.0
$79,900
🖨 Deal sheet 📄 Offer letter ✓ Due diligence
Listing remarks MLS
Must-see furnished 2-bedroom, 1.5-bath 16x56 Palm Harbor mobile home in the cozy 55+ Wagon City North community. This well-maintained, recently painted home features a bright front-facing living room and an eat-in kitchen, perfect for comfortable everyday living. Major updates completed within the last three years include the washer, refrigerator, stove/range, dishwasher, water heater, HVAC system, metal roof, and flooring throughout, offering peace of mind and modern convenience. The exterior includes a chain-link fenced backyard with grassy space, a front carport, a large rear-access garage (396 sqft), and a spacious storage room (294 sqft). Situated on a desirable corner lot directly across from the clubhouse, the location adds both convenience and charm. HOA amenities include an outdoor swimming pool, shuffleboard, and more. Located in the heart of Mission near dining, shopping, and entertainment. Schedule your showing today!
Key facts
- Front carport
- Corner lot
- 6,003 sq ft lot
Tags
Neighborhood map
What this means for you Summary
Snapshot
- This is a 2-bed/1.0-bath manufactured listed at $80k.
Deal economics
- At list price, monthly cash flow is $293 ($4k/yr) — positive.
- The deal already cash-flows at list — no discount required.
- Meets the 1% rule at list price ($1k rent vs $80k).
- Recommended offer: $75k (6.0% below list) — sets the bar for market timing.
- Cap rate 11.7% vs local median 3.5% in Mission — top-decile yield for the area; either an underpriced asset or a hidden risk that comps aren't pricing in. Stress-test before assuming the spread holds.
Location & tenants
- Location reads 75/100 on livability (#148 in TX, #4,155 nationally) — a middle-class / working-renter tenant base. Strengths: cost of living A+, housing A+, health & safety A+; Watch: schools C-, amenities F, commute F.
- Mission CISD (urban): math 15% / reading 28% proficiency, ranked #775 of 826 in TX (top 94%) — low school quality limits family demand, transient renter base, plan for 1-2y turnover; 78% free/reduced lunch — lower-income household profile, screen leases tightly.
- Market conditions: 474 active listings in the ZIP; 16 comparable units currently listed for rent nearby; rentals at typical pace (median 23d on market — plan ~3-4 weeks tenant-placement turnaround); 7,378 units permitted in Hidalgo County in 2024 (641 in 5+ unit buildings).
- This rent runs 30% of the median local income ($52k/yr) — at the standard rent-burdened threshold; future hikes will face affordability resistance.
Forward outlook
- Local home prices are declining (-3.0%/yr); year-one equity from $552 of loan paydown is wiped out by about $2k of value loss. Plan a longer hold.
- Hidalgo County population projected at +28% by 2050 — long-run rental-demand tailwind backs the buy-and-hold thesis.
- At projected returns (-3.0% appreciation + 3.0% rent growth), your $22k cash investment doubles in ~8 years — after that, you're playing with house money.
Negotiation context
- It's been on market 79 days — a 6% lower offer ($75k) is reasonable based on typical stale-listing flexibility.
- 3 sale attempts since 2y ago with the ask held roughly flat each time — persistent listings suggest the price (not the market) is what's stuck; bring a comps-based counter.
Risks & watch-outs
- Watch-outs: property tax is 2.9% of price; flood insurance adds $66/mo.
- Climate carrying-cost: major flood risk; severe wind risk, 99% chance of damaging wind over 30y; extreme-heat days projected 7→21/yr by 2055 (HVAC capex compounding) — expect insurance premiums to compound above CPI over the hold.
Questions for the listing agent
- It's been on market 79 days. Have you received any prior offers? Is the seller open to a 6% concession, seller financing, or rate buy-down credit?
- Property tax is high relative to price — has the assessment been appealed recently, and will the sale trigger a re-assessment?
- What's the actual annual flood-insurance premium (NFIP or private), and is the property in a SFHA with mandatory coverage?
- What does the HOA fee cover, when was the last increase, and are there any pending special assessments or reserve-fund shortfalls?
- Why hasn't it sold? Are there any deal-killer items the seller is aware of (foundation, flood, title, zoning, code violations)?
- Is there a deadline driving the sale (1031 exchange, divorce, estate, relocation)? That informs how much negotiation room exists.
- What's the average days-on-market for RENTAL listings here right now (not sales)? A rising rental-DOM trend means longer vacancies and softer asking-rent achievability than the comps imply.
- What's the recent tenant-quality profile in this submarket — average credit score on applications, eviction rate, late-payment / NSF rate, and stable-employment percentage? A property-management company in the area should have these aggregated.
- How much new for-sale + rental construction is in the pipeline within 1–3 miles? Heavy new supply typically softens prices + rents 12–24 months out; constrained supply supports both.
Investment metrics
- 1% rule
- 1.65% ✓
- Cap rate
- 11.69%
- Cash-on-cash
- 19.27%
- DSCR
- 1.86
- GRM
- 5.1
CMA / ARV
- ARV (median comp)
- $89,900
- List price
- $79,900
- Delta
- -11.12%
- Verdict
- UNDERPRICED
- Comps
- 9 within 1.0 mi
Show comp detail 7 sales within ~0.75 mi
| Address | Dist | Beds/Ba | Sqft | Sold | Price | $/sf | Match |
|---|---|---|---|---|---|---|---|
| 210 Hub Dr | 0.13mi | 2/1.0 | 784 (-6%) | 2mo | $65,000 | $83 | 82 |
| 2900 Spur Dr | 0.09mi | 2/1.0 | 784 (-6%) | 13mo | $69,000 | $88 | 76 |
| 107 Axle Dr | 0.11mi | 2/1.5 | 924 (+11%) | 5mo | $75,000 | $81 | 71 |
| 202 Stage Coach Dr | 0.25mi | 2/2.0 | 900 (+8%) | 9mo | $142,500 | $158 | 63 |
| 215 Covered Wagon Dr | 0.35mi | 2/1.5 | 784 (-6%) | 14mo | $77,000 | $98 | 60 |
| 217 Covered Wagon Dr | 0.35mi | 2/2.0 | 924 (+11%) | 4mo | $74,500 | $81 | 57 |
| 2601 Tack Dr | 0.41mi | 2/2.0 | 948 (+14%) | 23mo | $119,000 | $126 | 34 |
Match score weights: distance 35% · size 25% · config 20% · recency 20%. Top-matched comps best support the ARV.
Projected returns pro-forma
-3.0% appreciation · 3.0% rent growth · sell at horizon
- IRR
- 6.7%
- Equity multiple
- 1.26×
- Total profit
- $5,836
- Equity at exit
- $11,913
- IRR
- 16.1%
- Equity multiple
- 2.33×
- Total profit
- $29,655
- Equity at exit
- $6,908
Cash invested: $22,372 (down + closing). Projections, not guarantees.
Landlord ↔ Tenant lean methodology
- Overall (STATE)
- 87 Strongly Landlord-Friendly
- State Texas
- 87 Strongly Landlord-Friendly · R+5
- County
- — inherits STATE
- City
- — inherits STATE
ZIP-level market 78574
- Home prices YoY
- -16.1%
- Active inventory
- 474
- Price-to-rent
- 5.1×
Monthly cashflow live
- Estimated rent
- $1,316 high interval (Pro) →
- Mortgage (P&I)
- −$419
- Tax from tax record
- −$190 /mo · $2,284/yr
- Insurance
- −$33
- Flood insurance flood zone
- −$66 /mo · $798/yr
- HOA
- −$38
- Vacancy / Maint / Mgmt
- −$276
- Net cashflow
- $293
Break-even live
UW: 25.0% down · 7.5% · 30yr · 1.5% tax · 5.0% vac · 8.0% maint · 8.0% mgmt
Financing live
Cash to close
- Down payment
- $19,975
- Closing costs
- $2,397
- Reserves months
- —
- Total cash needed
- —
Loan-product check · same deal, 3 products live
Conventional
25% down · 7.5% · 30yr
- Down + closing
- —
- Monthly P&I
- —
- Monthly cashflow
- —
- DSCR
- —
- Eligible?
- —
Personal DTI + credit; lowest rate.
DSCR
20% down · 8.5% · 30yr
- Down + closing
- —
- Monthly P&I
- —
- Monthly cashflow
- —
- DSCR
- —
- Eligible?
- —
No personal income docs; deal must DSCR.
Hard money
10% down · 12.0% · 12mo
- Down + closing
- —
- Monthly P&I
- —
- Monthly cashflow
- —
- DSCR
- —
- Eligible?
- —
Short-term bridge; refi at stabilization.
Rent comps 16 comps
| Address | Beds | Baths | Sqft | Rent | $/sqft | DOM | Units | Dist |
|---|---|---|---|---|---|---|---|---|
| 707 Palmer Rd Unit 1 Mission, TX | 2.0 | 2.0 | 760 | $1,200 | $1.58 | 14d | 1 | 0.80mi |
| 707 Palmer Rd Unit 2 Mission, TX | 1.0 | 1.0 | 960 | $900 | $0.94 | 14d | 1 | 0.80mi |
| 707 Palmer Rd Unit 3 Mission, TX | 3.0 | 2.0 | 960 | $1,350 | $1.41 | 14d | 1 | 0.80mi |
| 712 Palmer Rd Unit 1 Mission, TX | 2.0 | 2.0 | 960 | $1,100 | $1.15 | 14d | 1 | 0.86mi |
| 2008 N Cummings Ave Mission, TX | 3.0 | 2.0 | 1012 | $1,300 | $1.28 | 43d | 1 | 0.88mi |
| 1811 Perkins Ave Unit 7 Mission, TX | 2.0 | 1.0 | 850 | $750 | $0.88 | 14d | 1 | 1.00mi |
| 1809 Ramirez St Unit 2 Mission, TX | 3.0 | 2.0 | 1033 | $1,300 | $1.26 | 43d | 1 | 1.16mi |
| 1400 N Dunlap Ave Mission, TX | 2.0 | 1.0 | 1068 | $800 | $0.75 | 18d | 1 | 1.32mi |
| 1006 Fairway Dr Mission, TX | 2.0 | 2.0 | 1072 | $1,100 | $1.03 | 43d | 1 | 1.36mi |
| 2903 Estevan St #3 Mission, TX | 3.0 | 2.0 | 1044 | $1,400 | $1.34 | 14d | 1 | 1.43mi |
| 2905 Estevan St #4 Mission, TX | 3.0 | 2.0 | 1044 | $1,300 | $1.25 | 43d | 1 | 1.43mi |
| 2905 Estevan St #3 Mission, TX | 2.0 | 2.0 | 1044 | $1,300 | $1.25 | 23d | 1 | 1.43mi |
| 2903 Estevan St #4 Mission, TX | 3.0 | 2.0 | 1056 | $1,399 | $1.32 | 18d | 1 | 1.43mi |
| 1805 Ramirez St Unit 4 Mission, TX | 3.0 | 2.0 | 1020 | $1,095 | $1.07 | 43d | 1 | 1.47mi |
| 1804 Ramirez St Unit 1 Mission, TX | 3.0 | 2.0 | 1020 | $1,250 | $1.23 | 23d | 1 | 1.49mi |
| 1500 E 24th St Unit B-6 Mission, TX | 2.0 | 2.0 | 1010 | $975 | $0.97 | 43d | 1 | 1.49mi |
HOA detail
- Monthly dues
- $38 · $456/yr
- Likely covers
- waterpool
Listing history 20 events
-
2026-06-18days on market $79,900 Active 79 DOM
-
2026-06-17days on market $79,900 Active 78 DOM
-
2026-06-16days on market $79,900 Active 77 DOM
-
2026-06-15days on market $79,900 Active 76 DOM
-
2026-06-14days on market $79,900 Active 74 DOM
-
2026-06-10days on market $79,900 Active 71 DOM
-
2026-06-09days on market $79,900 Active 70 DOM
-
2026-06-08days on market $79,900 Active 69 DOM
-
2026-06-07days on market $79,900 Active 68 DOM
-
2026-06-03days on market $79,900 Active 64 DOM
-
2026-06-02days on market $79,900 Active 63 DOM
-
2026-06-01days on market $79,900 Active 62 DOM
-
2026-05-31days on market $79,900 Active 61 DOM
-
2026-05-31days on market $79,900 Active 60 DOM
-
2026-03-31$79,900 Active 943-char remark
Show marketing remark (943 chars)
Must-see furnished 2-bedroom, 1.5-bath 16x56 Palm Harbor mobile home in the cozy 55+ Wagon City North community. This well-maintained, recently painted home features a bright front-facing living room and an eat-in kitchen, perfect for comfortable everyday living. Major updates completed within the last three years include the washer, refrigerator, stove/range, dishwasher, water heater, HVAC system, metal roof, and flooring throughout, offering peace of mind and modern convenience. The exterior includes a chain-link fenced backyard with grassy space, a front carport, a large rear-access garage (396 sqft), and a spacious storage room (294 sqft). Situated on a desirable corner lot directly across from the clubhouse, the location adds both convenience and charm. HOA amenities include an outdoor swimming pool, shuffleboard, and more. Located in the heart of Mission near dining, shopping, and entertainment. Schedule your showing today!
-
2025-11-20price $89,900
-
2025-10-01$99,900 Active
-
2025-04-15price $99,900
-
2024-12-09$119,900 Active
-
2021-07-20soldstatus
ⓘ Source: listings_history table (triggers on properties + properties_extension) + one-shot
backfill from property_details.listing_events for pre-trigger history.
Tax reassessment forecast TX · Resets to sale price
- Current annual tax
- $2,284 · $190/mo
- Projected year-2 tax
- $2,284 · $190/mo
- Expected delta
- $0/yr ($0/mo · 0.0%)
ⓘ Screening estimate from a state-policy table — verify with the county assessor before closing.
Climate risk First Street
- Flood 7/10 Severe FEMA zone X · 96% chance over 30 yrs
- Wildfire 1/10 Low
- Heat 9/10 Extreme 7 d/yr ≥111°F today · 21 d/yr by 30 yrs out
- Wind 8/10 Severe 99% chance of damaging wind over 30 yrs
- Air quality 2/10 Low 1 unhealthy d/yr today · 2 by 30 yrs out
Nearby sold comps map
Loading sold comps map…
Walkable amenities ~0.75 mi
Loading nearby amenities…
Taxation est. · year 1
- Rental income
- $15,795
- − Mortgage interest
- −$4,476
- − Property taxes
- −$2,284
- − Insurance
- −$1,197
- − Repairs & maintenance
- −$1,264
- − Management
- −$1,264
- − HOA
- −$456
- − Depreciation
- −$2,324
- Taxable income
- $2,530
- Est. tax owed @ 24.0%
- −$607
- After-tax cash flow
- $2,905/yr
For passive investors: Depreciation is non-cash, so a rental often shows a tax loss while cash-flowing — sheltering income. Rental losses are passive: they offset passive income freely, and up to $25,000/yr can offset ordinary (W-2) income if you actively participate and your MAGI is under $100k (phasing out to $0 by $150k); unused losses carry forward. On sale, claimed depreciation is recaptured at up to 25%, and gains may owe capital-gains tax (a 1031 exchange can defer both). Figures are a year-1 estimate at your 24.0% rate — not tax advice; consult a CPA.
Schools (NCES district)
- District
- Mission CISD
- NCES district ID
- 4831040
- Math proficiency
- 15% ▼ -35.00%
- Reading proficiency
- 28% ▼ -15.00%
- Median HH income
- $32,855
- Composite
- 17.47/100
- National rank
- #9061
- State rank
- #775 of 826 in TX
Livability — Mission
- Score
- 75/100
- State rank
- #148
- US rank
- #4155
Category grades
Schools grade is shown separately in the Schools card above.
Census & demographics
- Census place
- Mission, TX
- County
- Hidalgo County · 623,128 people
- City population
- 78,024
- Metro
- McAllen-Edinburg-Mission, TX
- Population (ZIP)
- 62,456
- Household income
- $52,393
- Rent vs Own
- Severe rent burden
- 803.0
Population outlook (Hidalgo County) Hauer SSP2
- Today (2025)
- 955,232 people
- By 2030
- 1,009,774 · +5.7%
- By 2040
- 1,120,332 · +17.3%
- By 2050
- 1,225,036 · +28.2%
- By 2075
- 1,439,189 · +50.7%
- By 2100
- 1,533,429 · +60.5%
Race, ethnicity, and origin ACS 2023
- Neighborhood character
- Predominantly Hispanic (97%)
- Race & ethnicity
- Hispanic / Latino 97% Two or more races 62% White 2%
- Hispanic origin (detail)
- Mexican 93%
- Foreign-born
- 33% · Canada
- Languages at home
- 12% English-only · Spanish 87%
Political lean MEDSL · Hidalgo
- 2024 margin
- Toss-up / Even · D 48.1% · R 51.0%
- 2008→2024 swing
- -41.6pp toward R · 2008: 38.7pp · 2024: -2.9pp
- All cycles
- 2024: R+2.9 2020: D+17.1 2016: D+40.5 2012: D+41.8 2008: D+38.7
Not yet ingested
- Civics
- —
Market trends
- HPI YoY
- ▼ -44.13%
- Current HPI
- 230.3323
- Rent YoY
- —
- Metro
- McAllen-Edinburg-Mission, TX
- State GDP YoY
- ▲ 3.95%
- F500 in state
- 110
Industry mix (Fortune 500 HQ in TX)
| Industry | F500 HQs | Revenue |
|---|---|---|
| Energy | 16 | $1,198B |
|
||
| Technology | 5 | $198B |
|
||
| Engineering / Construction | 4 | $72B |
|
||
| Energy Services | 3 | $60B |
|
||
| Utilities | 3 | $41B |
|
||
| Healthcare | 2 | $330B |
|
||
Price history
-33.4% since first listed6 events — show timeline
- 2026-03-31 Listed $79,900 MCALLENMLS
- 2025-11-20 Price Changed $89,900 MCALLENMLS
- 2025-10-01 Listed $99,900 MCALLENMLS
- 2025-04-15 Price Changed $99,900 MCALLENMLS
- 2024-12-09 Listed $119,900 MCALLENMLS
- 2021-07-20 Sold (Public Records) — Public Records
Property tax history
+8.0%/yrLatest (2025): $2,284 · +20.0% YoY. Source: county tax records.
Cash-flow waterfall
monthlySold comps — $/sqft
last 12 mo · ≤1 miLoading sold comps…