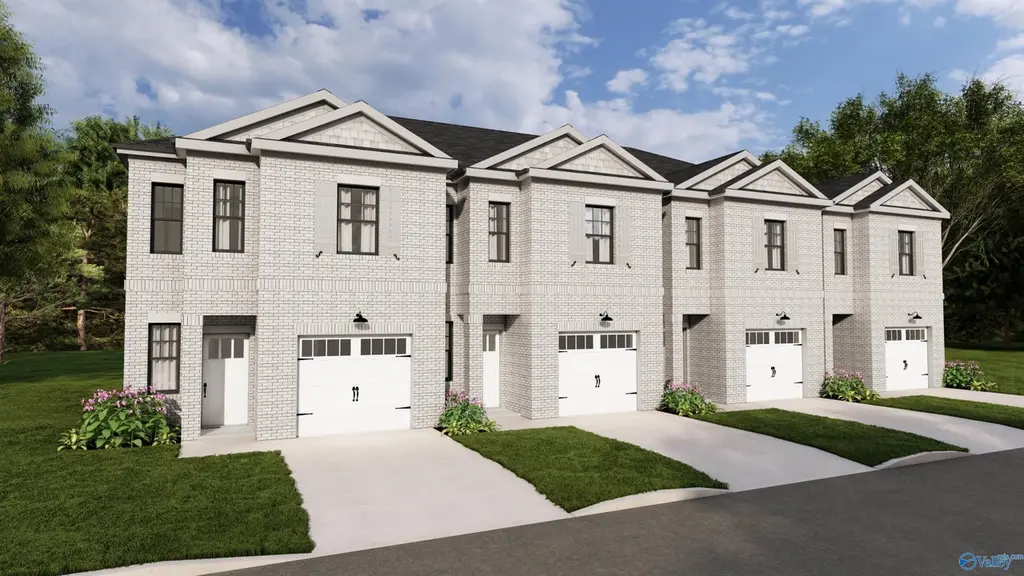
2 Whispering Oaks #25 · Huntsville, AL
Flood risk 1/10 · Minimal
- FEMA flood zone
- X (unshaded)
- Chance of flooding over 30 yrs
- 0.0%
- Est. flood insurance / yr
- $507 – $1,088
Fire risk 3/10 · Minor
- Est. fire insurance / yr
- $916 – $1,700
Heat risk 6/10 · Moderate
- Hot days now (above 105°F)
- 6 days/yr
- Hot days in 30 yrs
- 18 days/yr
Wind risk 4/10 · Minor
- Chance of severe wind over 30 yrs
- 22.0%
Air-quality risk 2/10 · Minimal
- Unhealthy air days now
- 2 days/yr
- Unhealthy air days in 30 yrs
- 2 days/yr
Risk factors via First Street. Map © Google.
Why this score? — see what drove the D grade
The composite is a weighted blend of 9 inputs, each scored 0–100. Each bar is that input's sub-score; the figure is the points it added to the 100-point composite (weight × sub-score).
- ARV discount +15.0/15.0
- Appreciation +8.3/10.0
- Cash flow +6.0/30.0
- Livability +4.1/5.0
- Schools +2.9/10.0
- Condition / age +2.5/5.0
- 1% rule +2.0/10.0
- Rent growth +1.6/5.0
- DSCR +0.4/10.0
$267,900
🖨 Deal sheet (PDF) 📄 Offer letter ✓ Due diligence
Listing remarks MLS
Under Construction-MODEL HOME not for sale -Experience the exquisite lifestyle that awaits in Lake Forest, a beautifully established community that redefines elegant living. Here, you'll find prem amenities that are upgrades in other townhomes, designed to elevate your everyday experience. The kitchen is adorned w/shaker cabinets and a stylish tile backsplash, complemented by beautiful lighting fixtures and undercounter lights. Thoughtful craftsmanship from the crown molding to the luxurious tile shower. Relax by the expansive amenity pool, take a stroll around the community lake, or enjoy a workout in the fitness center. Admire the the swans from the lake gazebo, play a game of tennis whil
Key facts
- Shaker cabinets
- Undercounter lights
- Lighting fixtures
Tags
Neighborhood map
What this means for you Summary
Snapshot
- This is a 3-bed/2.5-bath townhouse listed at $268k.
Deal economics
- At list price, monthly cash flow is $-511 ($-6k/yr) — negative.
- To cash-flow at today's rent, offer at most $194k (27.6% below list).
- To meet the 1% rule (rent ≥ 1% of price), the offer needs to be $189k (29.6% below list).
- Recommended offer: $189k (29.6% below list) — sets the bar for 1% rule.
Location & tenants
- Location reads 82/100 on livability (#3 in AL, #1,082 nationally) — a professional / high-income tenant draw. Strengths: commute A+, cost of living A+, housing A+; Watch: crime F.
- Huntsville City (urban): math 21% / reading 46% proficiency, ranked #48 of 129 in AL (top 37%) — families likely to look elsewhere, expect single-tenant / working-renter base with shorter leases.
- Zoned schools: Williams Elementary School (math 17% / reading 47%, grade F, #331 of 627 statewide, top 57%, 521 students, 45% FRL); Williams Middle School (math 16% / reading 50%, grade F, #101 of 257 statewide, top 40%, 548 students, 58% FRL); Columbia High School (math 12% / reading 17%, grade F, #220 of 305 statewide, top 77%, 954 students, 50% FRL) — zoned schools at 51% FRL track the district average.
- Market conditions: Rents falling (-3.6%/yr); 110 active listings in the ZIP; 23 comparable units currently listed for rent nearby; rentals at typical pace (median 25d on market — plan ~3-4 weeks tenant-placement turnaround); 48% of comp listings sitting > 30 days — soft ceiling on asking rent; solid renter incomes; 4,709 units permitted in Madison County in 2024 (1,186 in 5+ unit buildings).
Forward outlook
- In year one you build about $20k of equity ($2k loan paydown + $18k appreciation (6.7% local appreciation)).
- Madison County population projected at +18% by 2050 — long-run rental-demand tailwind backs the buy-and-hold thesis.
- By year 2, paydown + projected appreciation supports a ~$32k cash-out refi (75% LTV) — recoverable capital for the next deal without selling this one.
Negotiation context
- It's been on market 109 days — a 9% lower offer ($244k) is reasonable based on typical stale-listing flexibility.
Risks & watch-outs
- Climate carrying-cost: extreme-heat days projected 6→18/yr by 2055 (HVAC capex compounding) — expect insurance premiums to compound above CPI over the hold.
Questions for the listing agent
- What do current leases actually rent for vs. the listed asking? Can we see a recent rent roll and the last 12 months of T-12 income?
- It's been on market 109 days. Have you received any prior offers? Is the seller open to a 30% concession, seller financing, or rate buy-down credit?
- What does the HOA fee cover, when was the last increase, and are there any pending special assessments or reserve-fund shortfalls?
- Why hasn't it sold? Are there any deal-killer items the seller is aware of (foundation, flood, title, zoning, code violations)?
- Is there a deadline driving the sale (1031 exchange, divorce, estate, relocation)? That informs how much negotiation room exists.
- Crime grade is F in this area — have there been break-ins, vandalism, or insurance claims at this property in the last 3 years? What carrier currently insures it and at what premium?
- The area grade is low — what's the realistic commute time and amenity access for the typical tenant pool here? Any planned neighborhood developments (good or bad) we should know about?
- What's the average days-on-market for RENTAL listings here right now (not sales)? A rising rental-DOM trend means longer vacancies and softer asking-rent achievability than the comps imply.
- What's the recent tenant-quality profile in this submarket — average credit score on applications, eviction rate, late-payment / NSF rate, and stable-employment percentage? A property-management company in the area should have these aggregated.
- How much new for-sale + rental construction is in the pipeline within 1–3 miles? Heavy new supply typically softens prices + rents 12–24 months out; constrained supply supports both.
Investment metrics
- 1% rule
- 0.70% ✗
- Cap rate
- 4.00%
- Cash-on-cash
- -8.18%
- DSCR
- 0.64
- GRM
- 11.8
CMA / ARV
- ARV (median comp)
- $374,047
- List price
- $267,900
- Delta
- -28.38%
- Verdict
- UNDERPRICED
- Comps
- 20 within 1.0 mi
Show comp detail 12 sales within ~0.75 mi
| Address | Dist | Beds/Ba | Sqft | Sold | Price | $/sf | Match |
|---|---|---|---|---|---|---|---|
| 67 Atherton Cir | 0.09mi | 3/2.0 | 1,705 (+5%) | 14mo | $299,000 | $175 | 74 |
| 411 Ripple Lake Dr SW | 0.47mi | 3/2.0 | 1,850 (+14%) | 2mo | $340,000 | $184 | 52 |
| 457 Legend Oak Way SW | 0.56mi | 3/2.0 | 1,837 (+13%) | 2mo | $333,000 | $181 | 49 |
| 402 Tillane Park Cir SW | 0.48mi | 3/2.0 | 1,850 (+14%) | 7mo | $345,000 | $186 | 47 |
| 8617 Quinn Dr SW | 0.49mi | 3/2.0 | 1,856 (+14%) | 7mo | $340,000 | $183 | 46 |
| 410 Tillane Park Cir | 0.50mi | 3/2.0 | 1,837 (+13%) | 9mo | $315,000 | $171 | 46 |
| 418 Ripple Lake Dr SW | 0.52mi | 3/2.0 | 1,837 (+13%) | 8mo | $340,000 | $185 | 46 |
| 8609 Quinn Dr SW | 0.49mi | 3/2.0 | 1,839 (+13%) | 12mo | $338,500 | $184 | 44 |
| 441 Legend Oak Way SW | 0.50mi | 3/2.0 | 1,828 (+12%) | 17mo | $335,000 | $183 | 40 |
| 416 Raleigh Elm Dr | 0.53mi | 3/2.0 | 1,839 (+13%) | 14mo | $325,000 | $177 | 40 |
| 433 Ripple Lake Dr SW | 0.55mi | 3/2.0 | 1,860 (+14%) | 11mo | $340,000 | $183 | 40 |
| 470 SW Raleigh Elm Dr | 0.68mi | 3/2.0 | 1,854 (+14%) | 9mo | $330,000 | $178 | 36 |
Match score weights: distance 35% · size 25% · config 20% · recency 20%. Top-matched comps best support the ARV.
Projected returns pro-forma
6.69% appreciation · 0.0% rent growth · sell at horizon
- IRR
- 9.6%
- Equity multiple
- 1.67×
- Total profit
- $50,394
- Equity at exit
- $180,146
- IRR
- 10.1%
- Equity multiple
- 3.15×
- Total profit
- $161,617
- Equity at exit
- $337,325
Cash invested: $75,012 (down + closing). Projections, not guarantees.
Landlord ↔ Tenant lean methodology
- Overall (STATE)
- 90 Strongly Landlord-Friendly
- State Alabama
- 90 Strongly Landlord-Friendly · R+15
- County
- — inherits STATE
- City
- — inherits STATE
ZIP-level market 35824
- Home prices YoY
- 2.5%
- Rents YoY
- -3.6%
- Active inventory
- 110
- Price-to-rent
- 11.8×
Monthly cashflow live
- Estimated rent
- $1,886 high interval (Pro) →
- Mortgage (P&I)
- −$1,405
- Tax est. 1.5%
- −$335 /mo · $4,018/yr
- Insurance
- −$112
- HOA
- −$150
- Vacancy / Maint / Mgmt
- −$396
- Net cashflow
- $-511
Break-even live
Sensitivity live
| Price | -10% $-326 | -5% $-419 | +0% $-511 | +5% $-604 | +10% $-697 |
|---|---|---|---|---|---|
| Rent | -10% $-660 | -5% $-586 | +0% $-511 | +5% $-437 | +10% $-363 |
| Rate | -1.0pp $-377 | -0.5pp $-443 | base $-511 | +0.5pp $-581 | +1.0pp $-652 |
UW: 25.0% down · 7.5% · 30yr · 1.5% tax · 5.0% vac · 8.0% maint · 8.0% mgmt
Financing live
Cash to close
- Down payment
- $66,975
- Closing costs
- $8,037
- Reserves months
- —
- Total cash needed
- —
Loan-product check · same deal, 3 products live
Conventional
25% down · 7.5% · 30yr
- Down + closing
- —
- Monthly P&I
- —
- Monthly cashflow
- —
- DSCR
- —
- Eligible?
- —
Personal DTI + credit; lowest rate.
DSCR
20% down · 8.5% · 30yr
- Down + closing
- —
- Monthly P&I
- —
- Monthly cashflow
- —
- DSCR
- —
- Eligible?
- —
No personal income docs; deal must DSCR.
Hard money
10% down · 12.0% · 12mo
- Down + closing
- —
- Monthly P&I
- —
- Monthly cashflow
- —
- DSCR
- —
- Eligible?
- —
Short-term bridge; refi at stabilization.
Rent comps 23 comps
| Address | Beds | Baths | Sqft | Rent | $/sqft | DOM | Units | Dist |
|---|---|---|---|---|---|---|---|---|
| 5 Atherton Cir SW Huntsville, AL | 3.0 | 2.5 | 1908 | $2,500 | $1.31 | 25d | 1 | 0.07mi |
| 27 Atherton Cir SW Unit N Huntsville, AL | 3.0 | 2.0 | 1780 | $1,900 | $1.07 | 25d | 1 | 0.08mi |
| 44 Atherton Cir SW Huntsville, AL | 3.0 | 2.0 | 1742 | $2,000 | $1.15 | 45d | 1 | 0.13mi |
| 285 Shadow Ct SW Huntsville, AL | 3.0 | 2.0 | 1480 | $1,650 | $1.11 | 45d | 1 | 0.14mi |
| 242 Shadow Ct SW Huntsville, AL | 4.0 | 2.5 | 2227 | $1,750 | $0.79 | 45d | 1 | 0.28mi |
| 241 Shadow Ct SW Huntsville, AL | 3.0 | 2.5 | 1650 | $1,700 | $1.03 | 45d | 1 | 0.32mi |
| 240 Martin Rd SW Huntsville, AL | 1.0–3.0 | 1.0–2.0 | 946 | $1,650 | $1.74 | 25d | 1 | 0.33mi |
| 226 Shadow Ct SW Huntsville, AL | 4.0 | 2.0 | 1820 | $1,750 | $0.96 | 15d | 1 | 0.36mi |
| 404 Tillane Park Cir SW Huntsville, AL | 3.0 | 2.0 | 1850 | $2,050 | $1.11 | 45d | 1 | 0.52mi |
| 439 Ripple Lake Dr SW Huntsville, AL | 3.0 | 2.0 | 1837 | $2,150 | $1.17 | 45d | 1 | 0.60mi |
| 441 Ripple Lake Dr SW Huntsville, AL | 3.0 | 2.0 | 1850 | $2,150 | $1.16 | 25d | 1 | 0.61mi |
| 109 Brushcreek Dr SW Huntsville, AL | 3.0 | 2.0 | 1378 | $1,595 | $1.16 | 25d | 1 | 0.64mi |
| 475 E Mossyleaf Dr SW Huntsville, AL | 3.0 | 2.0 | 1950 | $2,050 | $1.05 | 45d | 1 | 0.74mi |
| 483 E Mossyleaf Dr SW Huntsville, AL | 3.0 | 2.0 | 1826 | $2,000 | $1.10 | 25d | 1 | 0.77mi |
| 556 Martin Rd SW Huntsville, AL | 1.0–3.0 | 1.0–2.0 | 1079 | $1,834 | $1.70 | 15d | 111 | 0.79mi |
| 102 Sandpiper Ct SW Huntsville, AL | 4.0 | 2.0 | 1897 | $1,750 | $0.92 | 45d | 1 | 0.86mi |
| 1 Nestledown Dr SW Huntsville, AL | 2.0–3.0 | 2.0–3.0 | 1231 | $2,399 | $1.95 | 15d | 1 | 0.89mi |
| 525 W Mossyleaf Dr SW Huntsville, AL | 3.0 | 2.0 | 1672 | $1,700 | $1.02 | 25d | 1 | 0.93mi |
| 103 Kestrel Ct SW Huntsville, AL | 3.0 | 2.5 | 1972 | $1,950 | $0.99 | 46d | 1 | 0.96mi |
| 702 Sluice Dr SW Huntsville, AL | 3.0 | 2.0 | 1850 | $1,850 | $1.00 | 45d | 1 | 1.02mi |
| 32 Ashbury Woods Dr Huntsville, AL | 1.0–3.0 | 1.0–2.0 | 1146 | $1,409 | $1.23 | 15d | 17 | 1.11mi |
| 119 Windsor Hill Rd SW Unit 119 Huntsville, AL | 3.0 | 2.5 | 1768 | $1,800 | $1.02 | 25d | 1 | 1.37mi |
| 103 Rainwood Dr SW Huntsville, AL | 4.0 | 2.5 | 2155 | $2,400 | $1.11 | 45d | 1 | 1.43mi |
HOA detail
- Monthly dues
- $150 · $1,800/yr
- Likely covers
- poolgym
Listing history 16 events
-
2026-06-22days on market $267,900 Active 109 DOM
-
2026-06-18days on market $267,900 Active 106 DOM
-
2026-06-17days on market $267,900 Active 105 DOM
-
2026-06-16days on market $267,900 Active 104 DOM
-
2026-06-15days on market $267,900 Active 103 DOM
-
2026-06-14days on market $267,900 Active 101 DOM
-
2026-06-10days on market $267,900 Active 98 DOM
-
2026-06-09days on market $267,900 Active 97 DOM
-
2026-06-08days on market $267,900 Active 96 DOM
-
2026-06-07days on market $267,900 Active 95 DOM
-
2026-06-03days on market $267,900 Active 91 DOM
-
2026-06-02days on market $267,900 Active 90 DOM
-
2026-06-01days on market $267,900 Active 89 DOM
-
2026-05-31days on market $267,900 Active 88 DOM
-
2026-05-30days on market $267,900 Active 87 DOM
-
2026-03-04$267,900 Active 700-char remark
Show marketing remark (700 chars)
Under Construction-MODEL HOME not for sale -Experience the exquisite lifestyle that awaits in Lake Forest, a beautifully established community that redefines elegant living. Here, you'll find prem amenities that are upgrades in other townhomes, designed to elevate your everyday experience. The kitchen is adorned w/shaker cabinets and a stylish tile backsplash, complemented by beautiful lighting fixtures and undercounter lights. Thoughtful craftsmanship from the crown molding to the luxurious tile shower. Relax by the expansive amenity pool, take a stroll around the community lake, or enjoy a workout in the fitness center. Admire the the swans from the lake gazebo, play a game of tennis whil
ⓘ Source: listings_history table (triggers on properties + properties_extension) + one-shot
backfill from property_details.listing_events for pre-trigger history.
Climate risk First Street
- Flood 1/10 Low FEMA zone X (unshaded) · 0% chance over 30 yrs
- Wildfire 3/10 Moderate
- Heat 6/10 Major 6 d/yr ≥105°F today · 18 d/yr by 30 yrs out
- Wind 4/10 Moderate 22% chance of damaging wind over 30 yrs
- Air quality 2/10 Low 2 unhealthy d/yr today · 2 by 30 yrs out
Nearby sold comps map
Loading sold comps map…
Walkable amenities ~0.75 mi
Loading nearby amenities…
Taxation est. · year 1
- Rental income
- $22,631
- − Mortgage interest
- −$15,007
- − Property taxes
- −$4,018
- − Insurance
- −$1,340
- − Repairs & maintenance
- −$1,811
- − Management
- −$1,811
- − HOA
- −$1,800
- − Depreciation
- −$7,793
- Taxable loss
- −$10,948
- Est. tax savings @ 24.0%
- +$2,627
- After-tax cash flow
- $-3,511/yr
For passive investors: Depreciation is non-cash, so a rental often shows a tax loss while cash-flowing — sheltering income. Rental losses are passive: they offset passive income freely, and up to $25,000/yr can offset ordinary (W-2) income if you actively participate and your MAGI is under $100k (phasing out to $0 by $150k); unused losses carry forward. On sale, claimed depreciation is recaptured at up to 25%, and gains may owe capital-gains tax (a 1031 exchange can defer both). Figures are a year-1 estimate at your 24.0% rate — not tax advice; consult a CPA.
Schools (NCES district)
- District
- Huntsville City
- NCES district ID
- 0101800
- Math proficiency
- 21% ▼ -23.00%
- Reading proficiency
- 46% ▬ 0.00%
- Median HH income
- $48,264
- Composite
- 28.84/100
- National rank
- #6647
- State rank
- #48 of 129 in AL
Livability — Huntsville
- Score
- 82/100
- State rank
- #3
- US rank
- #1082
Category grades
Schools grade is shown separately in the Schools card above.
Census & demographics
- Census place
- Huntsville, AL
- County
- Madison County · 380,832 people
- City population
- 220,435
- Metro
- Huntsville, AL
- Population (ZIP)
- 9,645
- Household income
- $103,619
- Rent vs Own
- Severe rent burden
- 451.0
Population outlook (Madison County) Hauer SSP2
- Today (2025)
- 392,086 people
- By 2030
- 409,788 · +4.5%
- By 2040
- 440,557 · +12.4%
- By 2050
- 460,990 · +17.6%
- By 2075
- 502,872 · +28.3%
- By 2100
- 513,623 · +31.0%
Race, ethnicity, and origin ACS 2023
- Neighborhood character
- Diverse neighborhood (Simpson 0.60)
- Race & ethnicity
- White 57% Black 27% Two or more races 8% Hispanic / Latino 7% Asian 4% Native American 1%
- Hispanic origin (detail)
- Mexican 2%
- Common ancestry
- Slovak 7% Lithuanian 3% Italian 2%
- Foreign-born
- 10% · Canada, China, Jamaica
- Languages at home
- 93% English-only · Spanish 3% Chinese 2% German/W. Germanic 1%
Political lean MEDSL · Madison
- 2024 margin
- Lean R (+9.0) · D 44.7% · R 53.7% · Other 1.6%
- 2008→2024 swing
- +6.0pp toward D · 2008: -14.9pp · 2024: -9.0pp
- All cycles
- 2024: R+9.0 2020: R+8.0 2016: R+16.8 2012: R+18.7 2008: R+14.9
Not yet ingested
- Civics
- —
Market trends
- HPI YoY
- ▲ 6.69%
- Current HPI
- 269.5596
- Rent YoY
- ▼ -3.65%
- Metro
- Huntsville, AL
- State GDP YoY
- ▲ 2.94%
- F500 in state
- 4
Industry mix (Fortune 500 HQ in AL)
| Industry | F500 HQs | Revenue |
|---|---|---|
| Financial Services | 1 | $8B |
|
||
| Healthcare | 1 | $5B |
|
||
Price history
1 event — show timeline
- 2026-03-04 Listed $267,900 VMLS
Cash-flow waterfall
monthlySold comps — $/sqft
last 12 mo · ≤1 miLoading sold comps…