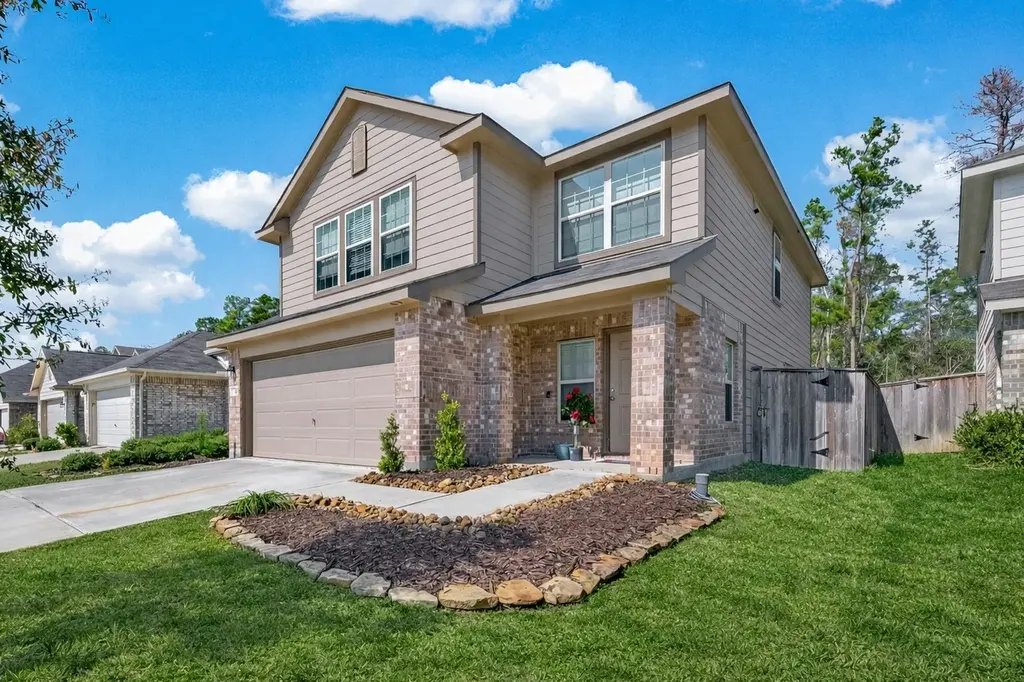
1308 Winding Willow Dr · Pinehurst, TX
Flood risk 1/10 · Minimal
- FEMA flood zone
- X (unshaded)
- Chance of flooding over 30 yrs
- 0.0%
- Est. flood insurance / yr
- $507 – $1,088
Fire risk 4/10 · Minor
- Est. fire insurance / yr
- $1,222 – $2,270
Heat risk 8/10 · Major
- Hot days now (above 111°F)
- 7 days/yr
- Hot days in 30 yrs
- 23 days/yr
Wind risk 8/10 · Major
- Chance of severe wind over 30 yrs
- 99.0%
Air-quality risk 2/10 · Minimal
- Unhealthy air days now
- 2 days/yr
- Unhealthy air days in 30 yrs
- 2 days/yr
Risk factors via First Street. Map © Google.
Why this score? — see what drove the D grade
The composite is a weighted blend of 9 inputs, each scored 0–100. Each bar is that input's sub-score; the figure is the points it added to the 100-point composite (weight × sub-score).
- ARV discount +15.0/15.0
- Cash flow +6.9/30.0
- Schools +5.8/10.0
- 1% rule +4.0/10.0
- Condition / age +4.0/5.0
- Livability +2.8/5.0
- Rent growth +2.5/5.0
- DSCR +1.1/10.0
- Appreciation +0.0/10.0
$269,900
🖨 Deal sheet (PDF) 📄 Offer letter ✓ Due diligence
Listing remarks MLS
Nestled in a charming neighborhood, this lovely home features 4 bedrooms, 2.5 bathrooms, open floor plan with a spacious kitchen, and a cozy living room. The backyard is perfect for entertaining with a covered patio addition. Garage is equipped with a mini split A/C. Conveniently located near schools, parks, and shopping; this property is ideal for families looking for a peaceful retreat. Enjoy the tranquility of this inviting home in a desirable area.
Key facts
- Near schools
- Open floor plan
- Cozy living room
Tags
Neighborhood map
What this means for you Summary
Snapshot
- This is a 4-bed/2.5-bath single-family listed at $270k. Condition is rated good.
Deal economics
- At list price, monthly cash flow is $-408 ($-5k/yr) — negative.
- To cash-flow at today's rent, offer at most $198k (26.7% below list).
- To meet the 1% rule (rent ≥ 1% of price), the offer needs to be $244k (9.6% below list).
- Recommended offer: $198k (26.7% below list) — sets the bar for cash-flow.
- Cap rate 4.5% vs local median 2.0% in Pinehurst — top-decile yield for the area; either an underpriced asset or a hidden risk that comps aren't pricing in. Stress-test before assuming the spread holds.
Location & tenants
- Location reads 55/100 on livability (#1,350 in TX) — a working-class tenant base; expect higher turnover. Strengths: cost of living A+, housing B+; Watch: employment C-, crime D-, amenities F.
- Tomball ISD (suburban): math 66% / reading 63% proficiency, ranked #25 of 826 in TX (top 3%) — acceptable for families but not a draw, mixed tenant base, ~2y average lease.
- Zoned schools: Decker Prairie El (math 29% / reading 34%, grade F, #2,396 of 4,322 statewide, top 56%, 755 students, 40% FRL); Tomball Int (math 55% / reading 45%, grade C, #347 of 1,662 statewide, top 21%, 988 students, 46% FRL); Tomball H S (math 74% / reading 69%, grade B+, #111 of 1,632 statewide, top 7%, 2,801 students, 34% FRL).
- Zoned-school proficiency averages 51% at this address vs 64% district-wide (-14 pts) — the specific schools serving this property underperform the Tomball ISD average; the district grade overstates school quality for this exact location.
- Market conditions: 172 active listings in the ZIP; 13,259 units permitted in Montgomery County in 2024 (1,402 in 5+ unit buildings).
Forward outlook
- Local home prices are declining (-3.0%/yr); year-one equity from $2k of loan paydown is wiped out by about $8k of value loss. Plan a longer hold.
- Montgomery County population projected at +65% by 2050 — long-run rental-demand tailwind backs the buy-and-hold thesis.
Negotiation context
- It's been on market 69 days — a 6% lower offer ($254k) is reasonable based on typical stale-listing flexibility.
- 4 sale attempts since 6y ago with the ask held roughly flat each time — persistent listings suggest the price (not the market) is what's stuck; bring a comps-based counter.
Risks & watch-outs
- Watch-outs: property tax is 3.3% of price.
- Climate carrying-cost: severe wind risk, 99% chance of damaging wind over 30y; extreme-heat days projected 7→23/yr by 2055 (HVAC capex compounding) — expect insurance premiums to compound above CPI over the hold.
Questions for the listing agent
- What do current leases actually rent for vs. the listed asking? Can we see a recent rent roll and the last 12 months of T-12 income?
- It's been on market 69 days. Have you received any prior offers? Is the seller open to a 27% concession, seller financing, or rate buy-down credit?
- Property tax is high relative to price — has the assessment been appealed recently, and will the sale trigger a re-assessment?
- What does the HOA fee cover, when was the last increase, and are there any pending special assessments or reserve-fund shortfalls?
- Why hasn't it sold? Are there any deal-killer items the seller is aware of (foundation, flood, title, zoning, code violations)?
- Is there a deadline driving the sale (1031 exchange, divorce, estate, relocation)? That informs how much negotiation room exists.
- Schools are F-rated, which usually means shorter tenancies and higher turnover. Who's the typical renter profile here, and what's been the actual vacancy rate?
- Crime grade is D in this area — have there been break-ins, vandalism, or insurance claims at this property in the last 3 years? What carrier currently insures it and at what premium?
- The area grade is low — what's the realistic commute time and amenity access for the typical tenant pool here? Any planned neighborhood developments (good or bad) we should know about?
- What's the average days-on-market for RENTAL listings here right now (not sales)? A rising rental-DOM trend means longer vacancies and softer asking-rent achievability than the comps imply.
- What's the recent tenant-quality profile in this submarket — average credit score on applications, eviction rate, late-payment / NSF rate, and stable-employment percentage? A property-management company in the area should have these aggregated.
- How much new for-sale + rental construction is in the pipeline within 1–3 miles? Heavy new supply typically softens prices + rents 12–24 months out; constrained supply supports both.
Investment metrics
- 1% rule
- 0.90% ✗
- Cap rate
- 4.48%
- Cash-on-cash
- -6.49%
- DSCR
- 0.71
- GRM
- 9.2
CMA / ARV
- ARV (median comp)
- $401,181
- List price
- $269,900
- Delta
- -32.72%
- Verdict
- UNDERPRICED
- Comps
- 20 within 1.0 mi
Show comp detail 12 sales within ~0.75 mi
| Address | Dist | Beds/Ba | Sqft | Sold | Price | $/sf | Match |
|---|---|---|---|---|---|---|---|
| 303 W Rollingwood St | 0.75mi | 4/2.0 | 2,286 (+0%) | 4mo | $585,000 | $256 | 60 |
| 13200 N Decker Dr | 0.23mi | 3/2.0 (-1) | 1,969 (-14%) | 2mo | $409,900 | $208 | 58 |
| 506 Blossom Cove Ct | 0.55mi | 3/2.5 (-1) | 2,419 (+6%) | 3mo | $449,900 | $186 | 57 |
| 12506 Patridge Cir | 0.58mi | 3/2.5 (-1) | 2,060 (-10%) | 0mo | $405,000 | $197 | 52 |
| 1019 Ginger Glade Ln | 0.72mi | 4/3.0 | 2,504 (+10%) | 2mo | $439,900 | $176 | 47 |
| 1063 Ginger Glade Ln | 0.65mi | 4/2.0 | 2,378 (+4%) | 20mo | $469,000 | $197 | 44 |
| 514 Pearl View Ln | 0.72mi | 4/3.0 | 2,504 (+10%) | 5mo | $437,900 | $175 | 44 |
| 553 Rolling Brook Ln | 0.60mi | 4/3.0 | 2,499 (+10%) | 14mo | $457,000 | $183 | 42 |
| 818 Evergreen Meadows Ln | 0.58mi | 3/2.5 (-1) | 2,498 (+10%) | 14mo | $464,990 | $186 | 40 |
| 510 Blossom Cove Ct | 0.54mi | 3/2.0 (-1) | 2,561 (+12%) | 11mo | $479,900 | $187 | 38 |
| 818 Coe Rd | 0.72mi | 3/2.0 (-1) | 2,060 (-10%) | 16mo | $306,000 | $149 | 30 |
| 12314 Patridge Cir | 0.71mi | 3/2.0 (-1) | 2,481 (+9%) | 19mo | $250,000 | $101 | 29 |
Match score weights: distance 35% · size 25% · config 20% · recency 20%. Top-matched comps best support the ARV.
Projected returns pro-forma
-3.0% appreciation · 3.0% rent growth · sell at horizon
- IRR
- -27.3%
- Equity multiple
- 0.08×
- Total profit
- $-69,423
- Equity at exit
- $40,243
- IRR
- -24.8%
- Equity multiple
- -0.23×
- Total profit
- $-92,626
- Equity at exit
- $23,336
Cash invested: $75,572 (down + closing). Projections, not guarantees.
Landlord ↔ Tenant lean methodology
- Overall (STATE)
- 87 Strongly Landlord-Friendly
- State Texas
- 87 Strongly Landlord-Friendly · R+5
- County
- — inherits STATE
- City
- — inherits STATE
ZIP-level market 77362
- Home prices YoY
- -29.1%
- Active inventory
- 172
- Price-to-rent
- 9.2×
Monthly cashflow live
- Estimated rent
- $2,439 medium interval (Pro) →
- Mortgage (P&I)
- −$1,415
- Tax from tax record
- −$744 /mo · $8,934/yr
- Insurance
- −$112
- HOA
- −$63
- Vacancy / Maint / Mgmt
- −$512
- Net cashflow
- $-408
Break-even live
Sensitivity live
| Price | -10% $-256 | -5% $-332 | +0% $-408 | +5% $-485 | +10% $-561 |
|---|---|---|---|---|---|
| Rent | -10% $-601 | -5% $-505 | +0% $-408 | +5% $-312 | +10% $-216 |
| Rate | -1.0pp $-273 | -0.5pp $-340 | base $-408 | +0.5pp $-478 | +1.0pp $-550 |
UW: 25.0% down · 7.5% · 30yr · 1.5% tax · 5.0% vac · 8.0% maint · 8.0% mgmt
Financing live
Cash to close
- Down payment
- $67,475
- Closing costs
- $8,097
- Reserves months
- —
- Total cash needed
- —
Loan-product check · same deal, 3 products live
Conventional
25% down · 7.5% · 30yr
- Down + closing
- —
- Monthly P&I
- —
- Monthly cashflow
- —
- DSCR
- —
- Eligible?
- —
Personal DTI + credit; lowest rate.
DSCR
20% down · 8.5% · 30yr
- Down + closing
- —
- Monthly P&I
- —
- Monthly cashflow
- —
- DSCR
- —
- Eligible?
- —
No personal income docs; deal must DSCR.
Hard money
10% down · 12.0% · 12mo
- Down + closing
- —
- Monthly P&I
- —
- Monthly cashflow
- —
- DSCR
- —
- Eligible?
- —
Short-term bridge; refi at stabilization.
HOA detail
- Monthly dues
- $63 · $756/yr
Listing history 29 events
-
2026-06-21days on market $269,900 Active 69 DOM
-
2026-06-18days on market $269,900 Active 66 DOM
-
2026-06-17days on market $269,900 Active 65 DOM
-
2026-06-16days on market $269,900 Active 64 DOM
-
2026-06-15days on market $269,900 Active 63 DOM
-
2026-06-13days on market $269,900 Active 61 DOM
-
2026-06-13days on market $269,900 Active 60 DOM
-
2026-06-09days on market $269,900 Active 57 DOM
-
2026-06-08days on market $269,900 Active 56 DOM
-
2026-06-07days on market $269,900 Active 55 DOM
-
2026-06-04days on market $269,900 Active 52 DOM
-
2026-06-03days on market $269,900 Active 51 DOM
-
2026-06-02days on market $269,900 Active 50 DOM
-
2026-06-01days on market $269,900 Active 49 DOM
-
2026-05-31days on market $269,900 Active 48 DOM
-
2026-04-13$269,900 Active 456-char remark
Show marketing remark (456 chars)
Nestled in a charming neighborhood, this lovely home features 4 bedrooms, 2.5 bathrooms, open floor plan with a spacious kitchen, and a cozy living room. The backyard is perfect for entertaining with a covered patio addition. Garage is equipped with a mini split A/C. Conveniently located near schools, parks, and shopping; this property is ideal for families looking for a peaceful retreat. Enjoy the tranquility of this inviting home in a desirable area.
-
2026-04-13historical
Show marketing remark (456 chars)
Nestled in a charming neighborhood, this lovely home features 4 bedrooms, 2.5 bathrooms, open floor plan with a spacious kitchen, and a cozy living room. The backyard is perfect for entertaining with a covered patio addition. Garage is equipped with a mini split A/C. Conveniently located near schools, parks, and shopping; this property is ideal for families looking for a peaceful retreat. Enjoy the tranquility of this inviting home in a desirable area.
-
2026-04-09price $269,900
-
2026-02-22price $289,000
-
2026-02-15$299,000 Active
-
2021-11-22soldstatus
-
2021-11-19soldstatus Sold
-
2021-11-10status Pending
-
2021-10-27status Option Pending
-
2021-10-21$260,300 Active
-
2021-08-13soldstatus
-
2020-12-22soldstatus Sold
-
2020-06-11$199,990
-
2020-06-11historical
ⓘ Source: listings_history table (triggers on properties + properties_extension) + one-shot
backfill from property_details.listing_events for pre-trigger history.
Tax reassessment forecast TX · Resets to sale price
- Current annual tax
- $8,934 · $744/mo
- Projected year-2 tax
- $8,934 · $744/mo
- Expected delta
- $0/yr ($0/mo · 0.0%)
ⓘ Screening estimate from a state-policy table — verify with the county assessor before closing.
Climate risk First Street
- Flood 1/10 Low FEMA zone X (unshaded) · 0% chance over 30 yrs
- Wildfire 4/10 Moderate
- Heat 8/10 Severe 7 d/yr ≥111°F today · 23 d/yr by 30 yrs out
- Wind 8/10 Severe 99% chance of damaging wind over 30 yrs
- Air quality 2/10 Low 2 unhealthy d/yr today · 2 by 30 yrs out
Nearby sold comps map
Loading sold comps map…
Walkable amenities ~0.75 mi
Loading nearby amenities…
Taxation est. · year 1
- Rental income
- $29,269
- − Mortgage interest
- −$15,119
- − Property taxes
- −$8,934
- − Insurance
- −$1,350
- − Repairs & maintenance
- −$2,342
- − Management
- −$2,342
- − HOA
- −$756
- − Depreciation
- −$7,852
- Taxable loss
- −$9,423
- Est. tax savings @ 24.0%
- +$2,262
- After-tax cash flow
- $-2,640/yr
For passive investors: Depreciation is non-cash, so a rental often shows a tax loss while cash-flowing — sheltering income. Rental losses are passive: they offset passive income freely, and up to $25,000/yr can offset ordinary (W-2) income if you actively participate and your MAGI is under $100k (phasing out to $0 by $150k); unused losses carry forward. On sale, claimed depreciation is recaptured at up to 25%, and gains may owe capital-gains tax (a 1031 exchange can defer both). Figures are a year-1 estimate at your 24.0% rate — not tax advice; consult a CPA.
Condition & rehab AI · 13 photos
This home is in good condition with modern updates and a well-maintained exterior. It is ready for immediate occupancy and can be further enhanced with a fresh coat of paint and some landscaping.
Value-add opportunities
- Resale painting — Fresh paint can make a home look more inviting and modern.
- Both landscaping — A well-maintained yard can increase curb appeal and property value.
- Rental ceiling fans — Ceiling fans can improve air circulation and make the home more comfortable for tenants during warmer months.
Renovation cost estimate screening
Value-add ROI direction
- Resale painting — Fresh paint can make a home look more inviting and modern. ↑
- Both landscaping — A well-maintained yard can increase curb appeal and property value. ↑
- Rental ceiling fans — Ceiling fans can improve air circulation and make the home more comfortable for tenants during warmer months. ↑
ⓘ Cost ranges are severity-bucket heuristics (US national rule-of-thumb). Get contractor quotes + a written scope before underwriting a rehab budget.
Schools (NCES district)
- District
- Tomball ISD
- NCES district ID
- 4842960
- Math proficiency
- 66% ▼ -6.00%
- Reading proficiency
- 63% ▼ -4.00%
- Median HH income
- $86,552
- Composite
- 58.32/100
- National rank
- #1014
- State rank
- #25 of 826 in TX
Livability — Pinehurst
- Score
- 55/100
- State rank
- #1350
- US rank
- #23272
Category grades
Schools grade is shown separately in the Schools card above.
Census & demographics
- Population (ZIP)
- 7,474
Population outlook (Montgomery County) Hauer SSP2
- Today (2025)
- 713,896 people
- By 2030
- 805,263 · +12.8%
- By 2040
- 992,708 · +39.1%
- By 2050
- 1,179,590 · +65.2%
- By 2075
- 1,628,084 · +128.1%
- By 2100
- 1,937,880 · +171.5%
Race, ethnicity, and origin ACS 2023
- Neighborhood character
- Predominantly White (68%)
- Race & ethnicity
- White 68% Hispanic / Latino 20% Two or more races 10% Black 7% Asian 3%
- Hispanic origin (detail)
- Mexican 15%
- Common ancestry
- Lithuanian 4% Slovak 4% Serbian 2%
- Foreign-born
- 10% · Canada, Jamaica
- Languages at home
- 78% English-only · Spanish 18% Other Indo-European 2%
Political lean MEDSL · Montgomery
- 2024 margin
- Solid R (+45.5) · D 26.8% · R 72.3%
- 2008→2024 swing
- +7.2pp toward D · 2008: -52.7pp · 2024: -45.5pp
- All cycles
- 2024: R+45.5 2020: R+43.8 2016: R+51.4 2012: R+60.7 2008: R+52.7
Not yet ingested
- Civics
- —
Market trends
- HPI YoY
- ▼ -116.65%
- Current HPI
- 284.6412
- Rent YoY
- —
- Metro
- —
- State GDP YoY
- ▲ 3.95%
- F500 in state
- 110
Industry mix (Fortune 500 HQ in TX)
| Industry | F500 HQs | Revenue |
|---|---|---|
| Energy | 16 | $1,198B |
|
||
| Technology | 5 | $198B |
|
||
| Engineering / Construction | 4 | $72B |
|
||
| Energy Services | 3 | $60B |
|
||
| Utilities | 3 | $41B |
|
||
| Healthcare | 2 | $330B |
|
||
Price history
+35.0% since first listed14 events — show timeline
- 2026-04-13 Listing Removed — HARMLS
- 2026-04-13 Listed $269,900 HARMLS
- 2026-04-09 Price Changed $269,900 HARMLS
- 2026-02-22 Price Changed $289,000 HARMLS
- 2026-02-15 Listed $299,000 HARMLS
- 2021-11-22 Sold (Public Records) — Public Records
- 2021-11-19 Sold (MLS) — HARMLS
- 2021-11-10 Pending — HARMLS
- 2021-10-27 Pending — HARMLS
- 2021-10-21 Listed $260,300 HARMLS
- 2021-08-13 Sold (Public Records) — Public Records
- 2020-12-22 Sold (MLS) — HARMLS
- 2020-06-11 Listing Removed — HARMLS
- 2020-06-11 Listed $199,990 HARMLS
Property tax history
+6.0%/yrLatest (2025): $8,934 · -6.6% YoY. Source: county tax records.
Cash-flow waterfall
monthlySold comps — $/sqft
last 12 mo · ≤1 miLoading sold comps…