 🏷️ Likely Rental
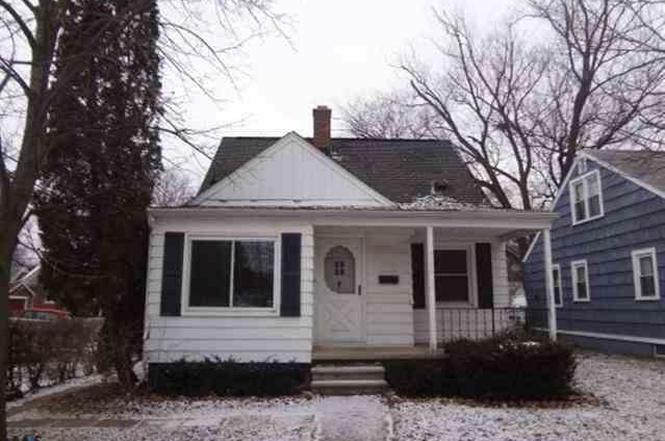
20005 Woodworth St · Redford, MI
Flood risk 1/10 · Minimal
- FEMA flood zone
- X (unshaded)
- Chance of flooding over 30 yrs
- 0.0%
- Est. flood insurance / yr
- $473 – $860
Fire risk 1/10 · Minimal
- Est. fire insurance / yr
- $784 – $1,456
Heat risk 3/10 · Minor
- Hot days now (above 98°F)
- 7 days/yr
- Hot days in 30 yrs
- 15 days/yr
Wind risk 2/10 · Minimal
- Chance of severe wind over 30 yrs
- —
Air-quality risk 3/10 · Minor
- Unhealthy air days now
- 2 days/yr
- Unhealthy air days in 30 yrs
- 3 days/yr
Risk factors via First Street. Map © Google.
Why this score? — see what drove the C grade
The composite is a weighted blend of 9 inputs, each scored 0–100. Each bar is that input's sub-score; the figure is the points it added to the 100-point composite (weight × sub-score).
- Cash flow +20.1/30.0
- ARV discount +15.0/15.0
- DSCR +6.4/10.0
- 1% rule +5.6/10.0
- Rent growth +2.5/5.0
- Livability +2.5/5.0
- Condition / age +2.5/5.0
- Schools +1.4/10.0
- Appreciation +0.0/10.0
$135,000
🖨 Deal sheet 📄 Offer letter ✓ Due diligence
Listing remarks MLS
This is a 3 bedroom, 1 bath with 1 car garage. TENANT OCCUPIED property. New hot water tank in 2023. Tenant has been there since 2020 and month to month. Rent is $1,082.38 per month. Notice will be given to tenant after accepted offer, if buyer is interested in property as primary residence.
Key facts
- 5,227 sq ft lot
- Garage
- Built 1952
Property features AI
Exterior
- Parking: Detached garage (1 space)
- Home design: Single-family residence; Residential property; Built in 1952
- Construction: Vinyl siding
- Exterior features: 0.12-acre lot; Public water
Interior
- Bathrooms: 1 full bathroom
- Heating & cooling: Forced air heating
- Interior features: Total of 4 rooms; Slab basement
Neighborhood map
What this means for you Summary
Snapshot
- This is a 2-bed/1.0-bath single-family listed at $135k.
Deal economics
- At list price, monthly cash flow is $167 ($2k/yr) — positive.
- The deal already cash-flows at list — no discount required.
- Meets the 1% rule at list price ($1k rent vs $135k).
- Recommended offer: $119k (12.0% below list) — sets the bar for market timing.
Location & tenants
- Location reads: area grade C — affects rentability + tenant quality, not the cash-flow math above.
- Redford Union Schools District No. 1 (suburban): math 8% / reading 23% proficiency, ranked #489 of 540 in MI (top 91%) — low school quality limits family demand, transient renter base, plan for 1-2y turnover; 66% free/reduced lunch — lower-income household profile, screen leases tightly.
- Market conditions: 86 active listings in the ZIP; 12 comparable units currently listed for rent nearby; rentals at typical pace (median 15d on market — plan ~3-4 weeks tenant-placement turnaround); 2,639 units permitted in Wayne County in 2024 (1,216 in 5+ unit buildings).
Forward outlook
- Local home prices are declining (-3.0%/yr); year-one equity from $933 of loan paydown is wiped out by about $4k of value loss. Plan a longer hold.
- Wayne County population projected at -17% by 2050 — secular population decline; favor cash flow + early exit over multi-decade hold.
Negotiation context
- It's been on market 393 days — a 12% lower offer ($119k) is reasonable based on typical stale-listing flexibility.
- 7 sale attempts since 27y ago with the ask held roughly flat each time — persistent listings suggest the price (not the market) is what's stuck; bring a comps-based counter.
Risks & watch-outs
- Watch-outs: built in 1952 — expect roof / HVAC / electrical / plumbing capex.
Questions for the listing agent
- It's been on market 393 days. Have you received any prior offers? Is the seller open to a 12% concession, seller financing, or rate buy-down credit?
- Built in 1952 — when were the roof, HVAC, electrical panel, plumbing, and water heater last replaced?
- Why hasn't it sold? Are there any deal-killer items the seller is aware of (foundation, flood, title, zoning, code violations)?
- Is there a deadline driving the sale (1031 exchange, divorce, estate, relocation)? That informs how much negotiation room exists.
- What's the average days-on-market for RENTAL listings here right now (not sales)? A rising rental-DOM trend means longer vacancies and softer asking-rent achievability than the comps imply.
- What's the recent tenant-quality profile in this submarket — average credit score on applications, eviction rate, late-payment / NSF rate, and stable-employment percentage? A property-management company in the area should have these aggregated.
- How much new for-sale + rental construction is in the pipeline within 1–3 miles? Heavy new supply typically softens prices + rents 12–24 months out; constrained supply supports both.
Investment metrics
- 1% rule
- 1.06% ✓
- Cap rate
- 7.78%
- Cash-on-cash
- 5.31%
- DSCR
- 1.24
- GRM
- 7.8
CMA / ARV
- ARV (on-the-fly)
- $204,440
- Comps found
- 12
Show comp detail 12 sales within ~0.75 mi
| Address | Dist | Beds/Ba | Sqft | Sold | Price | $/sf | Match |
|---|---|---|---|---|---|---|---|
| 20008 Negaunee | 0.48mi | 2/1.5 | 1,432 (+6%) | 1mo | $129,000 | $90 | 64 |
| 20917 Delaware St | 0.52mi | 3/1.5 (+1) | 1,325 (-2%) | 3mo | $234,300 | $177 | 64 |
| 20462 Beech Daly Rd | 0.38mi | 3/1.0 (+1) | 1,422 (+6%) | 6mo | $159,999 | $113 | 63 |
| 19550 Imperial Hwy | 0.61mi | 3/1.0 (+1) | 1,350 (+0%) | 5mo | $174,900 | $130 | 62 |
| 21115 East St | 0.61mi | 3/1.0 (+1) | 1,350 (+0%) | 5mo | $210,000 | $156 | 61 |
| 19953 Wakenden | 0.14mi | 3/2.0 (+1) | 1,162 (-14%) | 2mo | $209,000 | $180 | 60 |
| 19361 Wakenden | 0.44mi | 3/2.0 (+1) | 1,248 (-7%) | 0mo | $155,000 | $124 | 58 |
| 20433 Lexington | 0.20mi | 3/2.5 (+1) | 1,500 (+12%) | 4mo | $228,500 | $152 | 57 |
| 20503 Centralia | 0.34mi | 3/2.0 (+1) | 1,197 (-11%) | 1mo | $170,000 | $142 | 56 |
| 19551 Imperial Hwy | 0.57mi | 3/1.5 (+1) | 1,300 (-3%) | 6mo | $130,000 | $100 | 56 |
| 26293 Shiawassee Rd | 0.61mi | 3/1.5 (+1) | 1,292 (-4%) | 6mo | $254,400 | $197 | 53 |
| 20558 Seminole | 0.66mi | 3/2.0 (+1) | 1,200 (-11%) | 3mo | $204,900 | $171 | 39 |
Match score weights: distance 35% · size 25% · config 20% · recency 20%. Top-matched comps best support the ARV.
Projected returns pro-forma
-3.0% appreciation · 3.0% rent growth · sell at horizon
- IRR
- -8.0%
- Equity multiple
- 0.70×
- Total profit
- $-11,178
- Equity at exit
- $20,129
- IRR
- 1.6%
- Equity multiple
- 1.11×
- Total profit
- $4,158
- Equity at exit
- $11,672
Cash invested: $37,800 (down + closing). Projections, not guarantees.
Landlord ↔ Tenant lean methodology
- Overall (STATE)
- 62 Landlord-Friendly
- State Michigan
- 62 Landlord-Friendly · EVEN
- County
- — inherits STATE
- City
- — inherits STATE
ZIP-level market 48240
- Active inventory
- 86
- Price-to-rent
- 7.8×
Monthly cashflow live
- Estimated rent
- $1,434 high interval (Pro) →
- Mortgage (P&I)
- −$708
- Tax from tax record
- −$202 /mo · $2,419/yr
- Insurance
- −$56
- HOA
- −$0
- Vacancy / Maint / Mgmt
- −$301
- Net cashflow
- $167
Break-even live
UW: 25.0% down · 7.5% · 30yr · 1.5% tax · 5.0% vac · 8.0% maint · 8.0% mgmt
Financing live
Cash to close
- Down payment
- $33,750
- Closing costs
- $4,050
- Reserves months
- —
- Total cash needed
- —
Loan-product check · same deal, 3 products live
Conventional
25% down · 7.5% · 30yr
- Down + closing
- —
- Monthly P&I
- —
- Monthly cashflow
- —
- DSCR
- —
- Eligible?
- —
Personal DTI + credit; lowest rate.
DSCR
20% down · 8.5% · 30yr
- Down + closing
- —
- Monthly P&I
- —
- Monthly cashflow
- —
- DSCR
- —
- Eligible?
- —
No personal income docs; deal must DSCR.
Hard money
10% down · 12.0% · 12mo
- Down + closing
- —
- Monthly P&I
- —
- Monthly cashflow
- —
- DSCR
- —
- Eligible?
- —
Short-term bridge; refi at stabilization.
Rent comps 12 comps
| Address | Beds | Baths | Sqft | Rent | $/sqft | DOM | Units | Dist |
|---|---|---|---|---|---|---|---|---|
| 20524 Indian Redford, MI | 3.0 | 1.0 | 988 | $1,600 | $1.62 | 24d | 1 | 0.52mi |
| 25740 Shiawassee St Southfield, MI | 1.0–2.0 | 1.0 | 850 | $1,253 | $1.47 | 43d | 10 | 0.72mi |
| 19354 Seminole Redford, MI | 3.0 | 1.0 | 1050 | $1,450 | $1.38 | 24d | 1 | 0.76mi |
| 26539 Clarita Redford, MI | 3.0 | 1.5 | 931 | $1,875 | $2.01 | 24d | 1 | 0.77mi |
| 25400 Basin St Southfield, MI | 1.0–2.0 | 1.0 | 825 | $1,400 | $1.70 | 4d | 11 | 0.80mi |
| 20410 Five Points St Redford, MI | 3.0 | 1.0 | 950 | $1,600 | $1.68 | 4d | 1 | 0.82mi |
| 20083 Salem St Detroit, MI | 3.0 | 1.0 | 969 | $1,050 | $1.08 | 4d | 1 | 0.84mi |
| 20083 Salem St Detroit, MI | 3.0 | 1.0 | 969 | $1,050 | $1.08 | 10d | 1 | 0.84mi |
| 20745 Saint Francis Unit 101 Farmington Hills, MI | 2.0 | 1.0 | 900 | $1,495 | $1.66 | 43d | 1 | 1.02mi |
| 20745 Saint Francis Unit 208 Farmington Hills, MI | 2.0 | 1.0 | 900 | $1,395 | $1.55 | 14d | 1 | 1.02mi |
| 18732 Salem Unit 2 Detroit, MI | 2.0 | 1.0 | 925 | $1,050 | $1.14 | 12d | 1 | 1.14mi |
| 18405 Gillman St Livonia, MI | 3.0 | 2.0 | 1014 | $1,950 | $1.92 | 4d | 1 | 1.45mi |
Listing history 32 events
-
2026-06-18days on market $135,000 Active 393 DOM
-
2026-06-17days on market $135,000 Active 392 DOM
-
2026-06-16days on market $135,000 Active 391 DOM
-
2026-06-15days on market $135,000 Active 390 DOM
-
2026-06-13days on market $135,000 Active 388 DOM
-
2026-06-13days on market $135,000 Active 387 DOM
-
2026-06-09days on market $135,000 Active 384 DOM
-
2026-06-08days on market $135,000 Active 383 DOM
-
2026-06-07days on market $135,000 Active 382 DOM
-
2026-06-04days on market $135,000 Active 379 DOM
-
2026-06-03days on market $135,000 Active 378 DOM
-
2026-06-02days on market $135,000 Active 377 DOM
-
2026-06-01days on market $135,000 Active 376 DOM
-
2026-05-31days on market $135,000 Active 375 DOM
-
2025-08-13price $135,000 292-char remark
Show marketing remark (292 chars)
This is a 3 bedroom, 1 bath with 1 car garage. TENANT OCCUPIED property. New hot water tank in 2023. Tenant has been there since 2020 and month to month. Rent is $1,082.38 per month. Notice will be given to tenant after accepted offer, if buyer is interested in property as primary residence.
-
2025-08-13price $135,000
Show marketing remark (292 chars)
This is a 3 bedroom, 1 bath with 1 car garage. TENANT OCCUPIED property. New hot water tank in 2023. Tenant has been there since 2020 and month to month. Rent is $1,082.38 per month. Notice will be given to tenant after accepted offer, if buyer is interested in property as primary residence.
-
2025-05-21$140,000 Active 292-char remark
Show marketing remark (292 chars)
This is a 3 bedroom, 1 bath with 1 car garage. TENANT OCCUPIED property. New hot water tank in 2023. Tenant has been there since 2020 and month to month. Rent is $1,082.38 per month. Notice will be given to tenant after accepted offer, if buyer is interested in property as primary residence.
-
2025-05-21$140,000 Active
Show marketing remark (292 chars)
This is a 3 bedroom, 1 bath with 1 car garage. TENANT OCCUPIED property. New hot water tank in 2023. Tenant has been there since 2020 and month to month. Rent is $1,082.38 per month. Notice will be given to tenant after accepted offer, if buyer is interested in property as primary residence.
-
2020-11-30soldstatus $1,011,665
-
2018-10-12soldstatus $432,800
-
2013-04-12soldstatus $25,500
-
2013-04-12soldstatus $25,500
-
2013-03-28historical
-
2013-03-28historical
-
2013-02-20$27,200
-
2013-02-20$27,200
-
2010-08-08historical
-
2009-02-08$70,000
-
1999-07-13soldstatus $93,000
-
1999-05-20$89,900
ⓘ Source: listings_history table (triggers on properties + properties_extension) + one-shot
backfill from property_details.listing_events for pre-trigger history.
Tax reassessment forecast MI · Partial reset (capped growth)
- Current annual tax
- $2,419 · $202/mo
- Projected year-2 tax
- $2,419 · $202/mo
- Expected delta
- $0/yr ($0/mo · 0.0%)
ⓘ Screening estimate from a state-policy table — verify with the county assessor before closing.
Climate risk First Street
- Flood 1/10 Low FEMA zone X (unshaded) · 0% chance over 30 yrs
- Wildfire 1/10 Low
- Heat 3/10 Moderate 7 d/yr ≥98°F today · 15 d/yr by 30 yrs out
- Wind 2/10 Low
- Air quality 3/10 Moderate 2 unhealthy d/yr today · 3 by 30 yrs out
Nearby sold comps map
Loading sold comps map…
Walkable amenities ~0.75 mi
Loading nearby amenities…
Taxation est. · year 1
- Rental income
- $17,212
- − Mortgage interest
- −$7,562
- − Property taxes
- −$2,419
- − Insurance
- −$675
- − Repairs & maintenance
- −$1,377
- − Management
- −$1,377
- − Depreciation
- −$3,927
- Taxable loss
- −$126
- Est. tax savings @ 24.0%
- +$30
- After-tax cash flow
- $2,038/yr
For passive investors: Depreciation is non-cash, so a rental often shows a tax loss while cash-flowing — sheltering income. Rental losses are passive: they offset passive income freely, and up to $25,000/yr can offset ordinary (W-2) income if you actively participate and your MAGI is under $100k (phasing out to $0 by $150k); unused losses carry forward. On sale, claimed depreciation is recaptured at up to 25%, and gains may owe capital-gains tax (a 1031 exchange can defer both). Figures are a year-1 estimate at your 24.0% rate — not tax advice; consult a CPA.
Schools (NCES district)
- District
- Redford Union Schools District No. 1
- NCES district ID
- 2629460
- Math proficiency
- 8% ▼ -6.00%
- Reading proficiency
- 23% ▬ 0.00%
- Median HH income
- $49,778
- Composite
- 14.1/100
- National rank
- #9460
- State rank
- #489 of 540 in MI
Livability — Redford
No livability data for this city. (Only ~50 U.S. cities are tracked.)
Census & demographics
- City population
- 36,976
- Population (ZIP)
- 17,097
Population outlook (Wayne County) Hauer SSP2
- Today (2025)
- 1,675,273 people
- By 2030
- 1,620,300 · -3.3%
- By 2040
- 1,502,341 · -10.3%
- By 2050
- 1,384,039 · -17.4%
- By 2075
- 1,124,592 · -32.9%
- By 2100
- 881,193 · -47.4%
Race, ethnicity, and origin ACS 2023
- Neighborhood character
- Diverse neighborhood (Simpson 0.64)
- Race & ethnicity
- White 45% Black 40% Two or more races 10% Hispanic / Latino 6%
- Hispanic origin (detail)
- Mexican 6%
- Common ancestry
- Romanian 5% Lithuanian 3% Slovak 2%
- Foreign-born
- 4% · Canada
- Languages at home
- 93% English-only · Spanish 5% Chinese 1%
Political lean MEDSL · Wayne
- 2024 margin
- Strong D (+29.0) · D 62.7% · R 33.7% · Other 3.6%
- 2008→2024 swing
- -20.5pp toward R · 2008: 49.5pp · 2024: 29.0pp
- All cycles
- 2024: D+29.0 2020: D+38.1 2016: D+37.3 2012: D+46.9 2008: D+49.5
Not yet ingested
- Civics
- —
Market trends
- HPI YoY
- ▼ -177.98%
- Current HPI
- 236.2958
- Rent YoY
- —
- Metro
- —
- State GDP YoY
- ▲ 1.37%
- F500 in state
- 28
Industry mix (Fortune 500 HQ in MI)
| Industry | F500 HQs | Revenue |
|---|---|---|
| Automotive Parts | 3 | $48B |
|
||
| Automotive | 2 | $372B |
|
||
| Chemicals | 1 | $45B |
|
||
| Automotive Retail | 1 | $29B |
|
||
| Healthcare / Medical Devices | 1 | $23B |
|
||
| Automotive Technology | 1 | $20B |
|
||
Price history
+50.2% since first listed18 events — show timeline
- 2025-08-13 Price Changed $135,000 MiRealSource-MiMLS
- 2025-08-13 Price Changed $135,000 REALCOMP
- 2025-08-13 Price Changed $135,000 SW Michigan MLS
- 2025-05-21 Listed $140,000 SW Michigan MLS
- 2025-05-21 Listed $140,000 REALCOMP
- 2025-05-21 Listed $140,000 MiRealSource-MiMLS
- 2020-11-30 Sold (Public Records) $1,011,665 Public Records
- 2018-10-12 Sold (Public Records) $432,800 Public Records
- 2013-04-12 Sold (MLS) $25,500 MiRealSource-MiMLS
- 2013-04-12 Sold (MLS) $25,500 REALCOMP
- 2013-03-28 Listing Removed — MiRealSource-MiMLS
- 2013-03-28 Listing Removed — REALCOMP
- 2013-02-20 Listed $27,200 MiRealSource-MiMLS
- 2013-02-20 Listed $27,200 REALCOMP
- 2010-08-08 Listing Removed — REALCOMP
- 2009-02-08 Listed $70,000 REALCOMP
- 1999-07-13 Sold (MLS) $93,000 REALCOMP
- 1999-05-20 Listed $89,900 REALCOMP
Property tax history
+2.1%/yrLatest (2025): $2,419 · -45.3% YoY. Source: county tax records.
Cash-flow waterfall
monthlySold comps — $/sqft
last 12 mo · ≤1 miLoading sold comps…