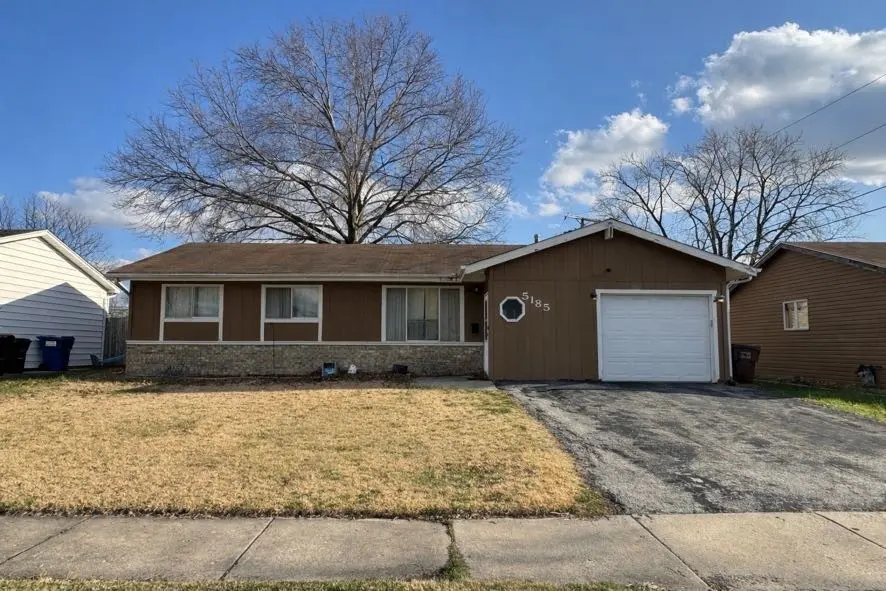
5185 Coulter Rd · Oak Forest, IL
Flood risk 1/10 · Minimal
- FEMA flood zone
- X (unshaded)
- Chance of flooding over 30 yrs
- 0.0%
- Est. flood insurance / yr
- $473 – $860
Fire risk 1/10 · Minimal
- Est. fire insurance / yr
- $804 – $1,492
Heat risk 3/10 · Minor
- Hot days now (above 101°F)
- 7 days/yr
- Hot days in 30 yrs
- 15 days/yr
Wind risk 2/10 · Minimal
- Chance of severe wind over 30 yrs
- —
Air-quality risk 3/10 · Minor
- Unhealthy air days now
- 4 days/yr
- Unhealthy air days in 30 yrs
- 4 days/yr
Risk factors via First Street. Map © Google.
Why this score? — see what drove the D+ grade
The composite is a weighted blend of 9 inputs, each scored 0–100. Each bar is that input's sub-score; the figure is the points it added to the 100-point composite (weight × sub-score).
- ARV discount +15.0/15.0
- Cash flow +13.3/30.0
- 1% rule +5.6/10.0
- Livability +4.2/5.0
- DSCR +4.0/10.0
- Rent growth +2.5/5.0
- Condition / age +2.5/5.0
- Schools +1.5/10.0
- Appreciation +0.0/10.0
$199,000
🖨 Deal sheet (PDF) 📄 Offer letter ✓ Due diligence
Listing remarks
Attention Investors and Homeowners: Exceptional opportunity to acquire a solid 3-bed, 2-bath ranch-style home in the heart of Oak Forest, perfect for a high-yield rental or a fix-and-flip project. This property is a blank canvas ready for your renovation vision and modern improvements, situated in a high-demand area just minutes from the Oak Forest Metra Station and major Pace bus routes for an effortless commute. The location offers unbeatable community amenities, including proximity to the Oak Forest Police Department, world-class healthcare at Oak Forest Health Center, and the highly-regarded Oak Forest High School District 228. Being sold strictly AS-IS-this is a dream for cash buyers l
Key facts
- Community amenities
- Ranch-style home
- High-demand area
Tags
Property features AI
Finance
- Other: Lot size less than 0.25 acre (county records); Living area source: assessor; Property offers school bus service, commuter bus and train access, and interstate access; Possession at closing
- HOA & community: No master association fee required; Community features include curbs, sidewalks, street lights, and paved streets
Exterior
- Parking: Attached garage (garage owned), 1.5 garage/parking spaces total
- Utilities: Public water; Public sewer; Electric with circuit breakers
- Home design: Detached single-family home; One-story design; Fee simple ownership; Built before 1978
- Construction: Frame construction; Asphalt roof; Concrete perimeter foundation; Property age approximately 51–60 years
- Exterior features: Curbs and sidewalks; Street lights and paved streets
Interior
- Kitchen: Range; Refrigerator; Kitchen on the main level (approx. 12 x 14)
- Bedrooms: Three bedrooms (all on the main level); Master bedroom on the main level (approx. 12 x 14); Second bedroom on the main level (approx. 10 x 12); Third bedroom on the main level (approx. 10 x 10)
- Bathrooms: Two full bathrooms
- Heating & cooling: Natural gas forced air heating; Central air conditioning
- Interior features: Six total rooms; Separate dining room; Crawl space basement; One fireplace located in the dining room
- Laundry & utility: Main-level laundry room (approx. 8 x 8)
Neighborhood map
What this means for you Summary
Snapshot
- This is a 3-bed/1.5-bath single-family listed at $199k.
Deal economics
- At list price, monthly cash flow is $0 ($0/yr) — positive.
- The deal already cash-flows at list — no discount required.
- Meets the 1% rule at list price ($2k rent vs $199k).
- Cap rate 6.3% vs local median 4.5% in Oak Forest — top-decile yield for the area; either an underpriced asset or a hidden risk that comps aren't pricing in. Stress-test before assuming the spread holds.
Location & tenants
- Location reads 85/100 on livability (#28 in IL, #501 nationally) — a professional / high-income tenant draw. Strengths: crime A+, commute A+, employment A+; Watch: amenities F.
- Bremen Chsd 228 (suburban): math 15% / reading 17% proficiency, ranked #468 of 620 in IL (top 76%) — low school quality limits family demand, transient renter base, plan for 1-2y turnover.
- Zoned schools: Tinley Park High School (math 22% / reading 25%, grade F, #309 of 693 statewide, top 45%, 1,089 students, 0% FRL).
- Market conditions: 50 active listings in the ZIP; 3 comparable units currently listed for rent nearby; rentals at typical pace (median 18d on market — plan ~3-4 weeks tenant-placement turnaround); solid renter incomes; 6,272 units permitted in Cook County in 2024 (4,658 in 5+ unit buildings).
Forward outlook
- Local home prices are declining (-3.0%/yr); year-one equity from $1k of loan paydown is wiped out by about $6k of value loss. Plan a longer hold.
Negotiation context
- Only 10 days on market — expect competitive offers; lowballing is unlikely to land.
- Current owner paid $153k; 30% above their basis — modest negotiation headroom, anchor on the comps not their cost.
Risks & watch-outs
- Watch-outs: property tax is 3.2% of price.
Questions for the listing agent
- Built in 1969 — when were the roof, HVAC, electrical panel, plumbing, and water heater last replaced?
- Property tax is high relative to price — has the assessment been appealed recently, and will the sale trigger a re-assessment?
- Is there a deadline driving the sale (1031 exchange, divorce, estate, relocation)? That informs how much negotiation room exists.
- The area grade is low — what's the realistic commute time and amenity access for the typical tenant pool here? Any planned neighborhood developments (good or bad) we should know about?
- What's the average days-on-market for RENTAL listings here right now (not sales)? A rising rental-DOM trend means longer vacancies and softer asking-rent achievability than the comps imply.
- What's the recent tenant-quality profile in this submarket — average credit score on applications, eviction rate, late-payment / NSF rate, and stable-employment percentage? A property-management company in the area should have these aggregated.
- How much new for-sale + rental construction is in the pipeline within 1–3 miles? Heavy new supply typically softens prices + rents 12–24 months out; constrained supply supports both.
Investment metrics
- 1% rule
- 1.06% ✓
- Cap rate
- 6.29%
- Cash-on-cash
- 0.00%
- DSCR
- 1.00
- GRM
- 7.9
CMA / ARV
- ARV (on-the-fly)
- $309,264
- Comps found
- 12
Show comp detail 12 sales within ~0.75 mi
| Address | Dist | Beds/Ba | Sqft | Sold | Price | $/sf | Match |
|---|---|---|---|---|---|---|---|
| 5185 Coulter Rd | 0.00mi | 3/2.0 | 1,137 (0%) | 1mo | $215,000 | $189 | 97 |
| 5142 Elmwood Rd | 0.10mi | 3/1.5 | 1,085 (-5%) | 10mo | $280,000 | $258 | 79 |
| 16824 Meadowdale Dr | 0.15mi | 4/2.0 (+1) | 1,100 (-3%) | 4mo | $280,000 | $255 | 77 |
| 16806 Laramie Ave | 0.14mi | 3/1.5 | 1,100 (-3%) | 20mo | $286,000 | $260 | 72 |
| 17011 Le Claire Ave | 0.30mi | 3/1.0 | 1,186 (+4%) | 10mo | $342,500 | $289 | 69 |
| 4925 Timber Ct | 0.27mi | 3/2.0 | 1,081 (-5%) | 11mo | $343,000 | $317 | 68 |
| 5162 Newport Dr | 0.10mi | 3/2.0 | 1,200 (+6%) | 20mo | $340,000 | $283 | 68 |
| 5101 Elmwood Rd | 0.15mi | 3/2.0 | 1,040 (-8%) | 18mo | $293,000 | $282 | 61 |
| 16740 Forest Ave | 0.36mi | 3/2.0 | 1,281 (+13%) | 1mo | $332,000 | $259 | 59 |
| 5185 Greentree Rd | 0.15mi | 4/2.0 (+1) | 991 (-13%) | 7mo | $240,000 | $242 | 59 |
| 17021 Sycamore Ln | 0.32mi | 3/2.0 | 1,241 (+9%) | 13mo | $337,278 | $272 | 57 |
| 17220 Central Ave | 0.72mi | 2/1.5 (-1) | 1,001 (-12%) | 7mo | $345,000 | $345 | 36 |
Match score weights: distance 35% · size 25% · config 20% · recency 20%. Top-matched comps best support the ARV.
Projected returns pro-forma
-3.0% appreciation · 3.0% rent growth · sell at horizon
- IRR
- -16.2%
- Equity multiple
- 0.43×
- Total profit
- $-32,038
- Equity at exit
- $29,672
- IRR
- -7.7%
- Equity multiple
- 0.51×
- Total profit
- $-27,057
- Equity at exit
- $17,206
Cash invested: $55,720 (down + closing). Projections, not guarantees.
Landlord ↔ Tenant lean methodology
- Overall (STATE)
- 43 Moderately Tenant-Leaning
- State Illinois
- 43 Moderately Tenant-Leaning · D+7
- County
- — inherits STATE
- City
- — inherits STATE
ZIP-level market 60452
- Active inventory
- 50
- Price-to-rent
- 7.9×
Monthly cashflow live
- Estimated rent
- $2,101 medium interval (Pro) →
- Mortgage (P&I)
- −$1,044
- Tax from tax record
- −$533 /mo · $6,395/yr
- Insurance
- −$83
- HOA
- −$0
- Vacancy / Maint / Mgmt
- −$441
- Net cashflow
- $0
Break-even live
Sensitivity live
| Price | -10% $113 | -5% $56 | +0% $0 | +5% $-56 | +10% $-113 |
|---|---|---|---|---|---|
| Rent | -10% $-166 | -5% $-83 | +0% $0 | +5% $83 | +10% $166 |
| Rate | -1.0pp $100 | -0.5pp $51 | base $0 | +0.5pp $-52 | +1.0pp $-104 |
UW: 25.0% down · 7.5% · 30yr · 1.5% tax · 5.0% vac · 8.0% maint · 8.0% mgmt
Financing live
Cash to close
- Down payment
- $49,750
- Closing costs
- $5,970
- Reserves months
- —
- Total cash needed
- —
Loan-product check · same deal, 3 products live
Conventional
25% down · 7.5% · 30yr
- Down + closing
- —
- Monthly P&I
- —
- Monthly cashflow
- —
- DSCR
- —
- Eligible?
- —
Personal DTI + credit; lowest rate.
DSCR
20% down · 8.5% · 30yr
- Down + closing
- —
- Monthly P&I
- —
- Monthly cashflow
- —
- DSCR
- —
- Eligible?
- —
No personal income docs; deal must DSCR.
Hard money
10% down · 12.0% · 12mo
- Down + closing
- —
- Monthly P&I
- —
- Monthly cashflow
- —
- DSCR
- —
- Eligible?
- —
Short-term bridge; refi at stabilization.
Rent comps 3 comps
| Address | Beds | Baths | Sqft | Rent | $/sqft | DOM | Units | Dist |
|---|---|---|---|---|---|---|---|---|
| 16703 Lakewood Dr Tinley Park, IL | 1.0–2.0 | 1.0–2.0 | 972 | $1,505 | $1.55 | 3d | 1 | 0.96mi |
| 16450 Roy St Oak Forest, IL | 3.0 | 1.5 | 1500 | $2,400 | $1.60 | 18d | 1 | 1.02mi |
| 5119W 159th St Unit 3SE Oak Forest, IL | 2.0 | 2.0 | 1300 | $2,250 | $1.73 | 25d | 1 | 1.29mi |
Listing history 5 events
-
2026-04-20status Pending
-
2026-04-09$199,000 Active
-
2003-07-30soldstatus $153,000
-
1992-08-27soldstatus $110,500
-
1985-01-03soldstatus $60,500
ⓘ Source: listings_history table (triggers on properties + properties_extension) + one-shot
backfill from property_details.listing_events for pre-trigger history.
Tax reassessment forecast IL · Partial reset (capped growth)
- Current annual tax
- $6,395 · $533/mo
- Projected year-2 tax
- $6,395 · $533/mo
- Expected delta
- $0/yr ($0/mo · 0.0%)
ⓘ Screening estimate from a state-policy table — verify with the county assessor before closing.
Climate risk First Street
- Flood 1/10 Low FEMA zone X (unshaded) · 0% chance over 30 yrs
- Wildfire 1/10 Low
- Heat 3/10 Moderate 7 d/yr ≥101°F today · 15 d/yr by 30 yrs out
- Wind 2/10 Low
- Air quality 3/10 Moderate 4 unhealthy d/yr today · 4 by 30 yrs out
Nearby sold comps map
Loading sold comps map…
Walkable amenities ~0.75 mi
Loading nearby amenities…
Taxation est. · year 1
- Rental income
- $25,207
- − Mortgage interest
- −$11,147
- − Property taxes
- −$6,395
- − Insurance
- −$995
- − Repairs & maintenance
- −$2,017
- − Management
- −$2,017
- − Depreciation
- −$5,789
- Taxable loss
- −$3,152
- Est. tax savings @ 24.0%
- +$757
- After-tax cash flow
- $757/yr
For passive investors: Depreciation is non-cash, so a rental often shows a tax loss while cash-flowing — sheltering income. Rental losses are passive: they offset passive income freely, and up to $25,000/yr can offset ordinary (W-2) income if you actively participate and your MAGI is under $100k (phasing out to $0 by $150k); unused losses carry forward. On sale, claimed depreciation is recaptured at up to 25%, and gains may owe capital-gains tax (a 1031 exchange can defer both). Figures are a year-1 estimate at your 24.0% rate — not tax advice; consult a CPA.
Schools (NCES district)
- District
- Bremen Chsd 228
- NCES district ID
- 1707050
- Math proficiency
- 15% ▼ -4.00%
- Reading proficiency
- 17% ▼ -5.00%
- Median HH income
- $57,625
- Composite
- 15.32/100
- National rank
- #9327
- State rank
- #468 of 620 in IL
Livability — Oak Forest
- Score
- 85/100
- State rank
- #28
- US rank
- #501
Category grades
Schools grade is shown separately in the Schools card above.
Census & demographics
- Census place
- Oak Forest, IL
- County
- Cook County · 4,486,803 people
- City population
- 26,739
- Metro
- Chicago-Naperville-Elgin, IL-IN-WI
- Population (ZIP)
- 26,739
- Household income
- $93,076
- Rent vs Own
- Severe rent burden
- 299.0
Population outlook (Cook County) Hauer SSP2
- Today (2025)
- 5,347,519 people
- By 2030
- 5,357,703 · +0.2%
- By 2040
- 5,324,924 · -0.4%
- By 2050
- 5,230,762 · -2.2%
- By 2075
- 4,785,735 · -10.5%
- By 2100
- 4,188,836 · -21.7%
Race, ethnicity, and origin ACS 2023
- Neighborhood character
- Majority White (65%)
- Race & ethnicity
- White 65% Hispanic / Latino 18% Two or more races 10% Black 8% Asian 6%
- Hispanic origin (detail)
- Mexican 16% Puerto Rican 1%
- Common ancestry
- Romanian 13% Iranian 1% Lithuanian 1%
- Foreign-born
- 14% · Canada, Dominican Republic, China
- Languages at home
- 77% English-only · Spanish 12% Other Indo-European 4% Arabic 2%
Political lean MEDSL · Cook
- 2024 margin
- Solid D (+42.0) · D 70.4% · R 28.4% · Other 1.2%
- 2008→2024 swing
- -11.4pp toward R · 2008: 53.4pp · 2024: 42.0pp
- All cycles
- 2024: D+42.0 2020: D+50.3 2016: D+53.0 2012: D+49.4 2008: D+53.4
Not yet ingested
- Civics
- —
Market trends
- HPI YoY
- ▼ -228.62%
- Current HPI
- 205.0118
- Rent YoY
- —
- Metro
- Chicago-Naperville-Elgin, IL-IN-WI
- State GDP YoY
- ▲ 1.59%
- F500 in state
- 60
Industry mix (Fortune 500 HQ in IL)
| Industry | F500 HQs | Revenue |
|---|---|---|
| Insurance | 4 | $201B |
|
||
| Consumer Goods | 4 | $87B |
|
||
| Industrial Machinery | 3 | $64B |
|
||
| Healthcare | 2 | $55B |
|
||
| Retail / Pharmacy | 1 | $148B |
|
||
| Agriculture / Food | 1 | $86B |
|
||
Price history
+228.9% since first listed5 events — show timeline
- 2026-04-20 Pending — MRED as Distributed by MLS Grid
- 2026-04-09 Listed $199,000 MRED as Distributed by MLS Grid
- 2003-07-30 Sold (Public Records) $153,000 Public Records
- 1992-08-27 Sold (Public Records) $110,500 Public Records
- 1985-01-03 Sold (Public Records) $60,500 Public Records
Property tax history
+3.5%/yrLatest (2023): $6,395 · -9.5% YoY. Source: county tax records.
Cash-flow waterfall
monthlySold comps — $/sqft
last 12 mo · ≤1 miLoading sold comps…